
Key Highlights
- Gold started a fresh increase above $4,850 and $5,000.
- A major contracting triangle is forming with resistance at $5,140 on the 4-hour chart.
- WTI Crude Oil faces resistance near $63.85 and $64.50.
- USD/JPY retested the 152.25 support zone and started a consolidation phase.
Gold Price Technical Analysis
Gold remained well bid above $4,650 against the US Dollar. The price formed a base and was able to settle above the $4,850 resistance zone.
The 4-hour chart of XAU/USD indicates that the price climbed above the 50% Fib retracement level of the downward move from the $5,598 swing high to the $4,401 low. The price even surpassed the 100 Simple Moving Average (red, 4 hours) and remained well above the 200 Simple Moving Average (green, 4 hours).
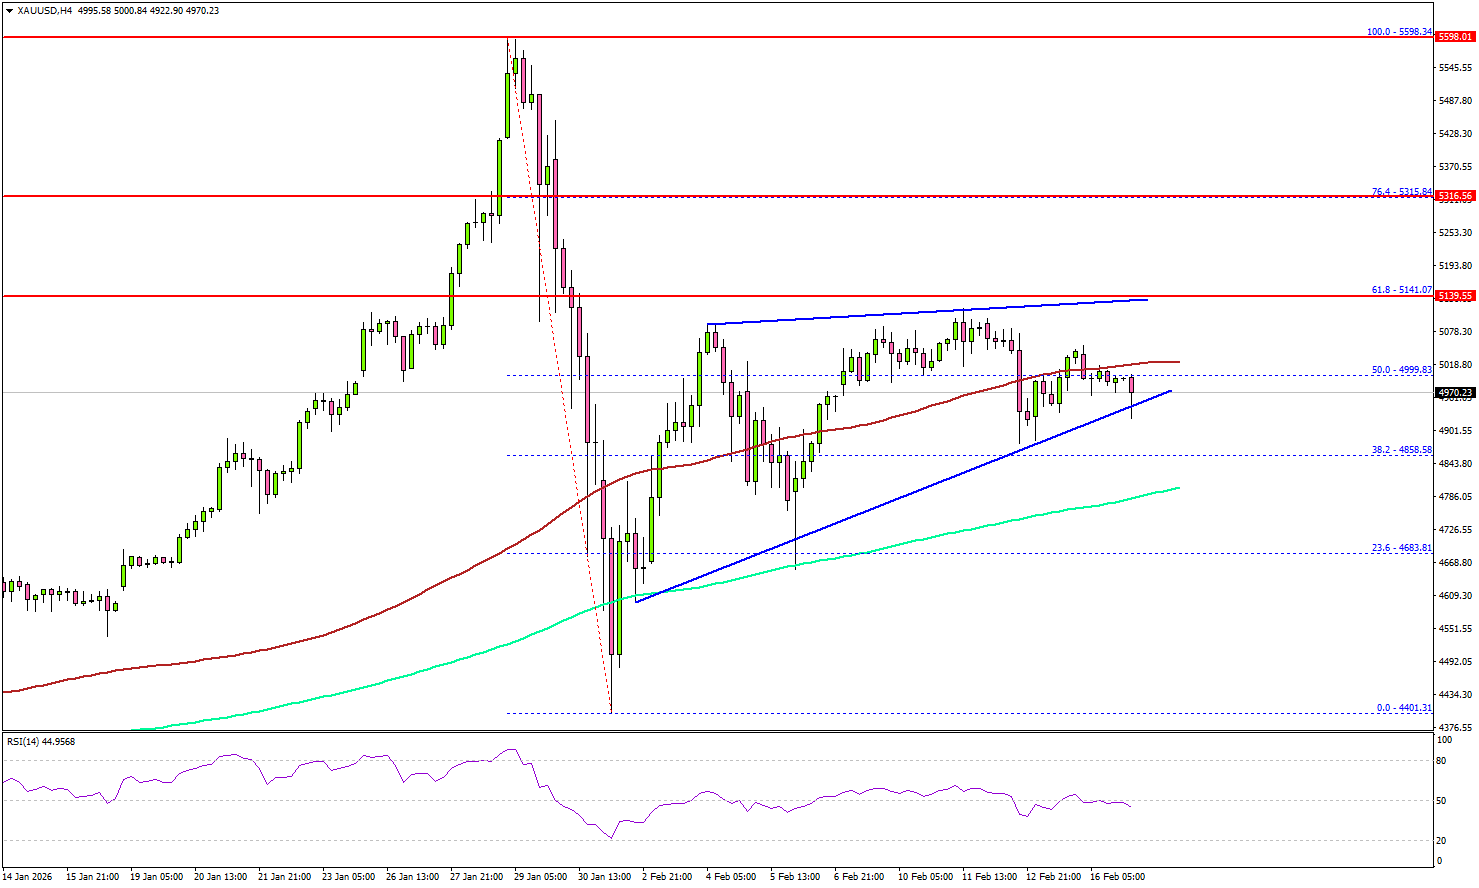
However, the bears are now active near the $5,120 and $5,140 levels. There is also a major contracting triangle forming with resistance at $5,140. The next major resistance sits near $5,250.
A clear move above $5,250 could open the doors for more upside. In the stated case, the bulls could aim for a move toward $5,315 and the 76.4% Fib retracement level of the downward move from the $5,598 swing high to the $4,401 low. The main target for the bulls could be $5,500.
If there is another decline, Gold might find bids near the $4,960 level. The first major support sits at $4,820, below which the price might slide to $4,680. The main support sits at $4,550. Any more losses might call for a test of $4,440 or even $4,400 in the coming days.
Looking at WTI Crude Oil, the price recovered above $65.00 before the bears took a stand near $65.50.
Economic Releases to Watch Today
- UK Claimant Count Change for Jan 2026 – Forecast 22.8K, versus 17.9K previous.
- UK ILO Unemployment Rate for Dec 2025 (3M) – Forecast 5.1%, versus 5.1% previous.
- NY Empire State Manufacturing Index for Feb 2026 – Forecast 6.0, versus 7.7 previous.