Currency pair EUR/USD
The EUR/USD tested the 61.8% Fibonacci zone of wave 2 vs 1 and price used the support level for a bullish bounce. This could be part of an ABC (blue) flat correction within wave X (purple) of a larger wave 2 (pink) if price bounces at the resistance trend line (red). Alternatively a break below the 138.2% Fib invalidates the wave B (blue) and could indicate a bearish move towards 1.1650 and 1.16.
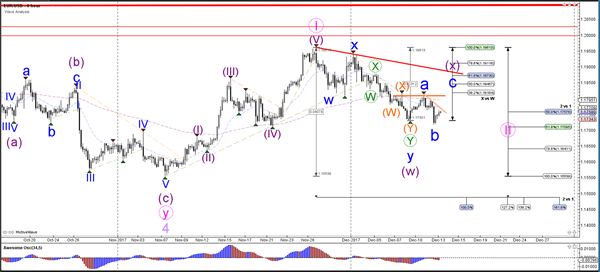
The EUR/USD could build a bullish ABC (blue) flat correction within wave X (purple). Price seems to be bouncing at the 127.2% Fib of wave B (blue) and could move towards the 61.8% Fib of wave X (purple).
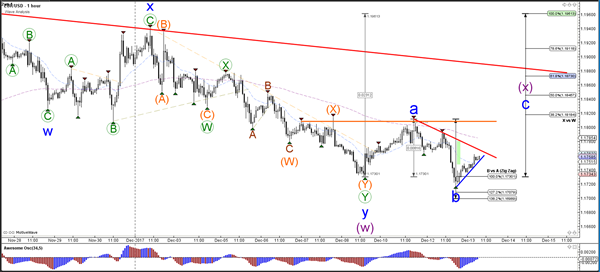
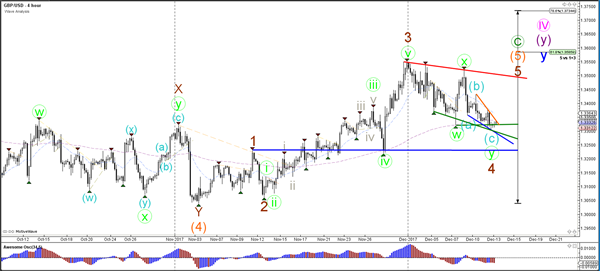
Currency pair GBP/USD
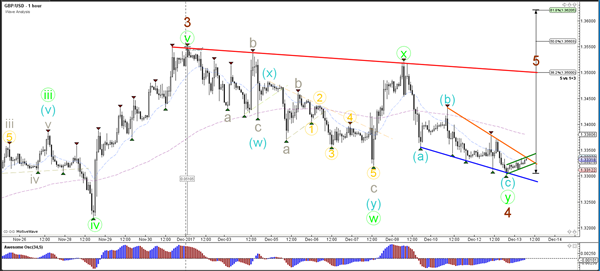
A GBP/USD is showing choppy and corrective price action which is probably part of a wave 4 (brown). The wave 4 (brown) pattern is valid as long as price stays above the top of wave 1 (blue).
The GBP/USD is building a falling wedge reversal chart pattern which could indicate a potential bullish breakout if price manages to break above the resistance trend line (orange). A break below the support trend line (blue) could indicate a bearish breakout.
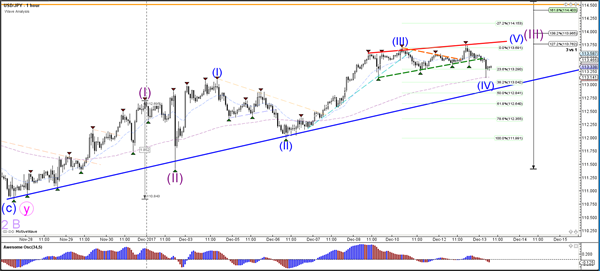
Currency pair USD/JPY
The USD/JPY could be a in wave 3 (purple) if price manages to stay above the support trend line (blue) and 50% Fibonacci level. The alternative scenario is that price is building a wave C rather than a wave 3.
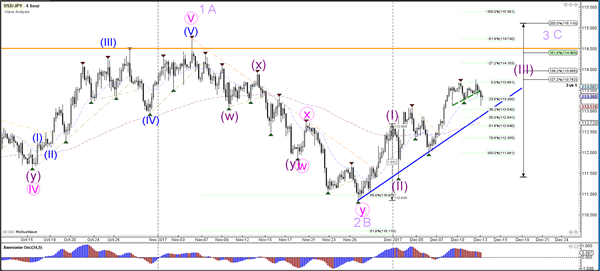
The USD/JPY broke the trend lines but is still moving sideways. Price seems to be respecting the Fibonacci levels of wave 4 (blue) but a break below the 50% Fib would make a wave 4 unlikely.