
Key Highlights
- GBP/USD started a fresh decline and traded below 1.3400.
- A key bearish trend line is forming with resistance at 1.3485 on the 4-hour chart.
- EUR/USD extended losses and dived below 1.1620.
- Crude Oil prices rallied above $76.00 before trimming some gains.
GBP/USD Technical Analysis
The British Pound failed to stay above 1.3500 and declined against the US Dollar. GBP/USD traded below the 1.3450 and 1.3420 levels to enter a bearish zone.
Looking at the 4-hour chart, the pair settled below 1.3400, the 100 simple moving average (red, 4-hour), and the 200 simple moving average (green, 4-hour). A low was formed at 1.3253, and the pair is now consolidating losses.
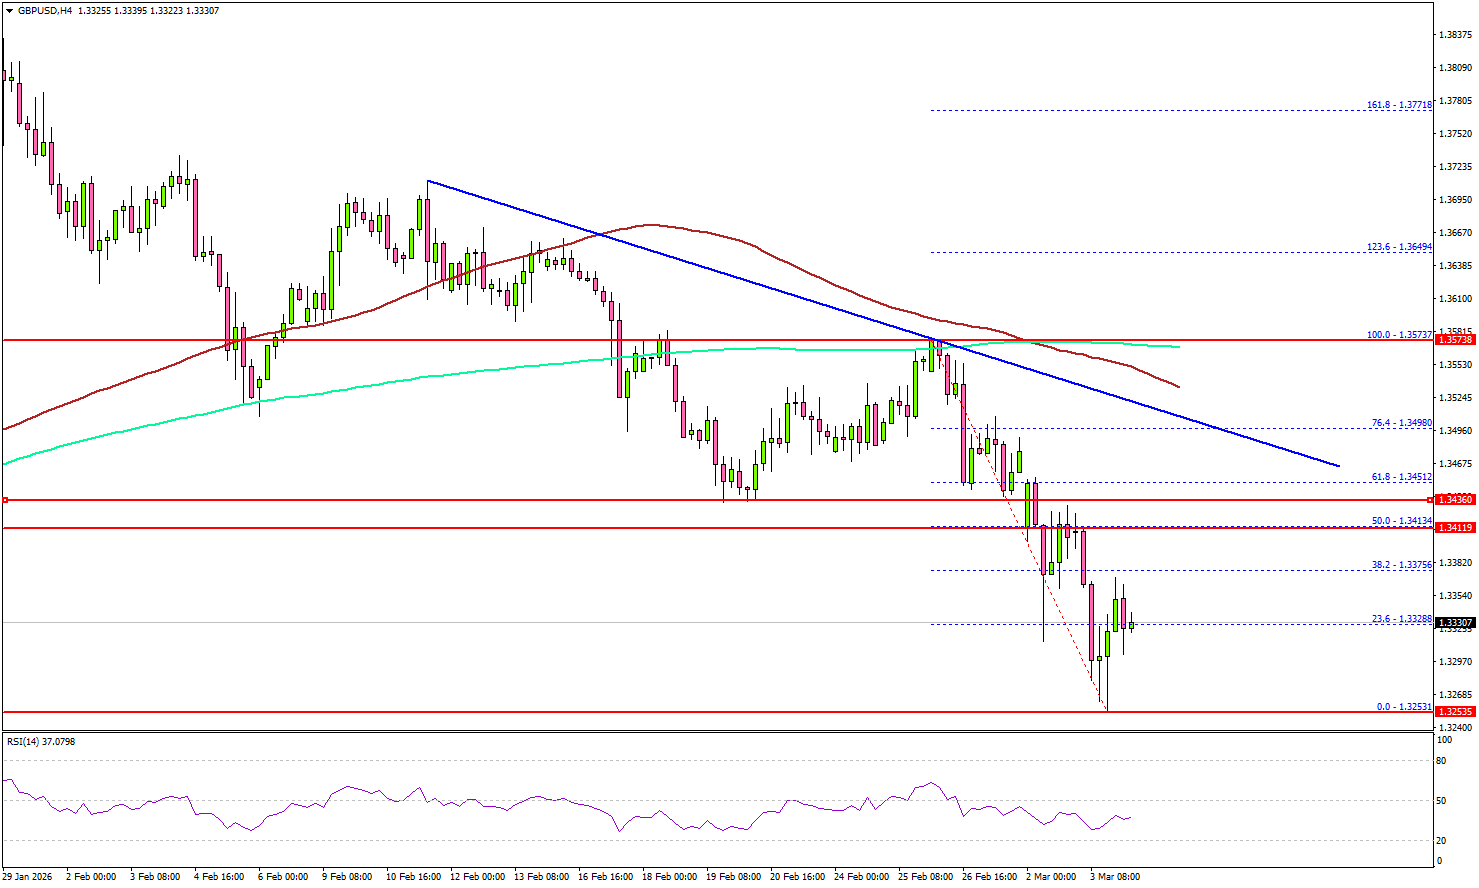
There was a minor upward move above the 23.6% Fib retracement level of the downward move from the 1.3573 swing high to the 1.3253 low. On the upside, the pair is now facing sellers near 1.3375.
The first major resistance sits at 1.3410 or the 50% Fib retracement level of the downward move from the 1.3573 swing high to the 1.3253 low. A close above 1.3410 could open the doors for more gains. In the stated case, the bulls could aim for a move to 1.3450.
The main resistance sits near 1.3500. There is also a key bearish trend line forming with resistance at 1.3485. Immediate support could be 1.3265. The first major area for the bulls might be near 1.3250.
The main support sits at 1.3220, below which the pair might gain bearish momentum. In the stated case, it could even revisit 1.3000 in the coming days.
Looking at EUR/USD, the pair started a fresh decline below 1.1620, and there are chances of more losses in the near term.
Upcoming Key Economic Events:
- UK Services PMI for Feb 2026 – Forecast 53.9, versus 53.9 previous.
- US ISM Services Index for Feb 2026 – Forecast 53.5, versus 53.8 previous.


