
Key Highlights
- GBP/USD extended losses and traded below 1.3300.
- A key bearish trend line is forming with resistance at 1.3380 on the 4-hour chart.
- EUR/USD seems to be facing resistance near 1.1550 and 1.1565.
- Gold prices declined heavily from $5,050 and traded below $5,000.
GBP/USD Technical Analysis
The British Pound failed to stay above 1.3380 against the US Dollar. GBP/USD declined further and traded below 1.3350 to enter a bearish zone.
Looking at the 4-hour chart, the pair is struggling below the 1.3580 resistance, the 100 simple moving average (red, 4-hour), and the 200 simple moving average (green, 4-hour). There is also a key bearish trend line forming with resistance at 1.3380.
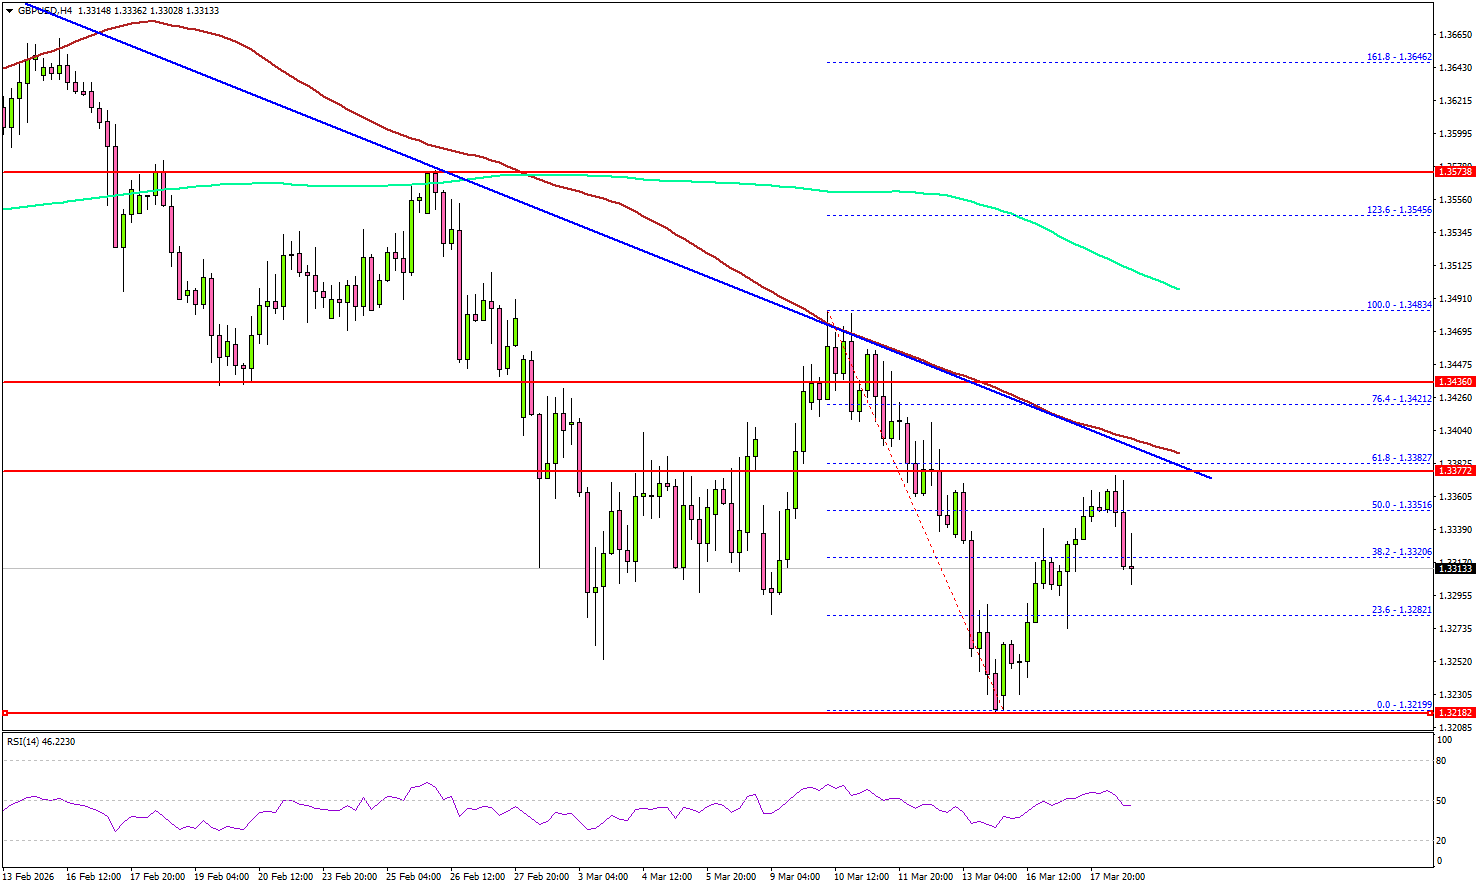
The pair traded as low as 1.3219 and is currently consolidating losses. On the upside, the pair is now facing sellers near 1.3380, the 61.8% Fib retracement level of the downward move from the 1.3483 swing high to the 1.3219 low, the 100 simple moving average (red, 4-hour), and the same trend line.
The first major resistance sits at 1.3420. A close above 1.3420 could open the doors for gains above 1.3450. In the stated case, the bulls could aim for a move to 1.3500. Any more gain might open the doors for a test of 1.3550.
If there is no upside break above the trend line, the pair might start a fresh decline. Immediate support is seen near 1.3280. The first key support sits at 1.3250. A close below 1.3250 might call for heavy losses. In the stated case, it could even revisit 1.3120 in the coming days.
Looking at Gold, the price failed to settle above $5,120, resulting in a strong bearish reaction below $5,020.
Upcoming Key Economic Events:
- UK Claimant Count Change for Feb 2026 – Forecast 25.8K, versus 28.6K previous.
- UK ILO Unemployment Rate for Jan 2026 (3M) – Forecast 5.3%, versus 5.2% previous.
- BoE Interest Rate Decision – Forecast 3.75%, versus 3.75% previous.
- US Initial Jobless Claims – Forecast 215K, versus 213K previous.


