
Silver (XAGUSD) reached an all-time high of $121.64 on January 29, 2026, before entering a larger corrective phase. The decline has unfolded as a zigzag Elliott Wave structure, a common corrective pattern in technical analysis. Wave a concluded at $71.31, while wave b terminated at $96.39. The market is now progressing through wave c, which is developing as an impulse Elliott Wave.
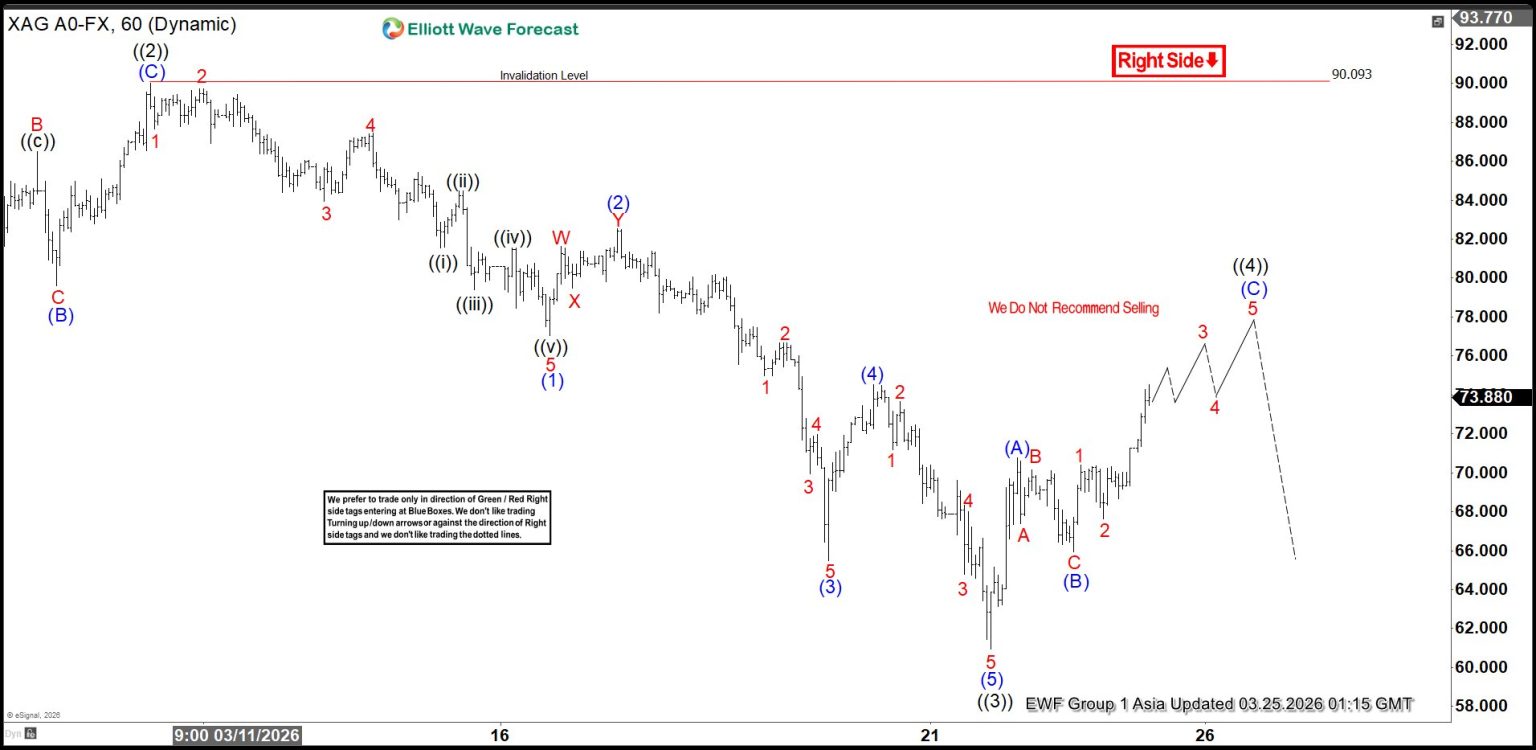
From the end of wave b, wave ((1)) finished at $77.92, followed by a rally in wave ((2)) that reached $90.09. The metal then extended lower in wave ((3)), which subdivided into five distinct waves. Within this sequence, wave (1) ended at $77.03, wave (2) at $82.53, wave (3) at $65.47, and wave (4) at $74.54. The final leg, wave (5), concluded at $60.95, thereby completing wave ((3)) at a higher degree.
At present, wave ((4)) is unfolding as a corrective rally. This move retraces the cycle that began from the March 10, 2026 high, before the market resumes its downward trajectory. In the near term, as long as the pivot at $90.09 remains intact, rallies are expected to fail in either three or seven swings. Such failure would confirm renewed downside pressure. The broader implication is that Silver remains vulnerable to further weakness once the current corrective rally exhausts itself.
Silver (XAGUSD) 60-Minute Elliott Wave Chart
XAGUSD Elliott Wave Video:
You are currently viewing a placeholder content from Default. To access the actual content, click the button below. Please note that doing so will share data with third-party providers.


 reached an all-time high of $121.64 on January 29, 2026, before entering a larger corrective phase. The decline has unfolded as a zigzag Elliott Wave structure, a common corrective pattern in technical analysis. Wave a concluded at $71.31, while wave b terminated at $96.39. The market is now progressing through wave c, which is developing as an impulse Elliott Wave.)