
The US Dollar has been in the spotlight over the past two months, after remaining the pet peeve for FX since early 2025.
With wartime, however, things can change fast and decisively: the Global Reserve has risen by 4.40% since its end-January lows in a blink.
The new Fed Chair elect, Hawkish repricings, Petrodollars, and a general backing away from risky trades built up sudden demand, particularly at a time when Asset Managers were the most bearish on the USD in 14 years – and when the Market is stuck on one side of a trade, it often results in huge reversals.
The Petrodollar trade, however, was the fuel for the currency Market throughout this month, and despite what seemed like a relative dissonance this week, as the tone sours again, the correlation is coming right back.
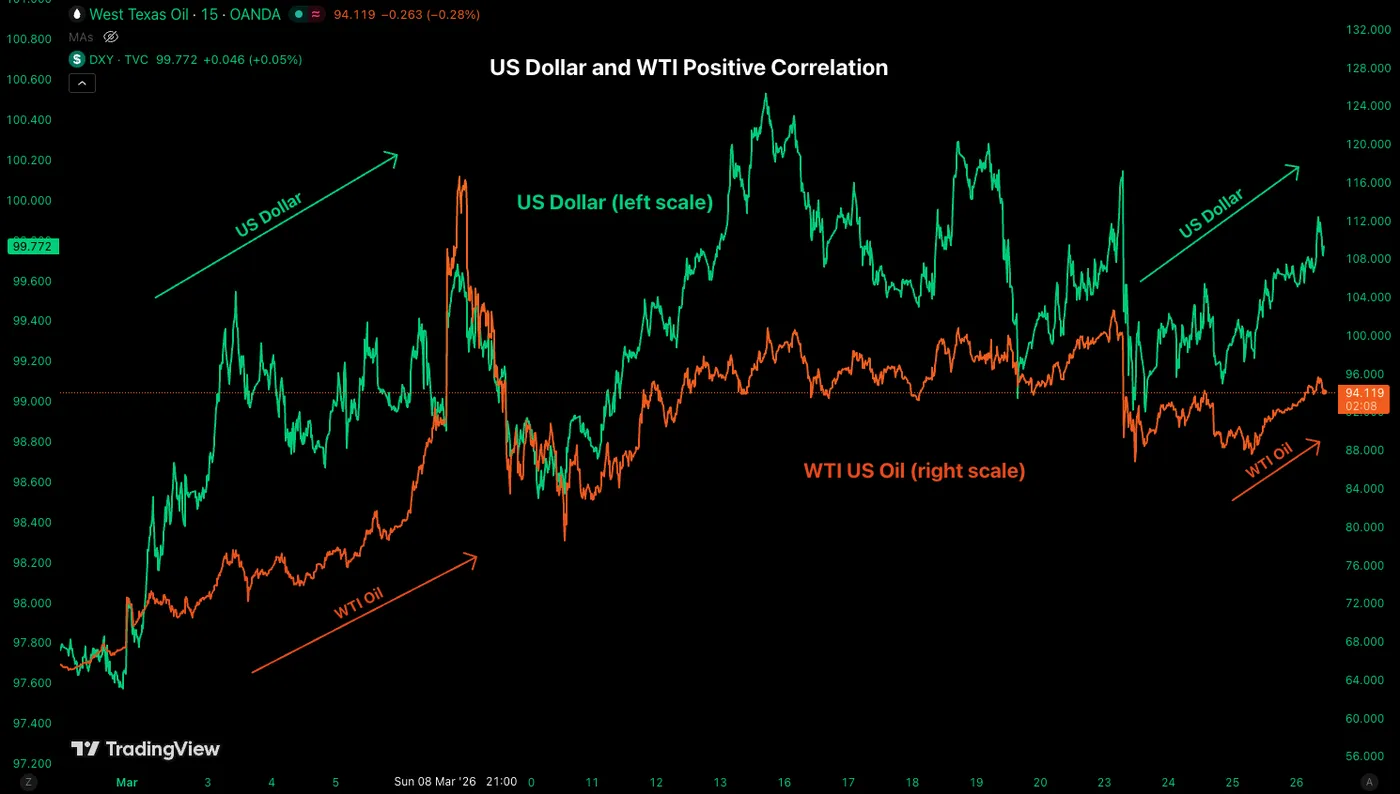
The Petrodollar trade – Oil and US Dollar Correlation. Source: TradingView
Indeed, after cautious optimism throughout this week’s trading following the announcement of the US-Iran talks, it seems that Iran is still heavily inclined to maintain its strategic advantage over the Strait of Hormuz and its ballistic missile capabilities, two of the most contentious points in the indirect talks.
But the real issue for Markets is that President Trump’s tone has gradually grown more pessimistic, and this coincides with the fact that the huge Marine fleet is arriving in the Arabian Sea in less than a day – so where are these mere distraction tactics?
Good question as War strategy is something that us common mortals cannot fully grasp – the Art of War, legendary treatise, can help in that sort (and is also a great read for traders).
Deception tactics are common, and nobody can really understand what any side has in mind.
What is sure, however, is that WTI is now rebounding toward $95, the higher bound of its momentum pivot, and above the psychological level, sentiment will sour even further.
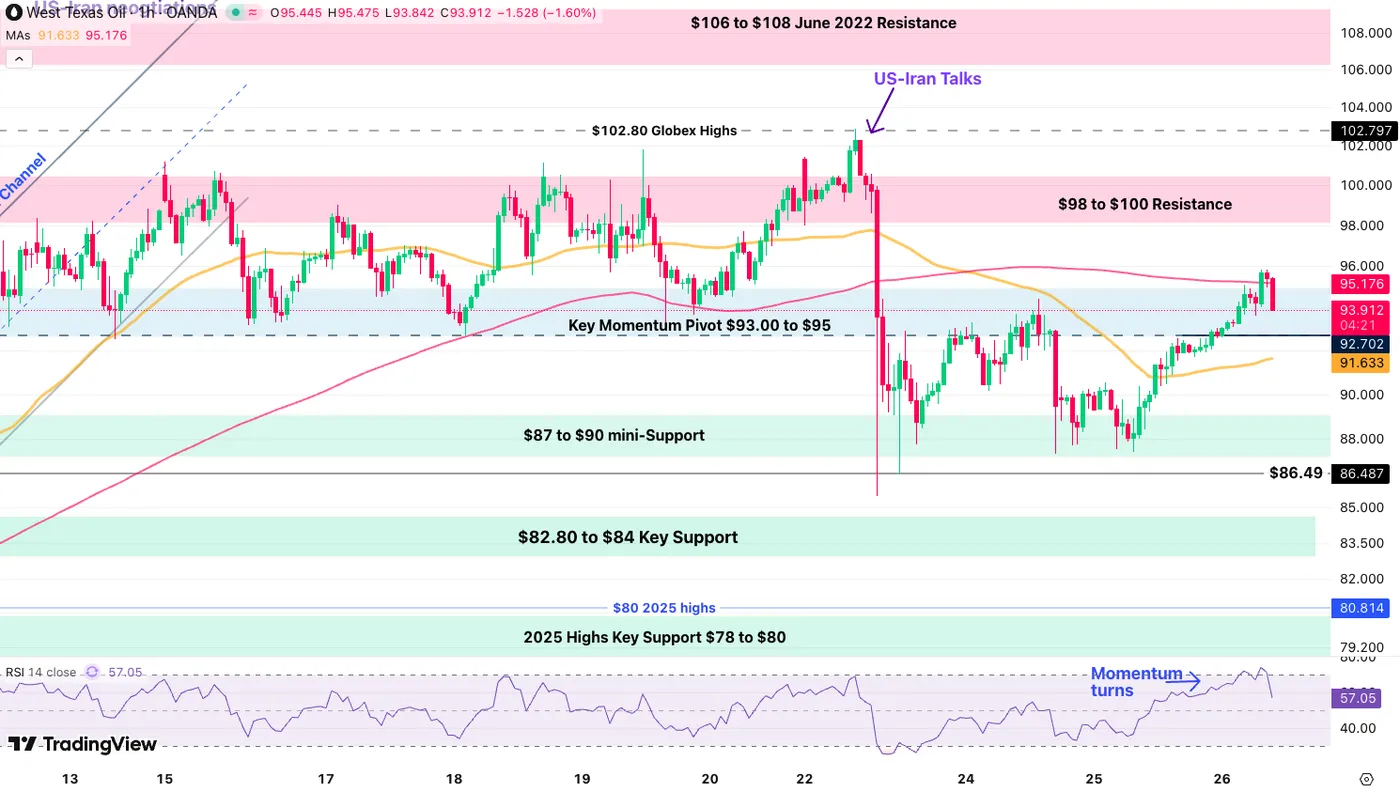
WTI (US) Oil 1H Chart – March 26, 2026. Source: TradingView
At least, the US Dollar is enjoying this move, amid a more hesitant FX session. As further clarity is expected in the next 24 hours, consider current levels as indications of doubtful neutrality amid the ongoing war.
Anything above in Oil and the Dollar implies a worsening in conditions and sentiment, which should drag into next week (+ Pessimistic)
On the other hand, a return below $90 in WTI will be most welcome to investors (+ Optimistic)
We will look at the Dollar Index, EUR/USD, and AUD/USD to assess the current state of the Market and whether more upside is warranted for the Dollar amid resurfacing doubts.
Dollar Index 4H Chart
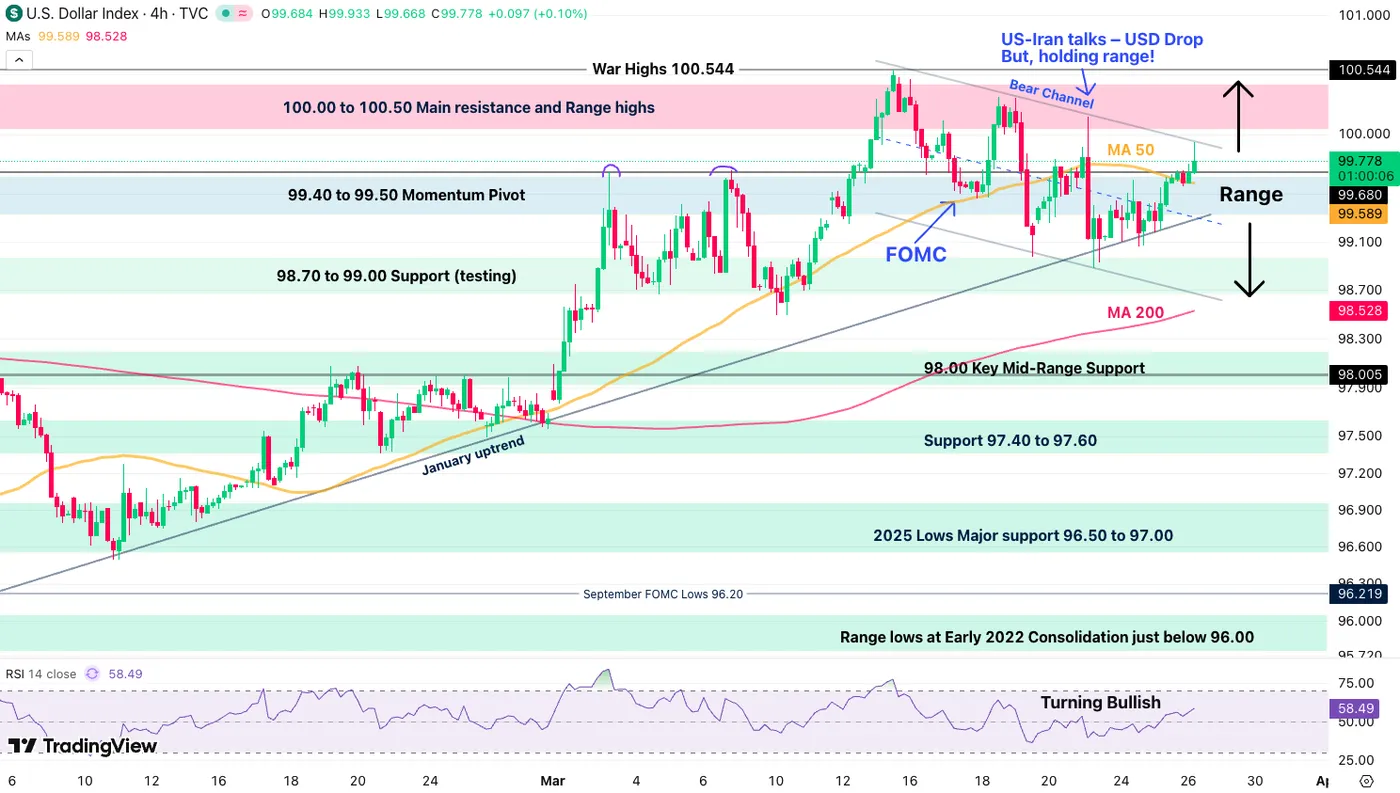
Dollar Index 4H Chart, March 26, 2026 – Source: TradingView
The US Dollar attempted a corrective sequence as the US-Iran talks were announced, but with WTI not correcting much further, the currency still receives fundamental support.
A few technical elements are developing in the Dollar Index which can help to find trades in major FX pairs:
- A short term, relatively flat bear-channel has developed and contained the Index movement. Traders may either use it as points of entry to long and short the US Dollar or as breakout signal – We are currently reaching its highs (99.90).
- Its lows are at around 98.65.
- A more Neutral 99.00 to 100.00 Range is holding for now – It is less responsive but more stable to watch the higher timeframe movement.
Levels of interest for the Dollar Index:
Resistance Levels
- Morning Spike 99.93 and Channel Top
- Weekly range highs 100.00
- 100.00 to 100.50 Main Resistance Zone
- War Highs 100.544
Support Levels
- Intraday micro support 99.30
- 98.70 to 99.00 Support (Mini Range lows)
- 98.00 2025 Support
- Support 97.40 to 97.60
- 2025 Lows 96.40 to 96.80 Support
AUD/USD 4H Chart and Technical Levels
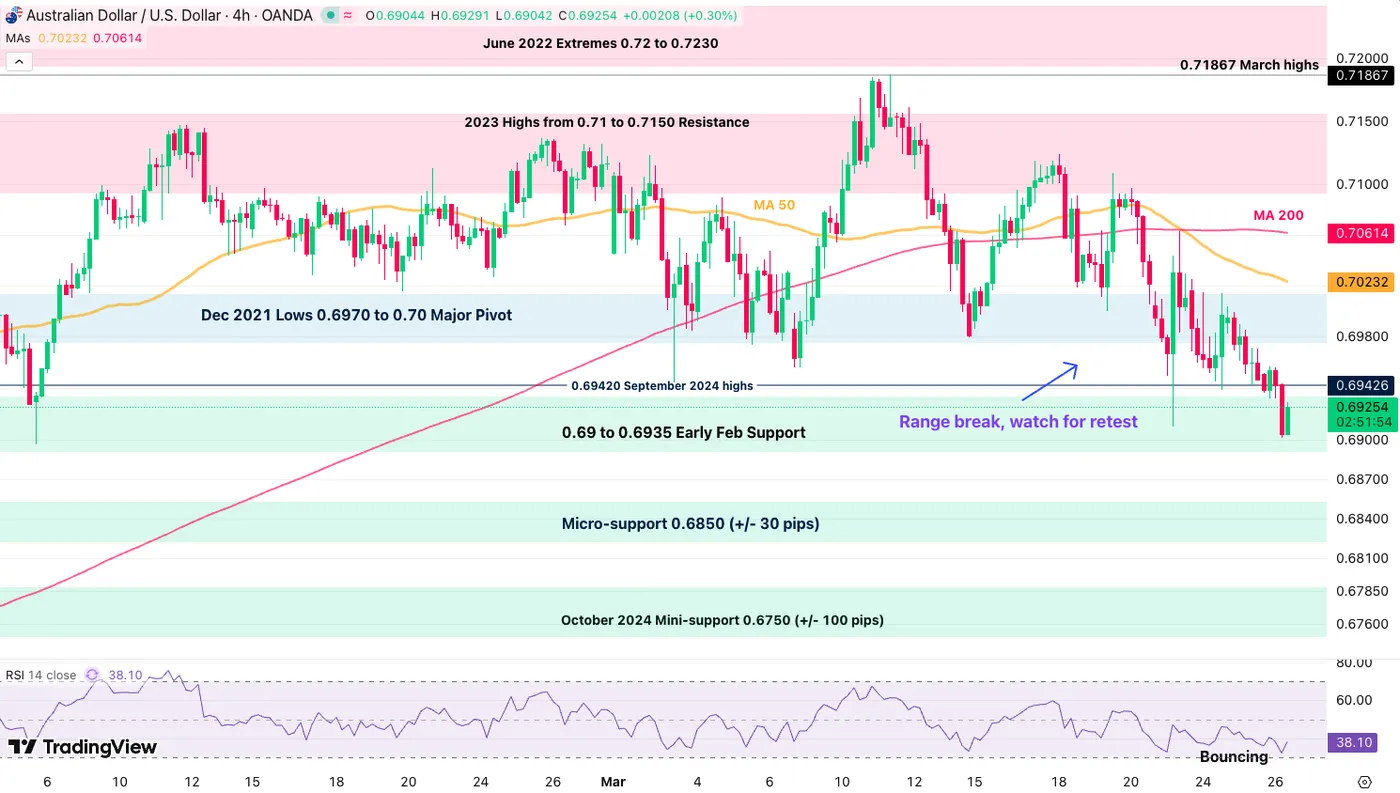
AUD/USD 4H Chart, March 26, 2026 – Source: TradingView
AUD/USD just broke its past month’s 0.6970 to 0.7150 Major range to the downside, indicating high potential for a further correction.
Fundamentals are changing for the Aussie dollar after a strong period after two consecutive hikes from the RBA, particularly after Australian CPI surprised to the downside.
Failing to rebound above 0.6980 would hint at more bearish activity in the major pair.
Levels of interest for AUD/USD:
Resistance Levels
- Dec 2021 Lows 0.6970 to 0.70 Major Pivot (broken range holds above)
- Mini Resistance 4H MA 50 – 0.7020; Bullish above
- 2023 Highs from 0.71 to 0.7150 Resistance
- 0.71867 March highs
- June 2022 Extremes 0.72 to 0.7230
Support Levels
- 0.69 to 0.6935 Early Feb Support
- 0.69015 session lows
- Micro-support 0.6850 (+/- 30 pips)
- October 2024 Mini-support 0.6750 (+/- 100 pips)
EUR/USD 4H Chart and Technical Levels
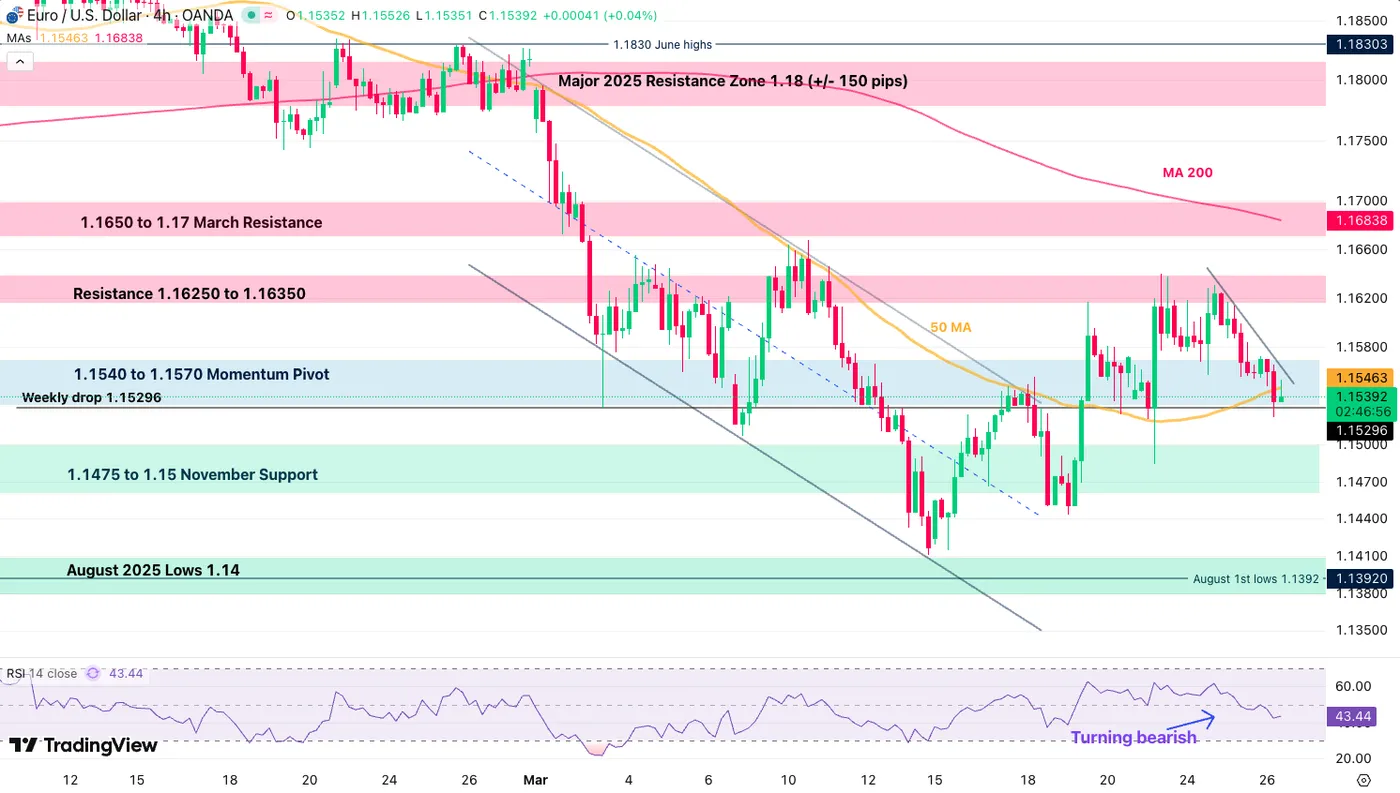
EUR/USD 4H Chart, March 26, 2026 – Source: TradingView
EUR/USD is now turning bearish, breaking its 4H 50-period MA after a double top this week and crossing below its Pivot Zone (1.1540 to 1.1570).
This hints at a test around at least the 1.1475 to 1.15 November Support, which could extend further to the 1.1410 War lows if the situation deteriorates.
Levels to place on your EUR/USD charts:
Resistance Levels
- Immediate resistance 1.1546
- Resistance 1.16250 to 1.16350
- 1.1650 to 1.17 March Resistance
- 1.1750 mini-resistance and Channel Top
- Resistance Zone around 1.18 (+/- 150 pips)
Support Levels
- 1.1475 to 1.15 November Support
- War lows 1.1410
- 1.1350 to 1.14 Support
- 1.12 to 1.13 Next Main Support Zone
Safe Trades and keep a close eye on Middle East developments!


