
- GBP/USD is under pressure due to cautious market sentiment, USD strength stemming from Middle East ceasefire strains, and uncertainty following President Trump’s delay of Iran’s energy plant destruction.
- Technical analysis reveals a bull flag pattern on the H1 chart, suggesting a potential 100-pip rally
- If the price fails to clear the 200 SMA and breaks the 1.3320 support, a move toward the YTD low of 1.3223 is possible.
GBP/USD edged its way lower on Thursday as hopes of a ceasefire in the Middle East came under strain. Mixed reports and comments from both sides saw markets adopt a cautious approach with the USD gaining a bid as a result.
Late in the day President Trump announced the delay of Iran’s energy plant destruction by ten days, until April 6 at 08:00 PM Eastern Time. President Trump emphasized that talks between Washington and Tehran are going “very well” and he decided to pause at the request of the Iranian Government. Trump’s previous deadline was Friday, with the question now being whether this is genuine or another ruse ahead of the weekend?
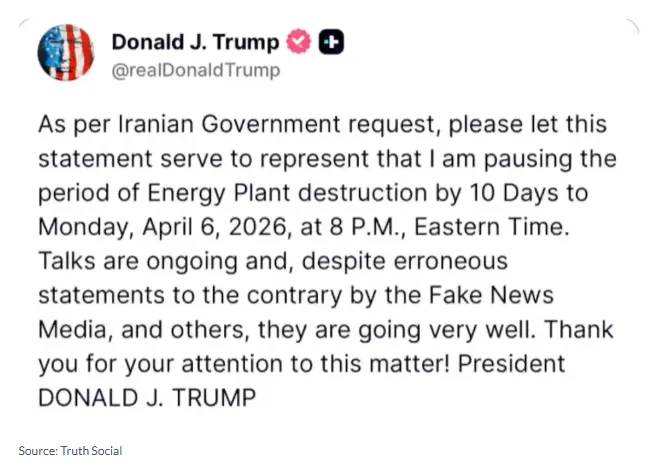
Source: TruthSocial
Markets may remain concerned that the US could mount a ‘sneak attack’ over the weekend with defensive positioning and haven demand likely to catch a bid as a result. Such a scenario could weigh on GBP/USD.
What do the technicals say?
Looking at the technical picture and on the H1 chart below GBP/USD has edged its way lower since printing a fresh high around 1.34800 on March 23.
There is a bull flag pattern in play on the H1 chart with a breakout leading to a potential 100-pip rally to the upside.
Such a move does face challenges though, as price is currently trading near 1.3333, sitting just below the 200-period Simple Moving Average (SMA). There is also the 100 SMA (Blue), which is currently above the 200 SMA (Black) at around the 1.3372 handle.
Both of these MAs will need to be cleared first if a rally higher and breakout of the bull flag pattern is to materialize.
If the price remains below the 200 SMA (Black line) and breaks the 1.3320 support, expect a move toward the YTD low of 1.3223.
GBP/USD Daily Chart, March 26, 2026
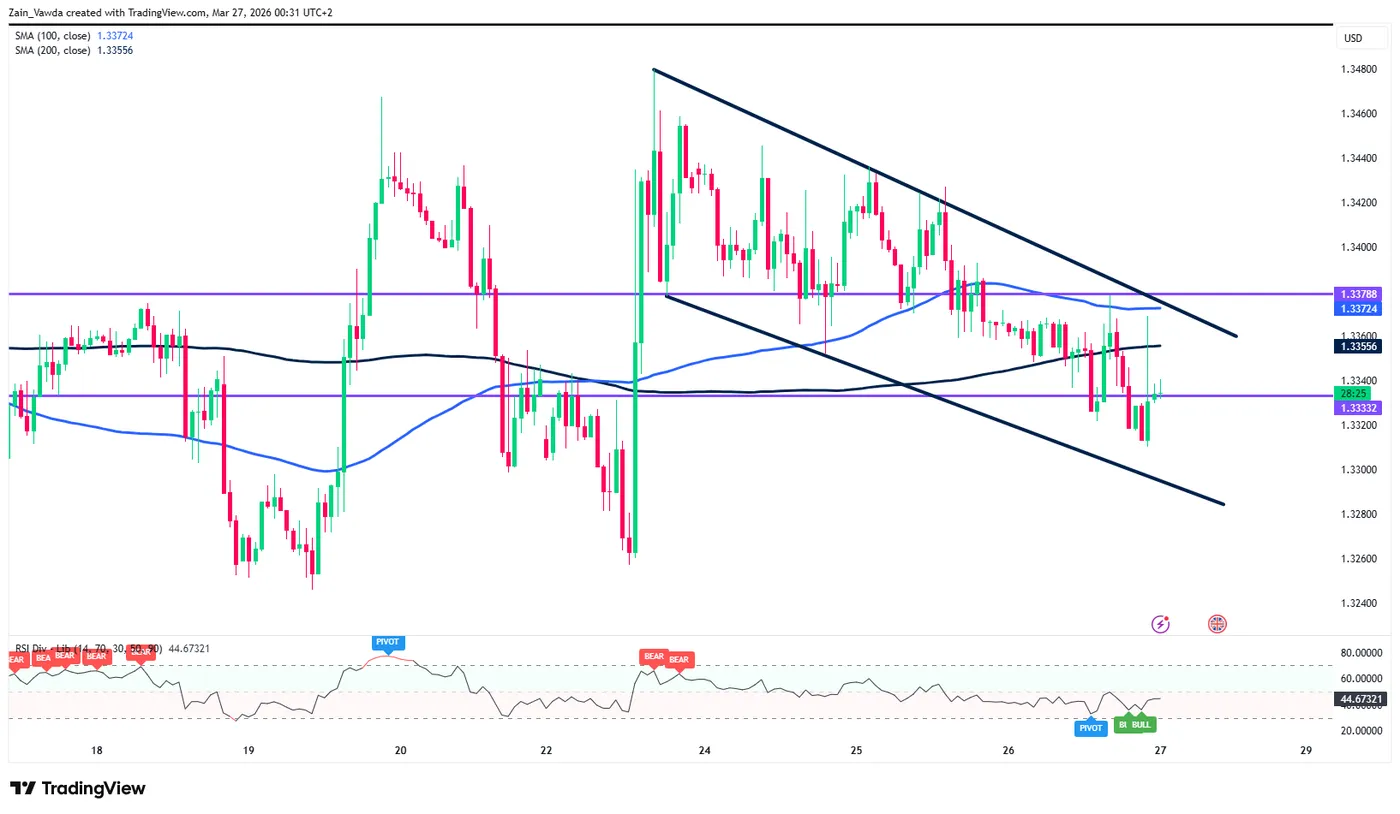
Source: TradingView
UK retail sales to serve as a catalyst?
Early on Friday UK retail sales data is due in what is otherwise a rather quiet day on the economic calendar front. Market consensus is for a print -0.8% MoM print with the YoY print 2.1%.
A better than expected figure may provide a temporary bounce for GBP/USD but is unlikely to inspire a sustained break of the bull flag pattern. Any gains may prove temporary without a material change to overall sentiment which continues to support the greenback.


