
Key takeaways
- Pullback complete, bullish structure emerging: WTI corrected 17% from $102.25 to $85.50 but has stabilised above its 20-day moving average, reclaimed $93.70, and is now positioned to retest the $102.25 resistance.
- Fundamentals support upside pressure: Deepening backwardation (-21.74) signals tightening near-term supply amid escalating US–Iran tensions, reinforcing upward pressure on crude prices.
- Breakout levels to watch: A sustained move above $102.25 could trigger a fresh bullish leg toward $111–$124, while a break below $85.50 would invalidate the bullish view and expose downside toward the $81–$73 zone.
The price actions of the West Texas Oil CFD (a proxy of the WTI crude oil futures) have staged the expected minor corrective pullback of 17% from its key $102.25 near-term range resistance after a retest on Monday, 23 March 2026, at the start of the London session to hit an intraday low of $85.50 at mid-London session on the same day due US President Trump’s “optimistic claims” that US and Iran are in the process of negotiating an immediate ceasefire deal.
Thereafter, the West Texas Oil CFD traded sideways above its 20-day moving average as Iran rejected the US’s ceasefire proposal and continued to strike the Gulf states’ key installations as the US-Iran war entered its 28th day.
In addition, conflicting messages are being sent out from the US White House Administration. US President Trump has extended by 10 days his pledge to refrain from attacks on Iranian energy-producing sites and added that the “negotiation talks are going very well”.
On the other hand, the Wall Street Journal has reported that the Pentagon is considering sending additional troops, as many as 10,000, to the Middle East, on top of the already deployed 2,000 soldiers from the 82nd Airborne Division. Hence, increasing the odds of a US ground invasion into Iranian soil as soon as this weekend.
Right now, several technical factors are suggesting the potential start of a new bullish up move sequence for West Texas crude oil at this juncture.
WTI calendar spread remains in negative territory
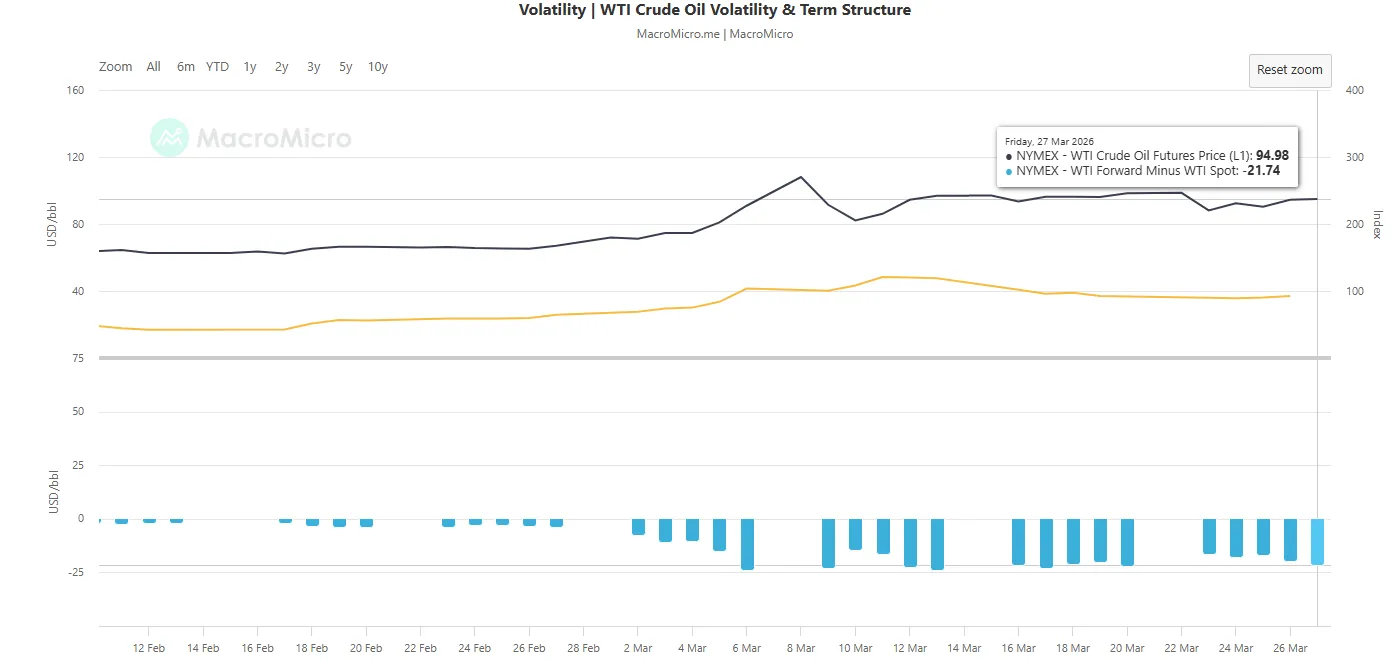
Fig. 1: WTI crude oil term structure (12-month forward minus spot rate) as of 27 Mar 2026 (Source: MacroMicro)
The WTI crude oil calendar spread, defined as the difference between the 12-month forward price and the spot price, serves as a gauge of the market’s structural conditions.
A positive spread (contango) reflects a typical environment where futures trade at a premium to spot, factoring in storage and transportation costs.
In contrast, a negative spread (backwardation) signals near-term supply tightness, with strong prompt demand pushing spot prices above futures.
At the time of writing, the spread has deepened into backwardation at -21.74, marking its most negative level since 6 March 2026 (-23.92) on the onset of the ongoing US-Iran war (see Fig. 1).
Hence, near-term prices of WTI crude oil are likely to face further upside pressure.
Let’s switch our attention to the potential short-term trajectory (1 to 3 days) of WTI crude oil.
WTI Crude Oil – Imminent potential bullish breakout above $102.25 minor range top
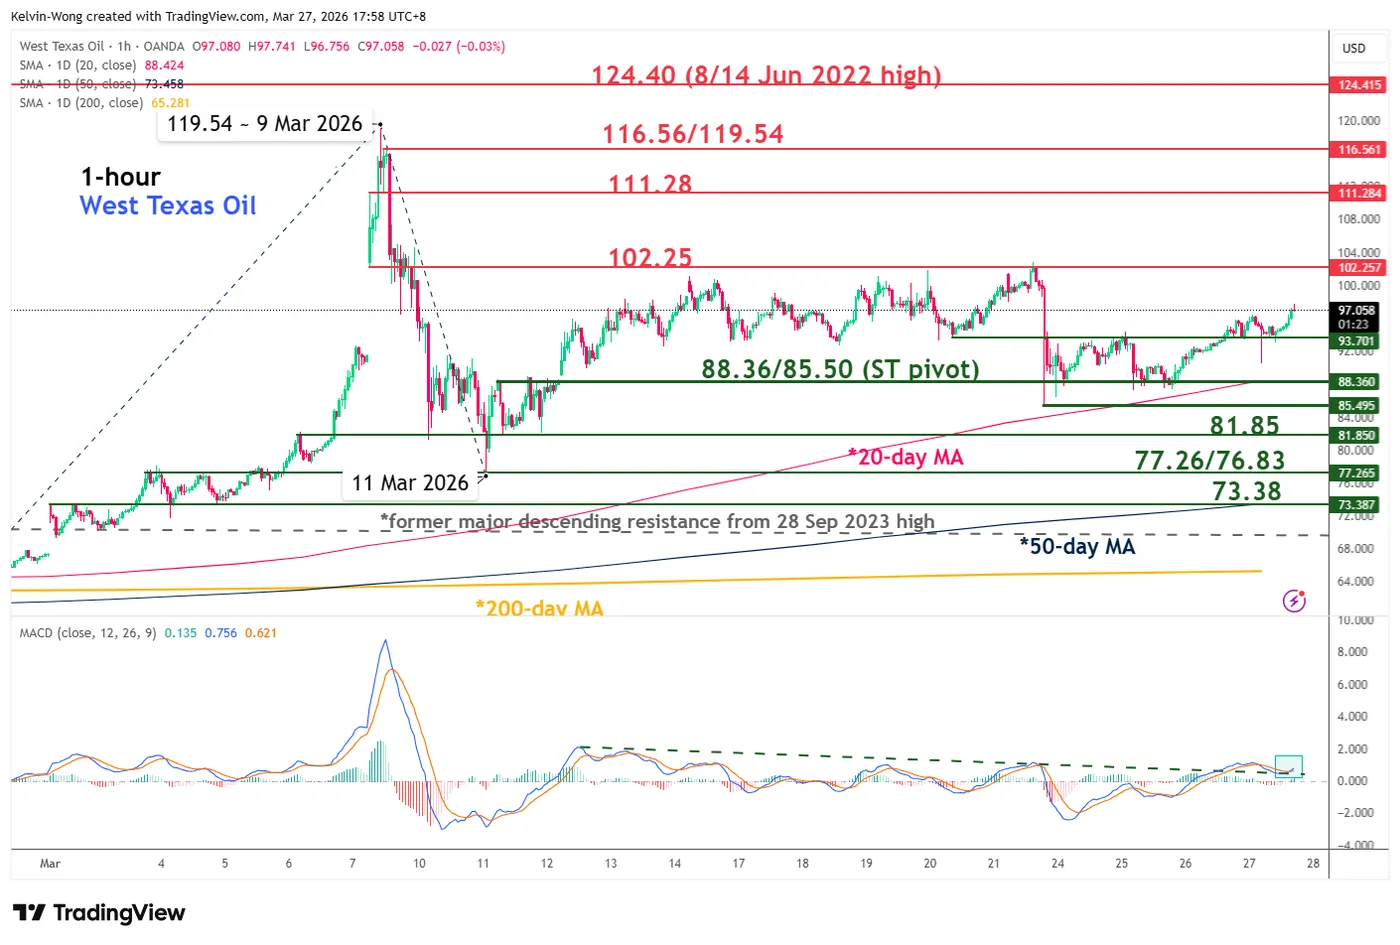
Fig. 2: West Texas Oil CFD minor trend as of 27 Mar 2026 (Source: TradingView)
The minor price structure of the West Texas Oil CFD (a proxy for WTI crude oil futures) has turned more constructive over the past four sessions, supported by its ability to hold above a rising 20-day moving average.
On Thursday, 26 March 2026, it has cleared above its $93.70 near-term resistance and is en route to retest its $102.25 minor range resistance in place since 16 March 2026.
Watch the $88.36/85.50 key short-term pivotal support to maintain the current bullish momentum, and a clearance above $102.25 increases the odds of a fresh bullish impulsive up move sequence to seek out the next intermediate resistances at $111.28, $116.56/119.54, and $124.40 (see Fig. 2).
However, a break and an hourly close below $85.50 invalidates the bullish scenario for an extension of the minor corrective decline to expose the next intermediate supports at $81.85, $77.26/76.83, and $73.38 (also the 50-day moving average).
Key elements to support the bullish bias on WTI crude oil
- Price actions remain above its rising 20-day and 50-day moving averages, which indicates that the medium-term uptrend phase remains intact.
- The hourly MACD trend indicator has just flashed out a bullish crossover condition above its centreline. This latest positive observation has occurred above its prior bullish breakout above its former key descending resistance on Thursday, 26 March 2026. An indication of a change of trend in the West Texas Oil CFD, from sideways to a minor bullish trend.


