
Ethereum has slowly broken out of its October downtrend that had led to its progressive, but brutal 64% correction.
Global disinterest for high-beta, AI and Tech assets had shun interest for Cryptocurrencies but with the Conflict turning the script on Energy prices, hence normal consumption, traders slowly turned away from traditional assets.
The idea is that Digital Assets are fairly isolated from any rise on Crude Oil or Nat Gas, quite the contrary. Crypto mining is energy intensive; hence, with higher costs, mining gets less interest, so that provides a temporary supply restriction which has a boosting effect on Cryptos.
Since the beginning of the conflict, Bitcoin and Ethereum are up 20%, while the Total Market Cap is up just a bit less (~18%) – While there is still a lot to cover to return to all-time highs, this is strong progress; Bulls will want to keep pushing and they might just turn the trend around.
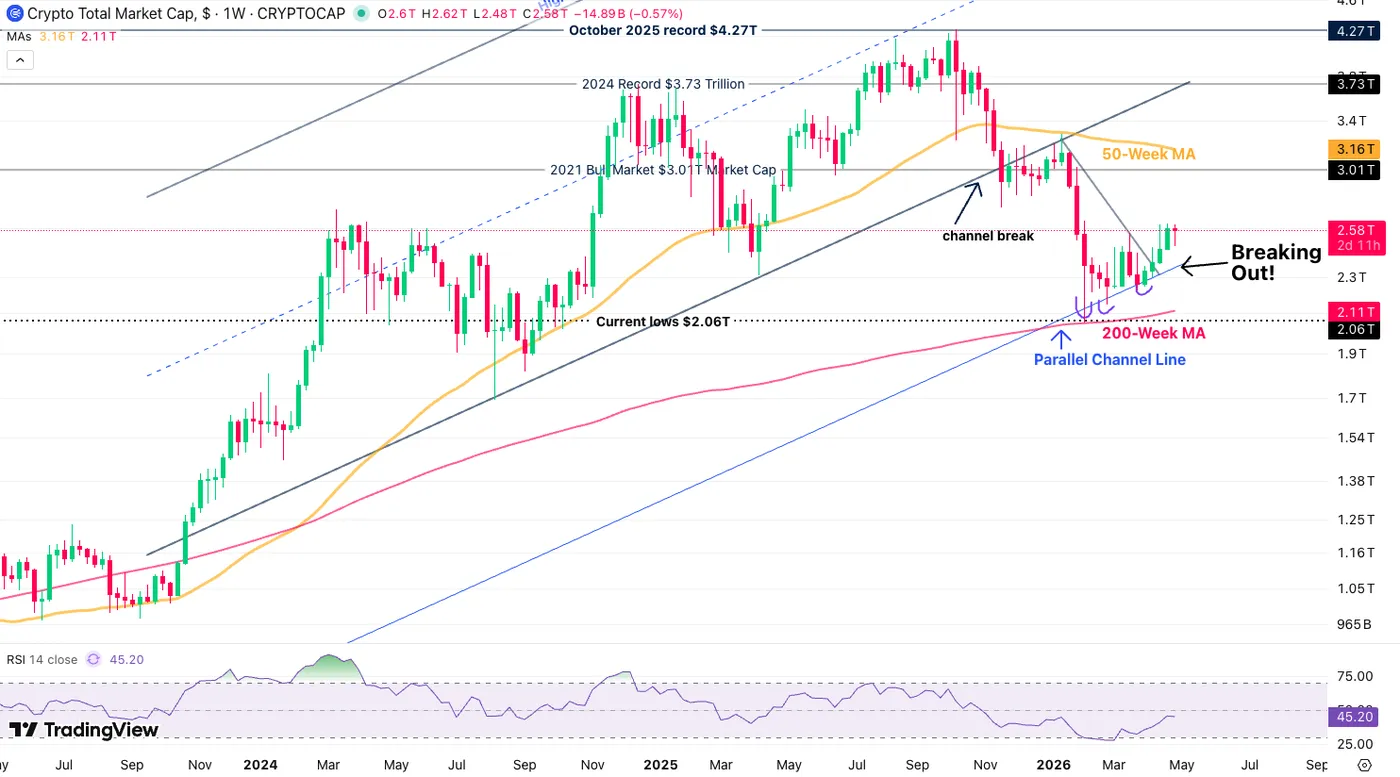
Crypto Total Market Cap – Source: TradingView. May 1, 2026
ETH/BTC – Bull flag formation?
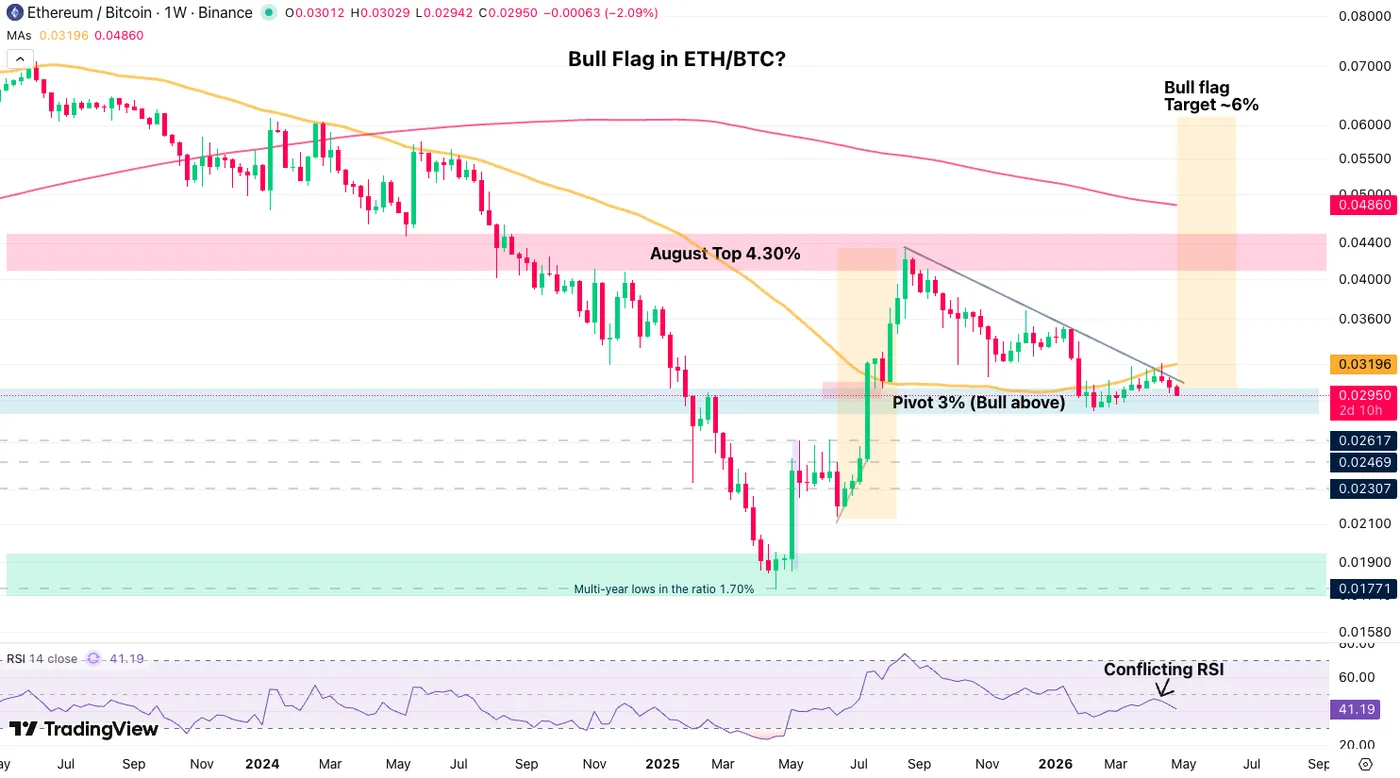
ETH/BTC – Source: TradingView. May 1, 2026
The Second to First Crypto ratio is essential to track the appetite for Altcoins, key to depth in the Digital Asset Market as Bitcoin had taken a significant advantage since it started rallying to its first $100,000 trip – The initial drop in ETH in August 2025 marked a top in the ratio
Today, ETH/BTC is hanging right around the 3% level, which itself does not imply much about the state of the Crypto Market, however, a bull flag formation could bring some happy days for Alternative Coins.
Its target is at 6% of the Bitcoin price, hence that would signify a significant rally in Ethereum which tends to trigger altcoin rallies (except if Bitcoin slashes its value, but in the past, that often reduced the ratio in a flight to Crypto Safety).
Ethereum Technical Analysis
ETH Daily Timeframe
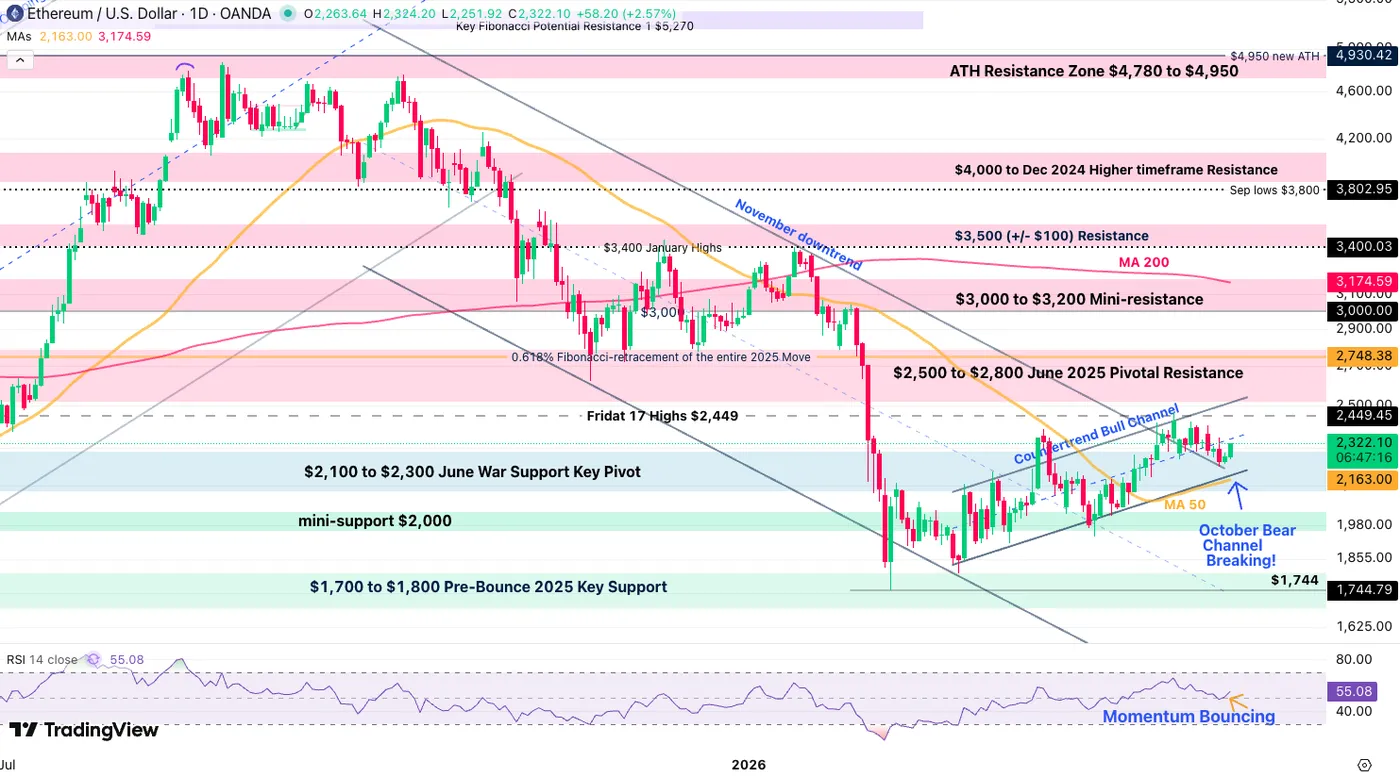
Ethereum Daily Chart, May 1, 2026 – Source: TradingView
Ethereum has now officially consolidated above its key $2,100 to $2,300 Pivot Zone and pushed above its downward Channel.
While momentum is still timid, a bounce from Neutral RSI, confirming with a nascent bull channel brings back higher odds to retest the $2,500 level (not seen since January).
ETH 4H Timeframe and Technical Levels
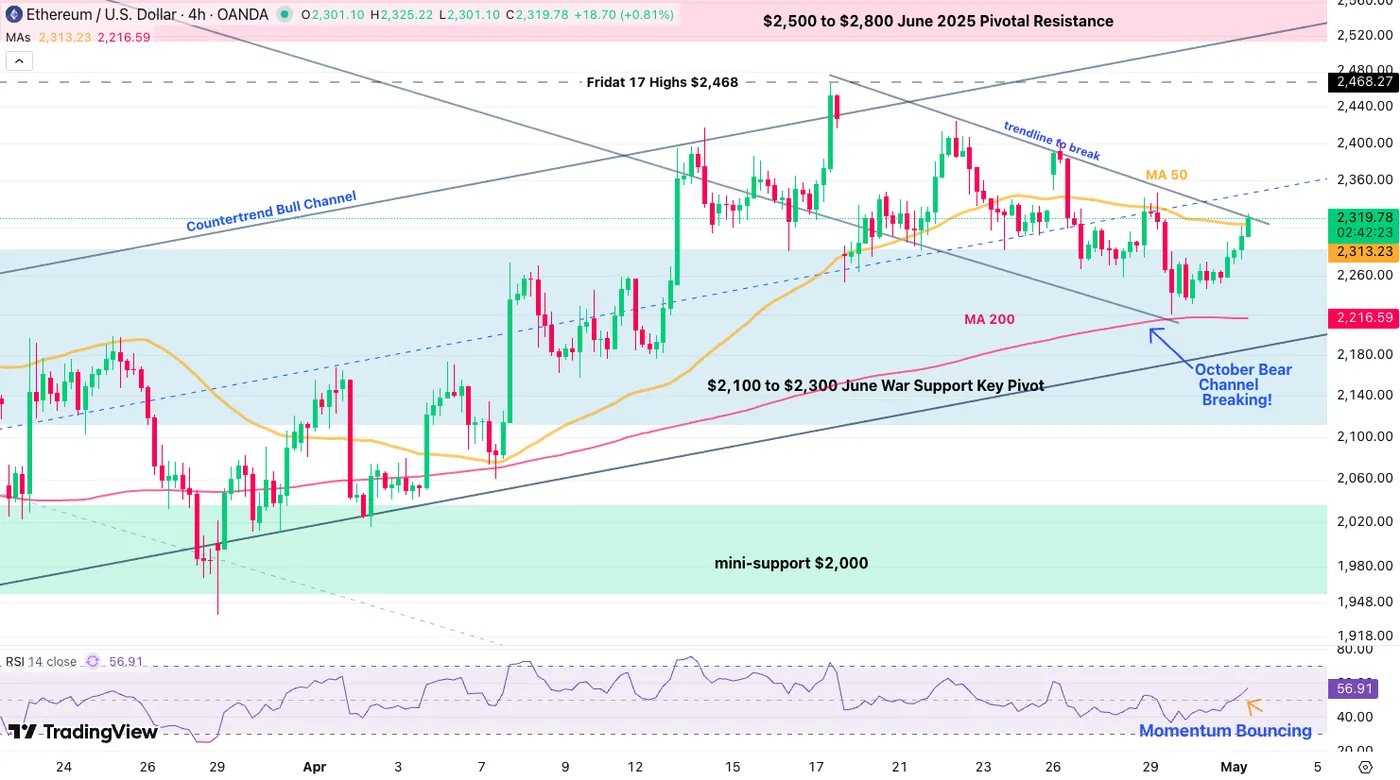
Ethereum 4H Chart, May 1, 2026 – Source: TradingView
Ethereum is forming an intraday tight bull channel after finding its bottom at the FOMC, right around the 4H 200-period MA.
Currently testing a break of a short-term top-line, bulls are already pushing above the 50-period MA and that provides the needed signs for continued upside.
To confirm, look for an hourly close above $2,330 which would hint to a rally to the top of the counter-trend bull channel ($2,520).
Levels of interest for ETH trading:
Support Levels:
- $2,100 to $2,300 June War Support Key Pivot
- $2,215 4H 200-period MA
- Channel lows $2,000
- $1,700 to $1,800 Pre-Bounce 2025 Key Support (testing)
- $1,744 February 6 lows
Resistance Levels:
- Trendline top $2,330
- $2,400 mini-resistance
- $2,500 to $2,700 June 2025 Key Support now Resistance (Channel Highs)
- $3,000 to $3,200 Major momentum Pivot (Test of the $3,000)
- $4,950 Current new All-time highs
Ethereum 1H Chart
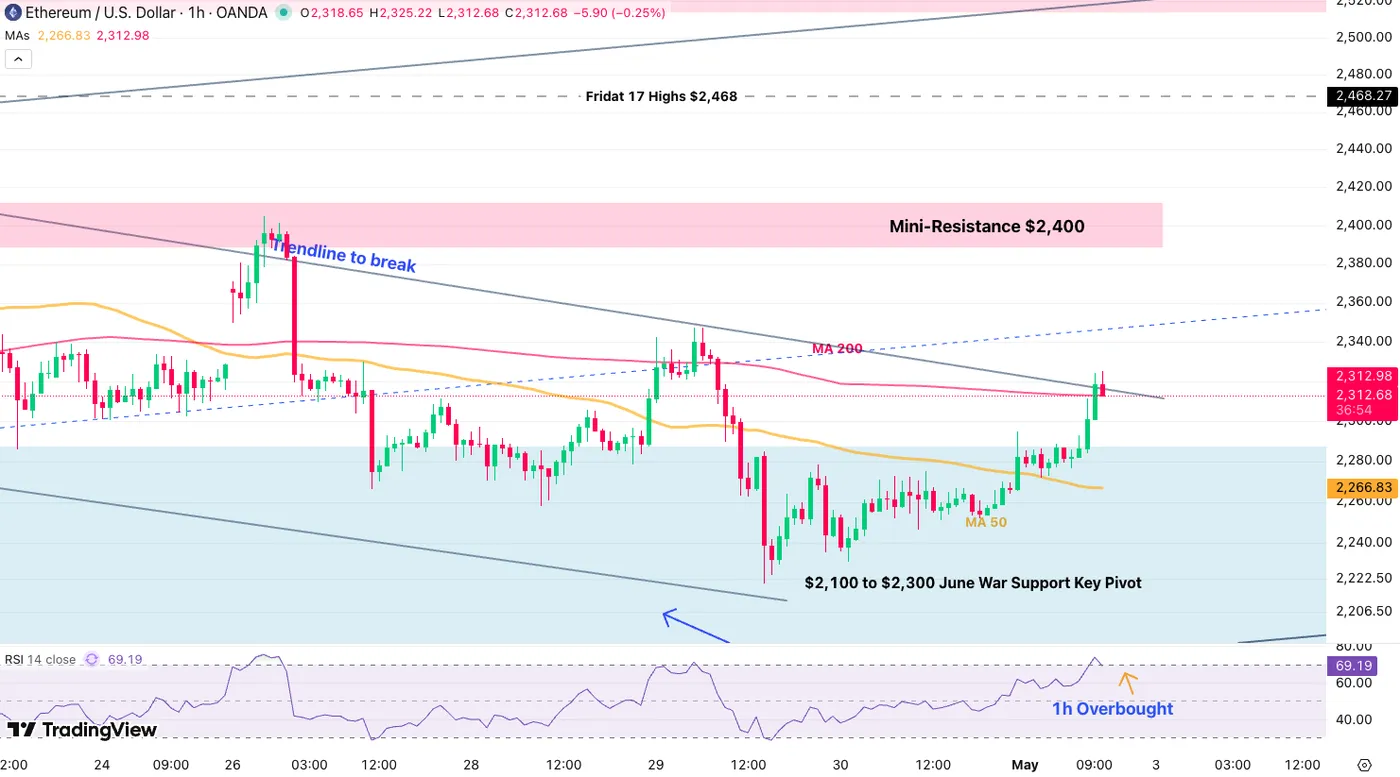
Ethereum 1H Chart, May 1, 2026 – Source: TradingView
The shorter timeframe points to momentum slightly exhausting with a short-term double top and overbought RSI, but with this price action, the pull back should not extend much beyond $2,300.
Breaking the 50-Hour MA ($2,266) cancels out the bull attempt in would imply further consolidation in times ahead.
Safe Trades!


