
In recent days, forex markets have seen a strong increase in activity, moving away from their earlier steady trends.
The confirmation of Kevin Warsh as the next Federal Reserve Chair added volatility, but today’s trading is mainly driven by a sharp drop in the US Dollar.
Before the recent moves in the US Dollar, antipodean currencies like the New Zealand Dollar and especially the Australian Dollar were already among the top performers, thanks to optimism around the Iran peace talks.
Today, that positive trend gained further support after President Trump announced that a diplomatic deal between the US and Iran is close to completion, easing geopolitical concerns.
This breakthrough is easing pressure on global energy supply chains and causing oil prices to fall.
As a result, the US Dollar is weakening because the risk of war-driven inflation is fading. Lower energy costs are especially good news for oil-importing countries in the Asia-Pacific, which helps explain why the Australian Dollar is leading today’s forex gains.
The AUD/USD pair is also benefiting from renewed global risk appetite.
Looking ahead, the focus is rapidly shifting to the critical Australian jobs report scheduled for later this evening.
The market expects 17.5K new jobs, a slight slowdown from last month’s 17.9K.
Overall, this slower growth is what the Reserve Bank of Australia wants after raising rates twice to cool the economy in recent meetings.
A gradual slowdown in the labor market gives the RBA more flexibility, but a miss could easily see a fast-paced correction in the pair’s prior bounce.
The upcoming employment data will show if the Australian Dollar’s recent strength can continue.
AUD/USD Multi-Timeframe Analysis
Daily Chart
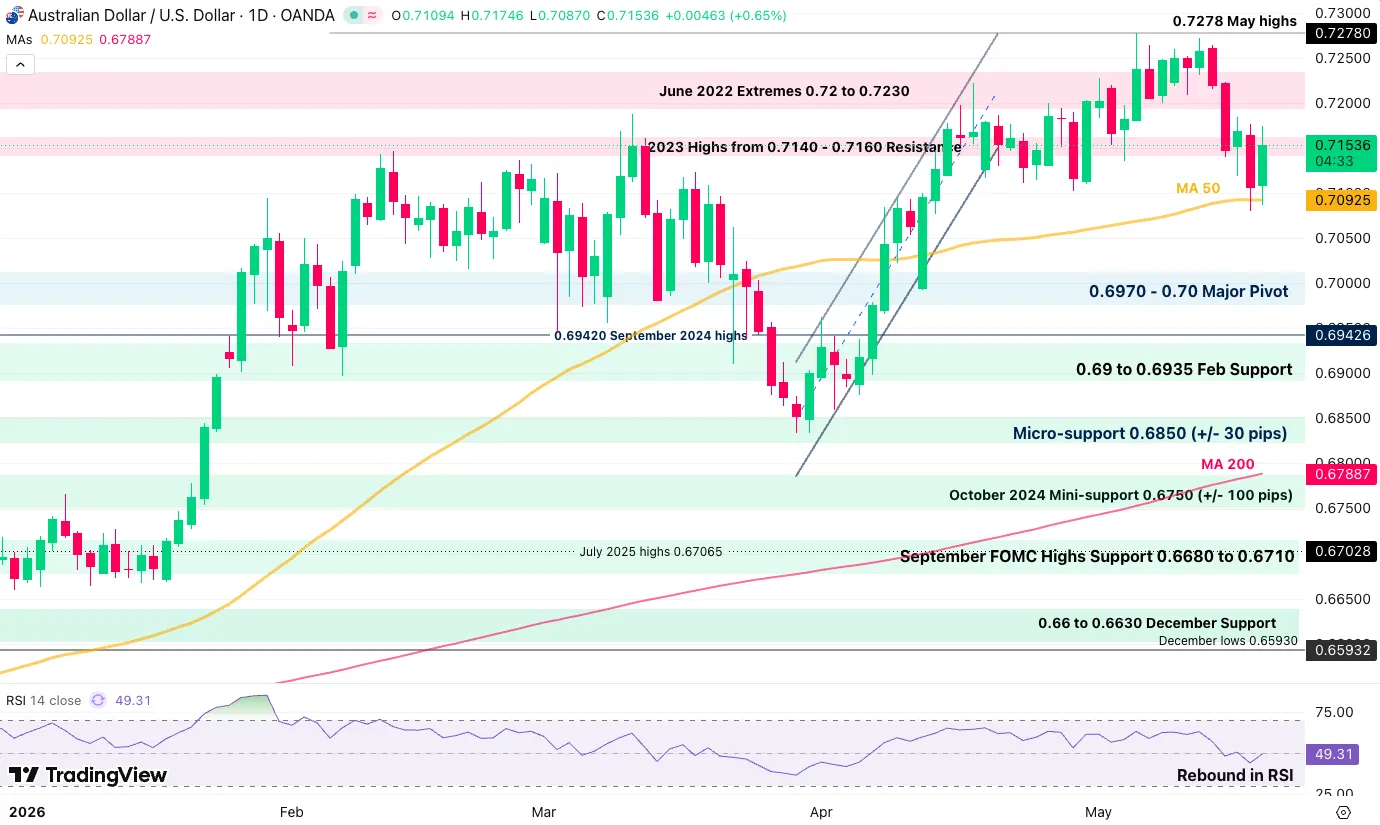
AUD/USD daily chart. Source: TradingView, May 20, 2026.
AUD/USD is rebounding quite strongly on its 50-day moving average, rebounding above 600 pips since.
The current daily candle still was not strong enough to extend beyond the previous one and form a bullish engulfing pattern. Hence, this shows some relative hesitancy from market participants.
Today’s candle, however, offers great breakout levels:
- Any push on high volume and momentum above previous highs, 0.7175, should see continuation above 0.72.
- On the contrary, a push below the daily lows, 0.7090, and the 50-day MA could extend back towards 0.70.
4H Chart
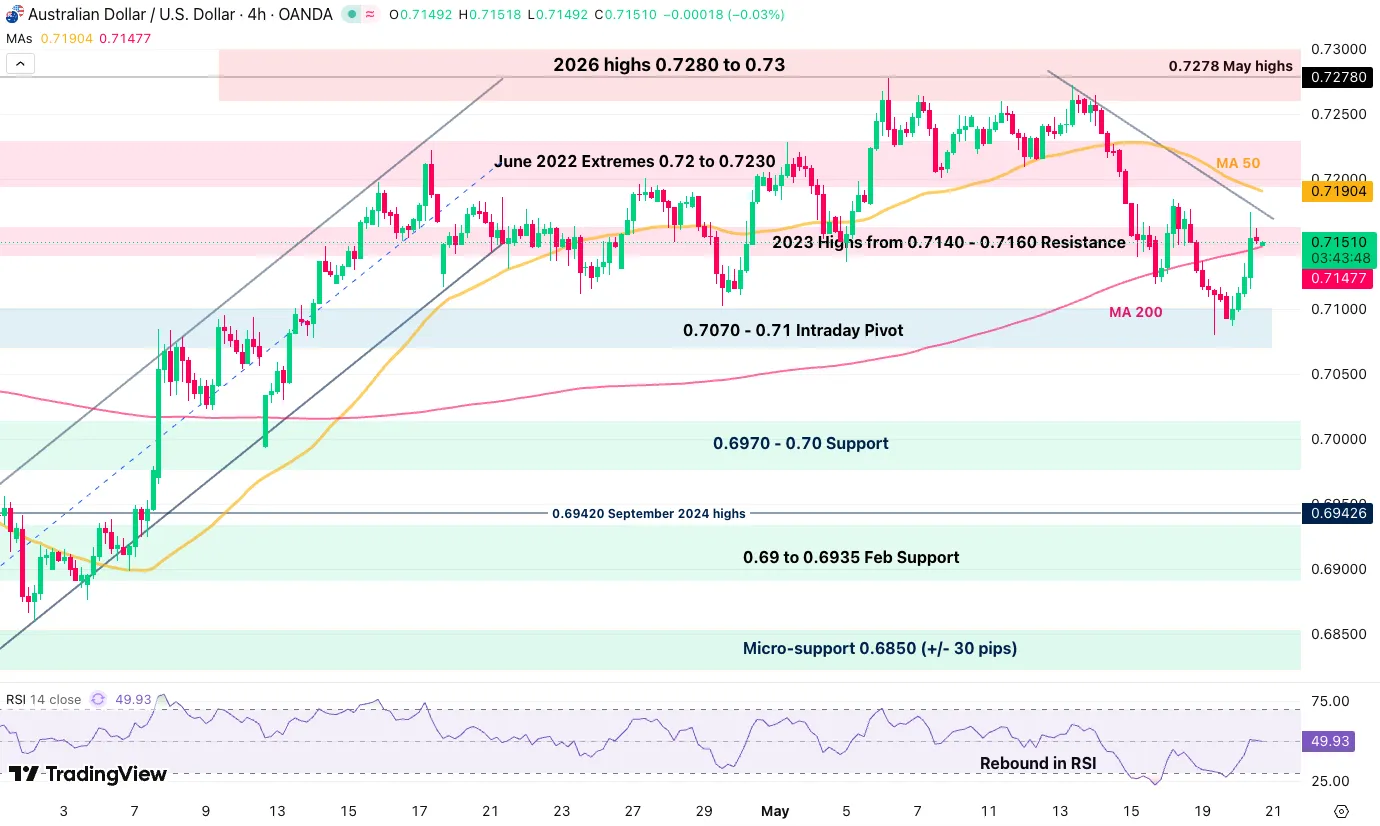
AUD/USD 4H chart. Source: TradingView, May 20, 2026.
Momentum is slowing down hard ahead of the key data release during the overnight session, with the action consolidating at the 4H 200-period MA, 0.71480.
Intraday buyers will want to see a break above today’s highs, while sellers will want to see a clear push below the 200-MA.
Levels of interest for AUD/USD:
Resistance Levels
- 0.7175 daily highs
- 2023 highs from 0.7140 to 0.7160 resistance
- June 2022 extremes: 0.72 to 0.7230
- 2026 highs: 0.7280 to 0.73
- 0.7278 May and 2026 highs
Support Levels
- Daily lows: 0.7090
- 0.7070 to 0.71 intraday pivot
- 0.6970 to 0.70 support
- 0.69 to 0.6935 early February support
- 0.68340 war lows
1H Chart
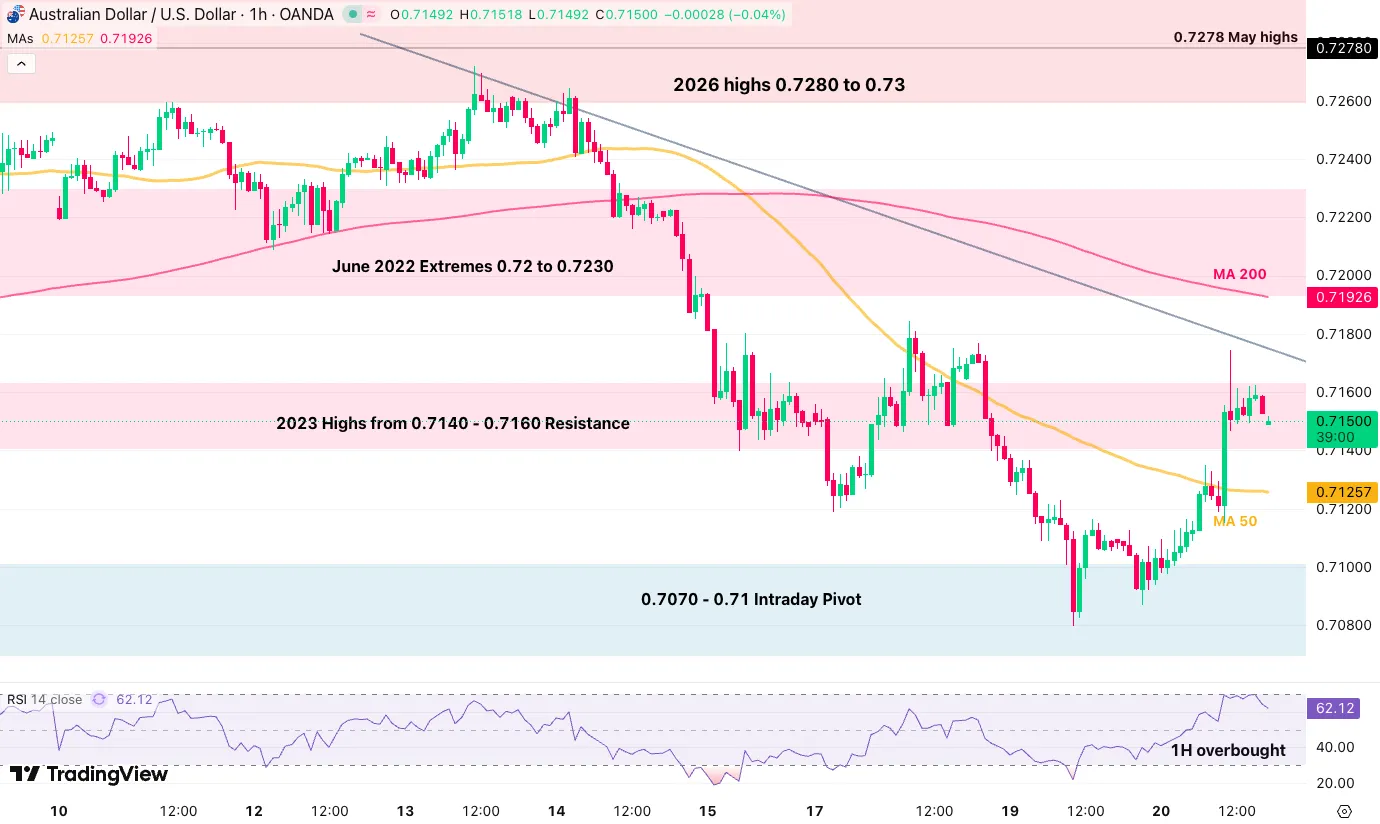
AUD/USD 1H chart. Source: TradingView, May 20, 2026.
The Aussie is pulling back from short-timeframe overbought conditions, with the action likely to stay put ahead of the data.
Watch for a potential test of the 50-hour MA ahead of the data releasing overnight.
Safe trades.


