
Over the past few weeks, financial markets have been more focused than ever on developments surrounding the Strait of Hormuz — a critical waterway at the centre of ongoing US-Iran negotiations. The back-and-forth of diplomatic headlines has injected significant volatility into energy markets, causing no shortage of headaches for traders and investors alike. For now, the price appears to have found a temporary equilibrium around the key $70 per barrel level, returning to territory last seen before the outbreak of the conflict. The question, then, arises naturally: has the period of uncertainty and volatility finally come to an end, or is this merely a pause before the next move?
Technical Analysis of Brent Crude Oil
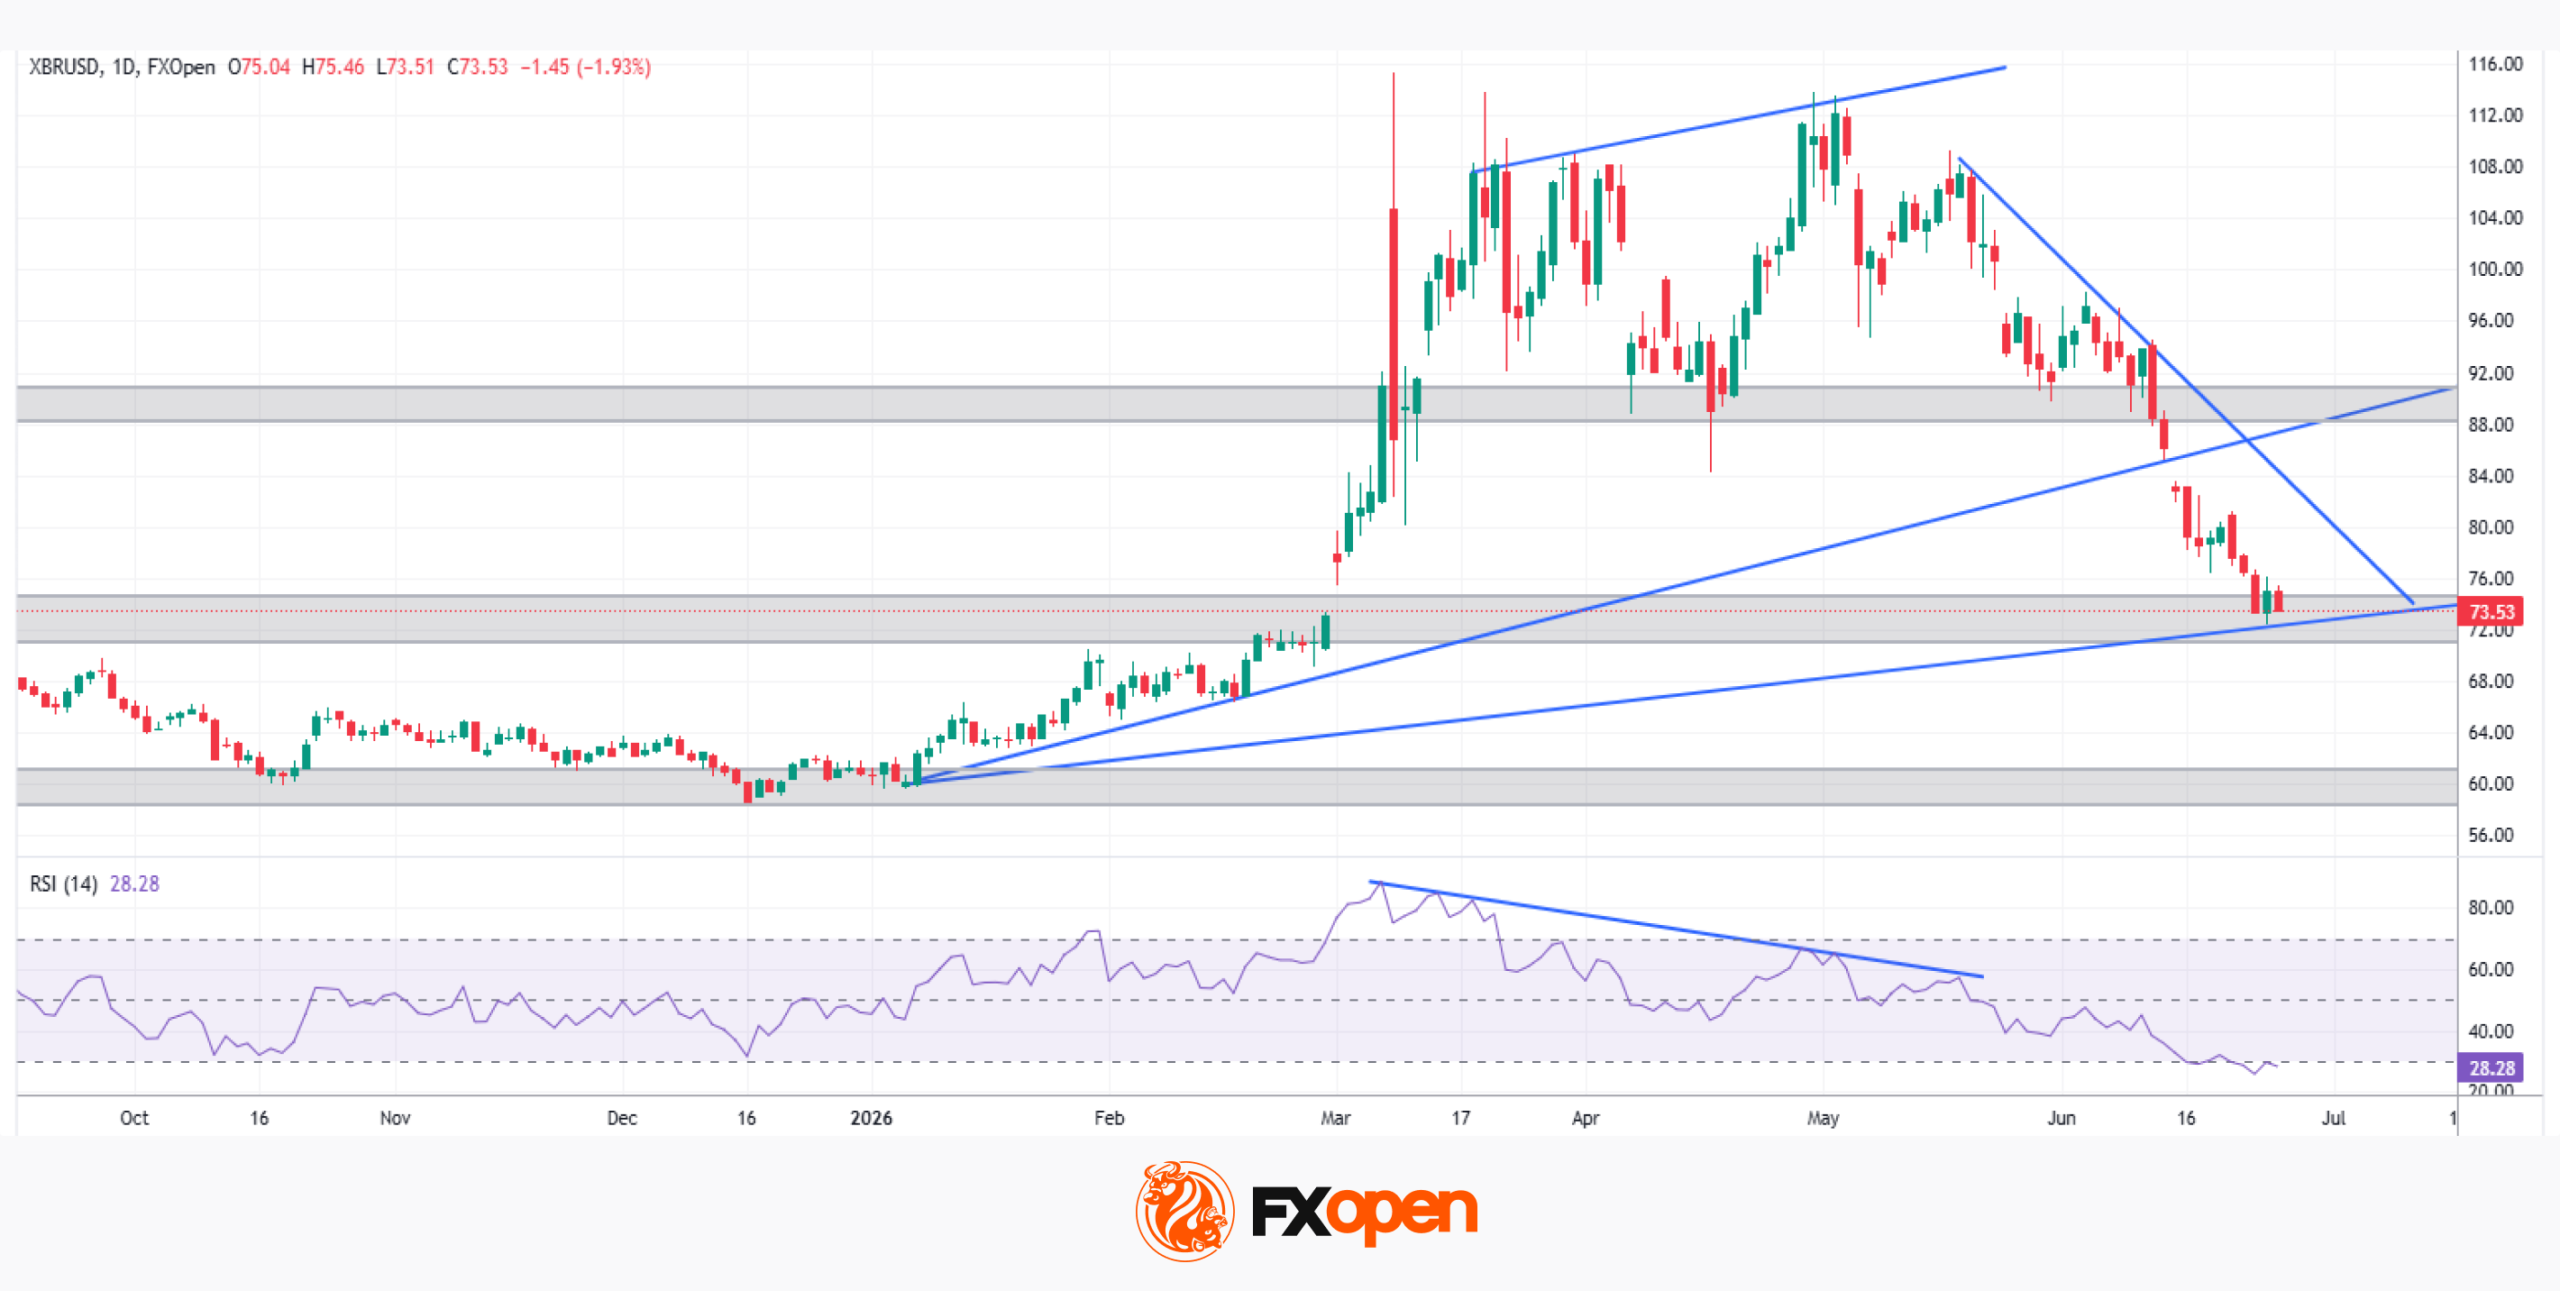
From a technical standpoint, Brent crude oil has been in a clear bearish trend for approximately one month, consistently forming lower highs and lower lows on the daily chart. Early warning signs were already visible in a notably strong RSI divergence: while price recorded higher highs between March and May on the candlestick chart, the RSI readings in May were significantly weaker than those of March — a textbook signal that bullish momentum was gradually exhausting itself.
The decisive blow came with the breakdown of the $88–$90 per barrel support zone, followed shortly after by the breach of the ascending trendline drawn from the lows at the start of the year. Price has since moved to the technically and psychologically crucial zone around $70 per barrel, where it appears to be pausing before committing to a clear direction.
→ Bearish scenario: A break below the short-term trendline formed during Thursday’s session (25 June), combined with a confirmed close beneath $70, could open the path toward the $60 per barrel area — a scenario consistent with a progressively calmer geopolitical backdrop and a lasting US-Iran peace agreement.
→ Bullish scenario: For buyers to regain control, price would need to reclaim the current week’s highs around $81, confirming a clear bounce from the support zone around $70. This would set the stage for a potential retest of the former support — now acting as resistance — in the $88 zone, a level that could prove decisive for the asset’s medium-term direction. Here too, geopolitical developments remain the key wildcard.
Will crude oil find its equilibrium, or does further turbulence lie ahead for investors and traders?
Start trading commodity CFDs with tight spreads (additional fees may apply). Open your trading account now or learn more about trading commodity CFDs with FXOpen.
This article represents the opinion of the Companies operating under the FXOpen brand only. It is not to be construed as an offer, solicitation, or recommendation with respect to products and services provided by the Companies operating under the FXOpen brand, nor is it to be considered financial advice.


