
Key Highlights
- WTI Crude Oil extended losses and traded below $70.
- A key declining channel is forming with resistance at $70.85 on the 4-hour chart of XTI/USD.
- Gold could attempt a recovery if it surpasses the $4,200 resistance.
- USD/JPY extended gains above 162.50 before there was a minor pullback.
WTI Crude Oil Price Technical Analysis
WTI Crude Oil prices remained under pressure below $75 against the US Dollar. The price dipped below $72.50 to enter further into a bearish zone.
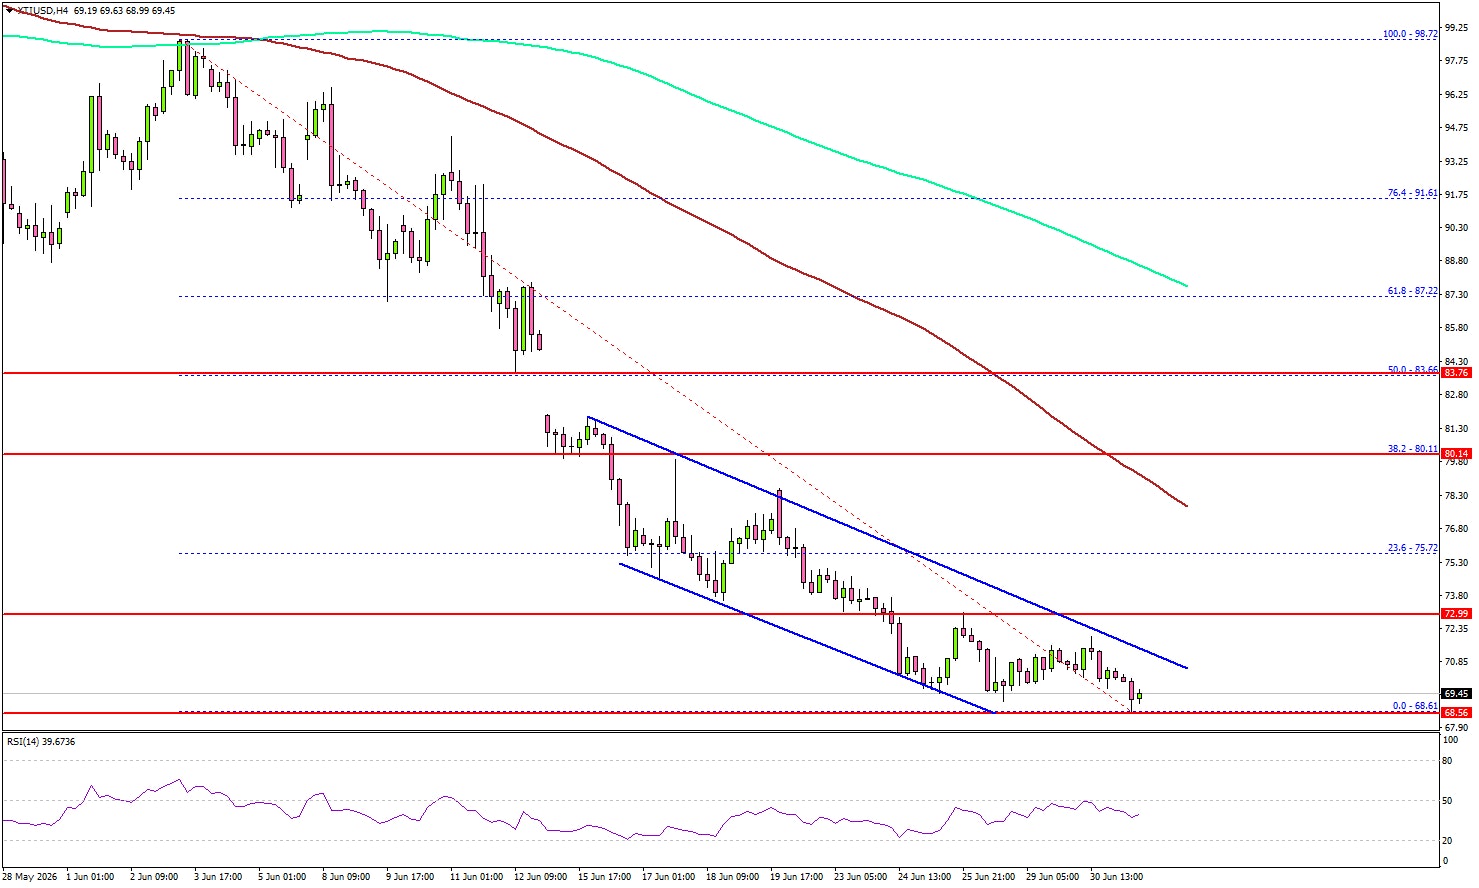
Looking at the 4-hour chart of XTI/USD, the price even declined below $70. It settled well below $72, the 100 simple moving average (red, 4-hour), and the 200 simple moving average (green, 4-hour). Besides, there is a key declining channel forming with resistance at $70.85.
If there is a recovery wave, the price could face resistance near the same channel. The next resistance might be $73.00. The first key hurdle for the bulls could be near the 23.6% Fib retracement level of the downward move from the $98.72 swing high to the $68.61 low at $75.72.
The main resistance may perhaps be near the 100 simple moving average (red, 4-hour) and $78.50. A close above $78.50 might send Oil prices toward $80. Any more gains might call for a test of $85 in the near term.
On the downside, the first major support could be near the $68.50 zone. The next support might be $66.50, below which the price could dive and test $65. A daily close below $65 could open the doors for a larger decline. In the stated case, the bears might aim for a drop toward $60.
Looking at Gold, the price might attempt a recovery wave, but it must settle above $4,200 to continue higher.
Economic Releases to Watch Today
- US nonfarm payrolls for June 2026 – Forecast 110K, versus 172K previous.
- US Unemployment Rate for June 2026 – Forecast 4.3%, versus 4.3% previous.
- US Initial Jobless Claims – Forecast 220K, versus 215K previous.


