Hello , fellow traders. In this technical update, we’ll revisit our recent Elliott Wave analysis for BTCUSD, published in the members’ area of the website.
In our previous BTC article, we explained that Bitcoin was going through a short-term correction after a strong rally from the August 1 low. We highlighted 76,235 as the key short-term level and outlined two possible bullish scenarios. The first scenario allowed for another push lower before the rally resumed. However, we also noted that if BTCUSD continued to hold above 76,235 and broke above the connector, the correction could already be complete and the next bullish leg could begin.
That more bullish scenario played out, with Bitcoin holding the key low and turning sharply higher.
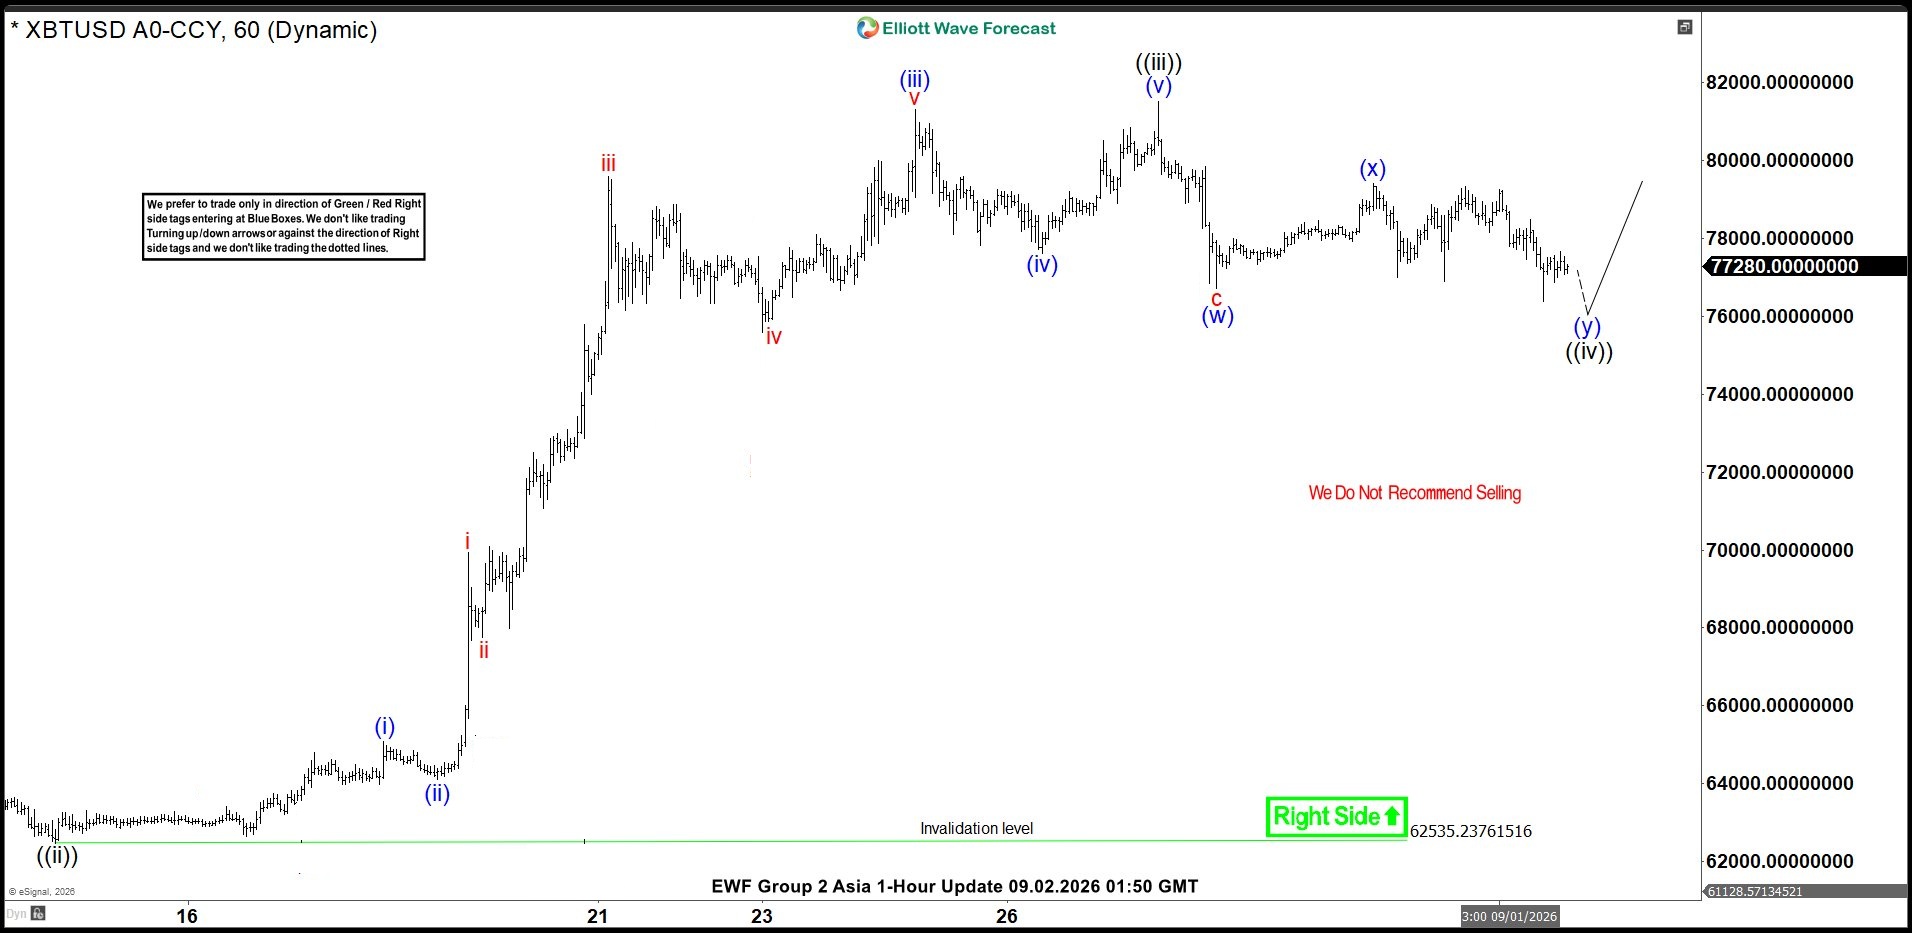
BTCUSD Elliott Wave 1 Hour Chart 09.02.2026
BTCUSD is forming a Double Three pattern labeled (w)-(x)-(y). The decline found support near the 0.764 Fibonacci extension around 76,602. We expect rally to takes place soon.
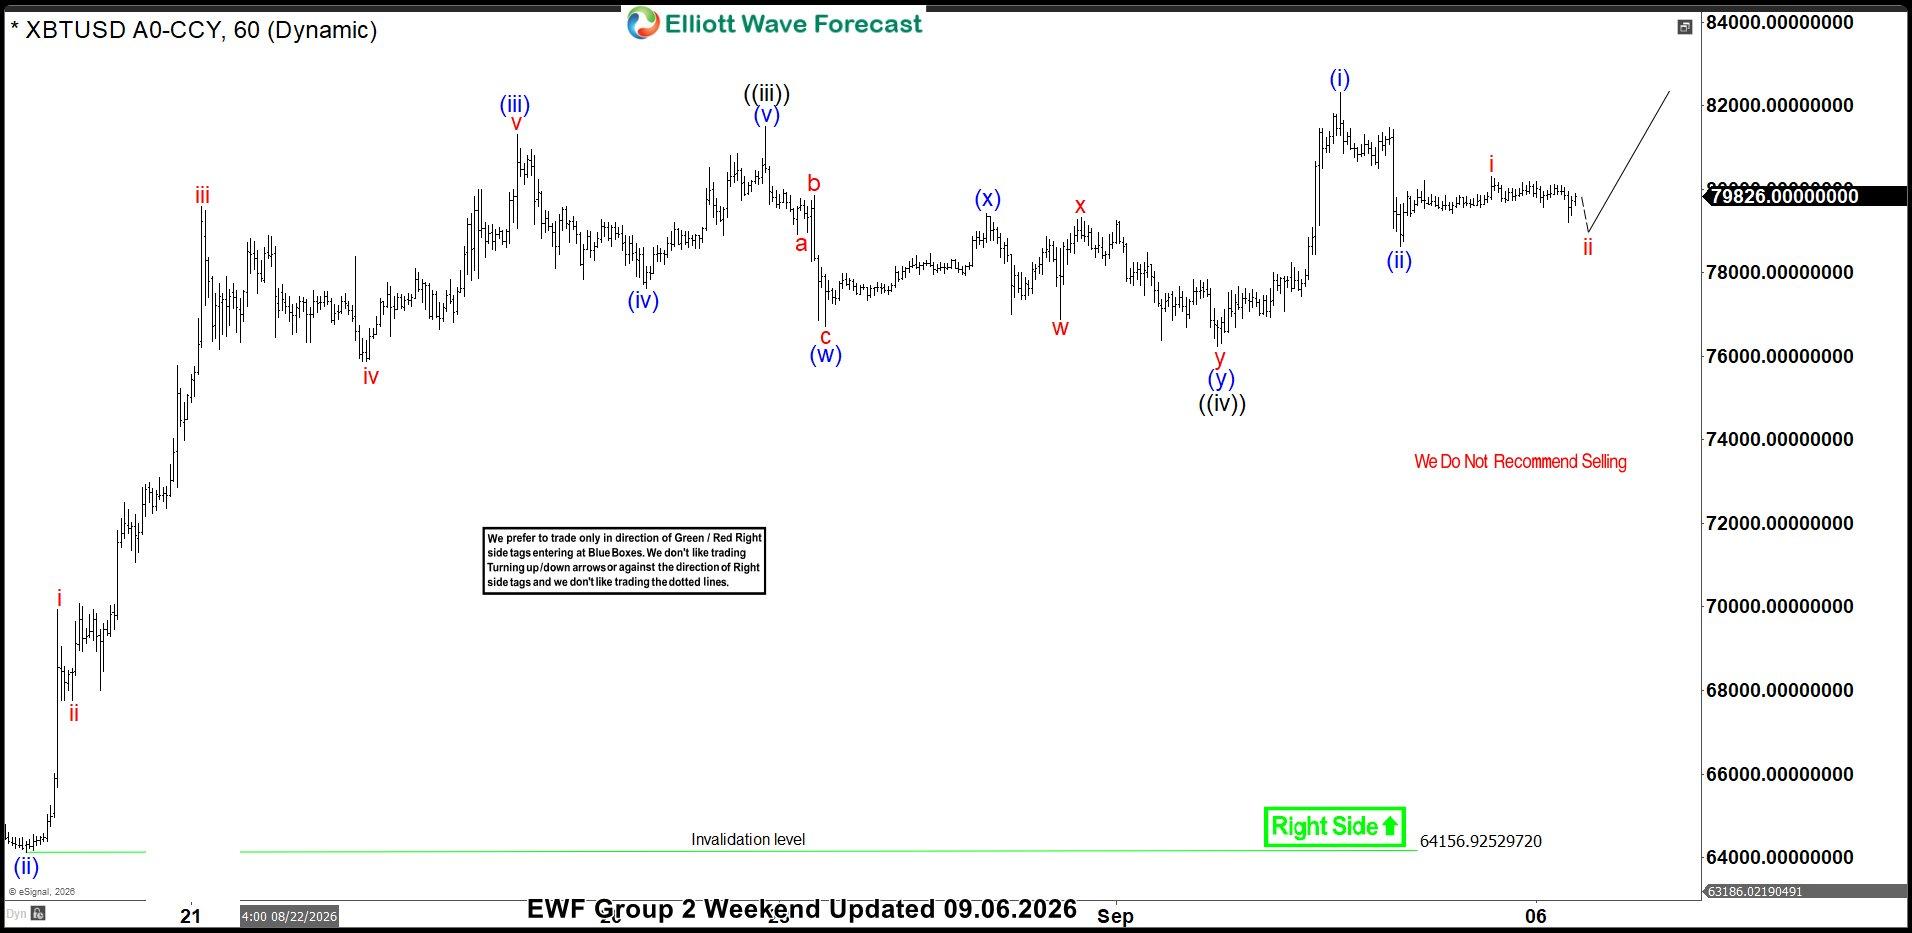
BTCUSD Elliott Wave 1 Hour Chart 09.06.2026
Bitcoin respected the key support and turned sharply higher. Wave ((iv)) completed at the 76,235 low, followed by a strong rally toward new highs. The current view suggests that as long as the pivot at the 76,235 low remains intact, BTCUSD can continue higher and extend the bullish sequence.
Financial markets are dynamic, and the outlook can change as new price action develops. This is why not every Elliott Wave chart represents a trading recommendation.
When the market structure, timing, and risk parameters meet our criteria, we provide clearly defined Trading Setups in the Live Trading Room, including Entry, Stop Loss, and Take Profit levels.
Members also receive regular updates as market conditions change, helping them follow the key levels and the most likely scenarios in real time.