


Key Highlights
- Bitcoin failed to stay above $80,000 and started another pullback.
- A few key hurdles seem to be forming near $81,400 and $82,250 on the 4-hour chart of BTC/USD.
- Ethereum also failed on multiple occasions near $2,550.
- Gold could face heavy resistance near $4,480 and $4,500.
Bitcoin Price Technical Analysis
Bitcoin price made another attempt to settle above $80,000 against the US Dollar but failed. BTC traded to a new multi-week high at $82,266 before it faced rejection.
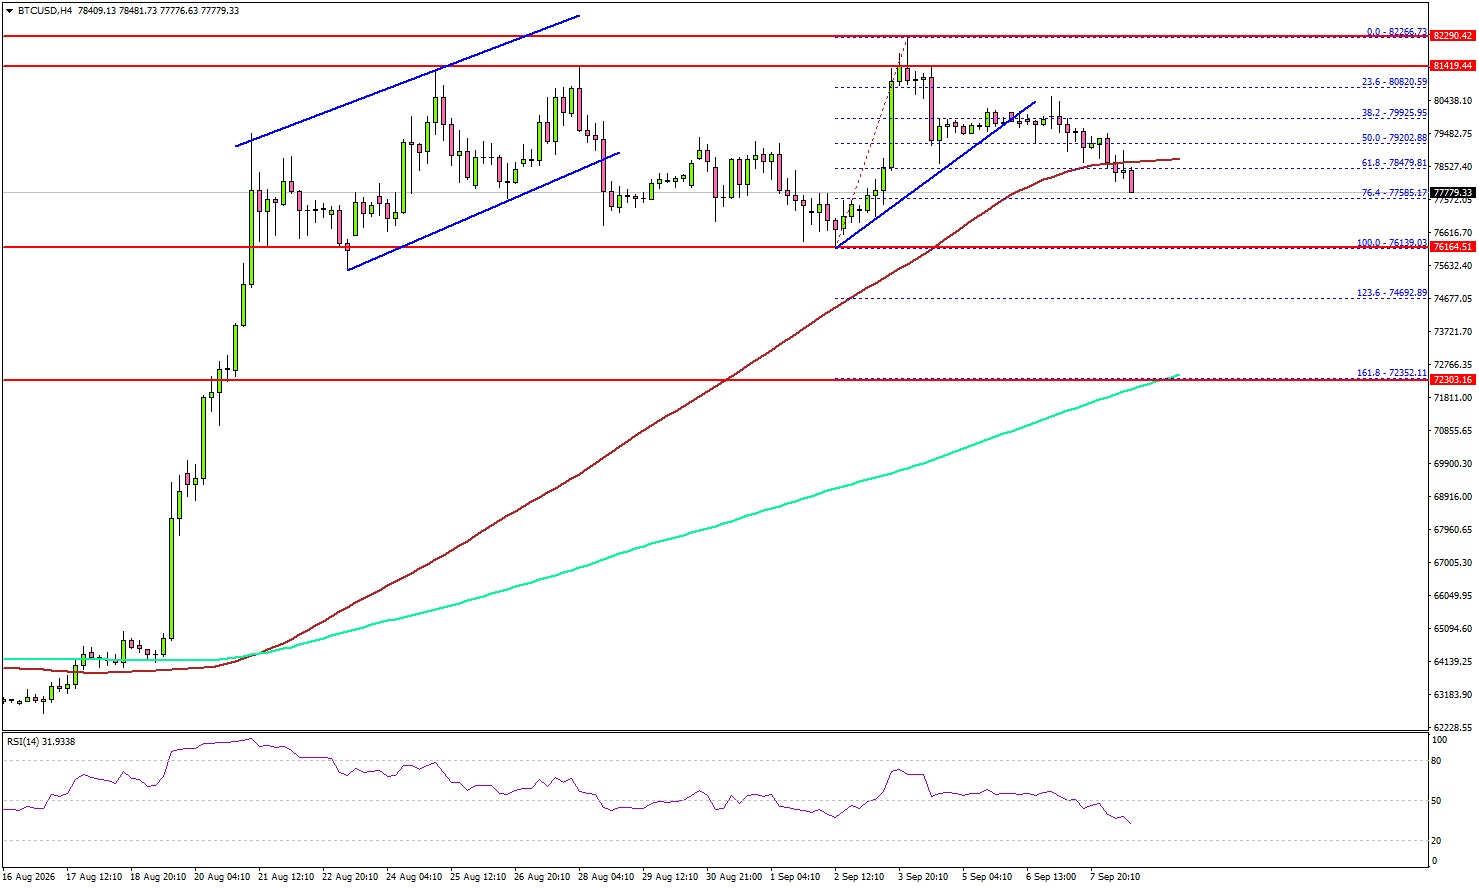
Looking at the 4-hour chart, the price started another pullback below $81,400 and $81,000. The price dipped below a bullish trend line with support at $79,250. The bears were able to push BTC below the 50% Fib retracement level of the upward move from the $76,139 swing low to the $82,266 high, and the 100 simple moving average (red, 4-hour).
If there are more losses, the price could revisit $76,200. The first major support might be $72,500, the 200 simple moving average (green, 4-hour), and the 1.618 Fib extension level of the upward move from the $76,139 swing low to the $82,266 high.
A downside break and close below $72,500 could trigger a sharp decline. In the stated scenario, the price could test $70,000. On the upside, an immediate resistance could be $79,950. The first major resistance might be $80,000. The main resistance might be $81,400. A close above $81,400 could send the price toward $82,250. Any further gain might call for a test of $85,000.
Looking at Ethereum, the price is also struggling to settle above $2,550 and might see a downside correction in the near term.
Today’s Key Economic Releases
- ECB President Lagarde’s speech.





