


Key Highlights
- GBP/USD declined toward 1.3200 before the bulls emerged.
- A bearish trend line is forming with resistance at 1.3290 on the 4-hour chart.
- Gold prices weakened and traded below $4,200.
- WTI Crude Oil started a consolidation phase below $100.00.
GBP/USD Technical Analysis
The British Pound gained bearish momentum below 1.3250 against the US Dollar. GBP/USD even tested the 1.3200 zone before it found some support.
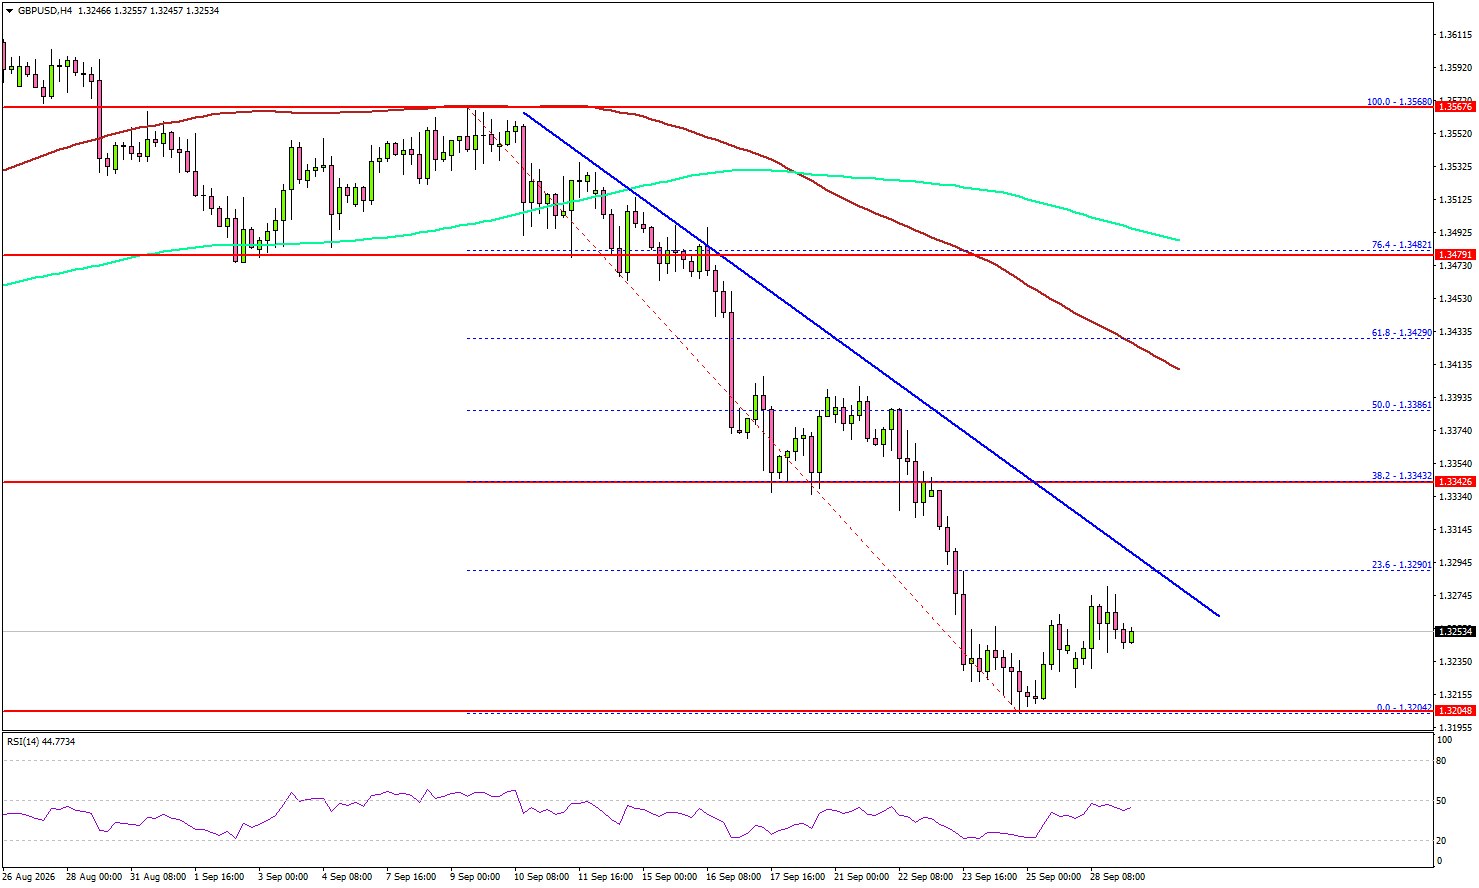
Looking at the 4-hour chart, the pair settled below 1.3300, the 100 simple moving average (red, 4-hour), and the 200 simple moving average (green, 4-hour). A low was formed at 1.3204, and the pair started a consolidation phase.
If there is a recovery wave, the pair could face resistance near the 1.3280 level. There is also a bearish trend line forming with resistance at 1.3290. The trend line is close to the 23.6% Fib retracement level of the downward move from the 1.3568 swing high to the 1.3204 low.
A close above the 1.3290 resistance could start a decent recovery wave. The next major hurdle might be 1.3345. The main resistance could be 1.3420 and the 100 simple moving average (red, 4-hour).
A close above 1.3420 could start another steady increase. In the stated case, the bulls could aim for a move to 1.3480. If there is no recovery wave above 1.3290, the pair could start a fresh decline. An initial support sits at 1.3220.
The first major support might be 1.3200. A close below 1.3200 might accelerate the decline. In the stated case, the bears could aim for a move to 1.3150.
Looking at Gold, the bears gained strength, pushed the price below $4,200, and might aim for further downside.
Upcoming Key Economic Events:
- US Housing Price Index for July 2026 (MoM) – Forecast +0.1%, versus 0% previous.
- S&P/Case-Shiller Home Price Indices for July 2026 (YoY) – Forecast +2.2%, versus +2.1% previous.





