


Hello fellow traders. In this technical article, we’ll look at the Bitcoin (BTCUSD) Elliott Wave charts published in our members’ area.
As our members know, we are calling the cycle from the September 21 peak complete, opening the door for a potential reversal. We’ll highlight the key levels that need to hold to maintain this view and present potential target areas to watch. Let’s break down the Elliott Wave structure and explore the latest outlook for BTCUSD.
For those who are not familiar with the most common Elliott Wave structures, we recommend checking out our Free Educational Page to learn more.
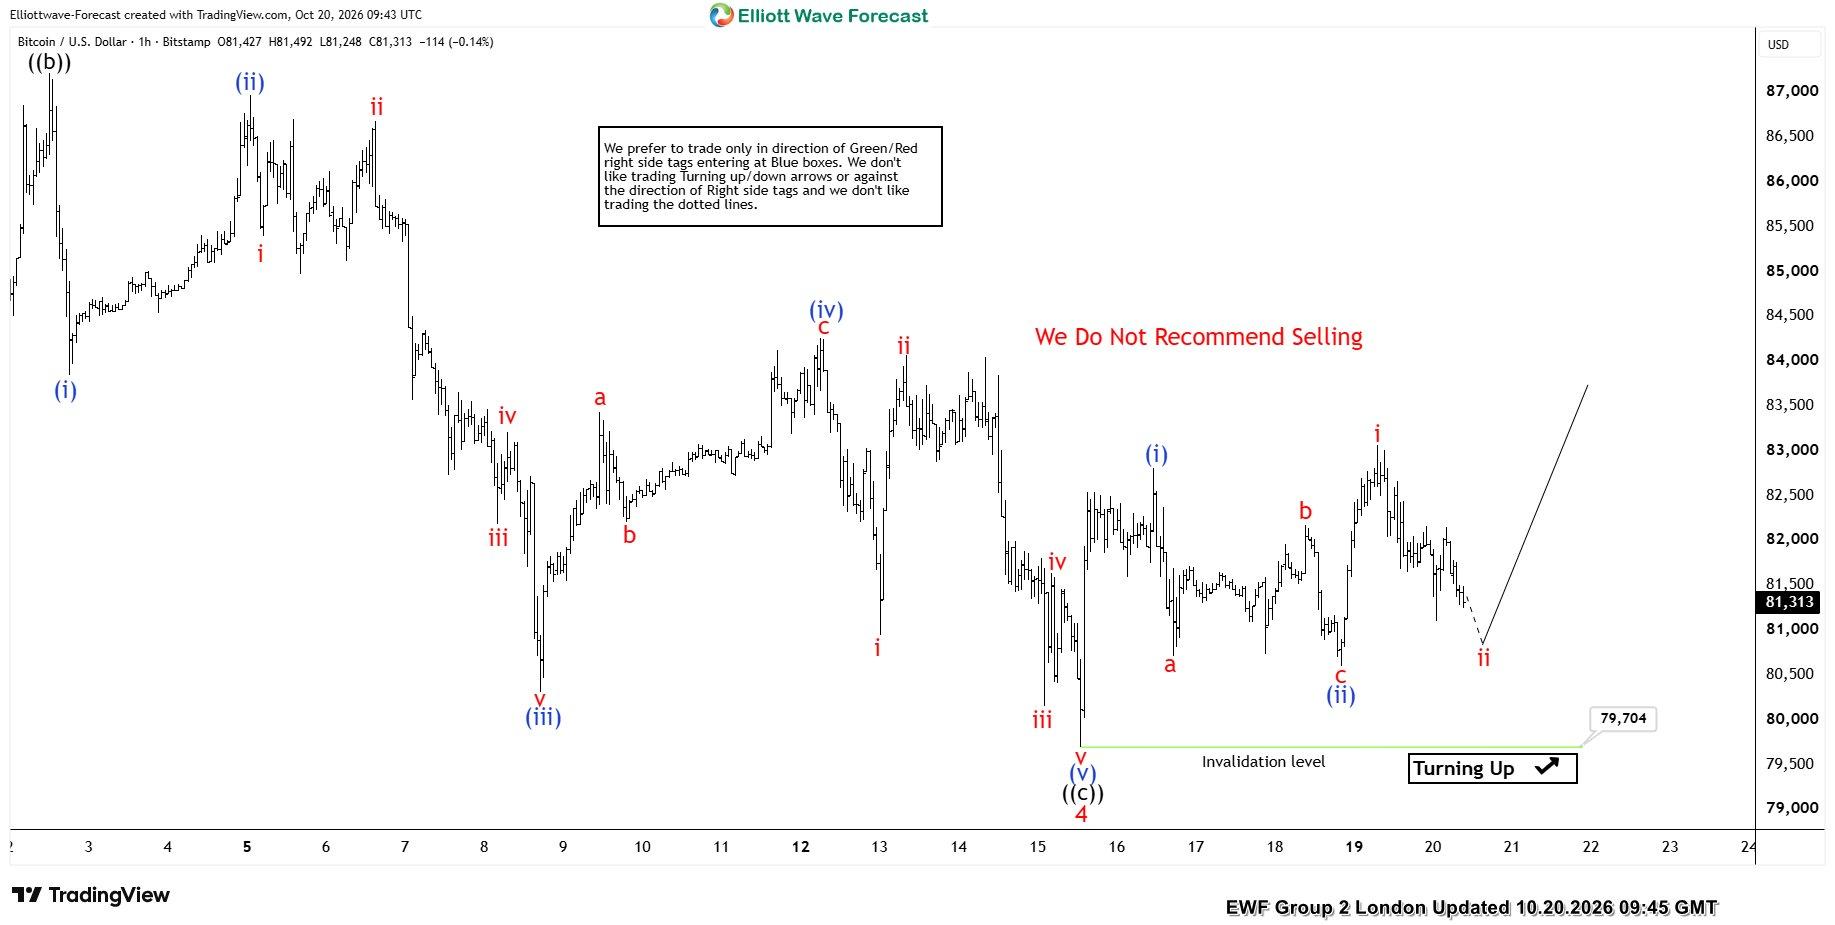
BTCUSD Elliott Wave 1 Hour Chart 10.20.2026
We called for the correction to potentially complete at the 79,704 low. However, the bounce from this level remains shallow, and we would like to see further separation from the low to strengthen the proposed view. So far, price has established a higher-high structure from the latest low at 79,704. We expected red wave ii to complete above the blue wave (ii) low and then resume moving higher, creating further separation from the low.
Official trading strategy on How to trade 3, 7, or 11 swing and equal leg is explained in details in Educational Video, available for members viewing inside the membership area.
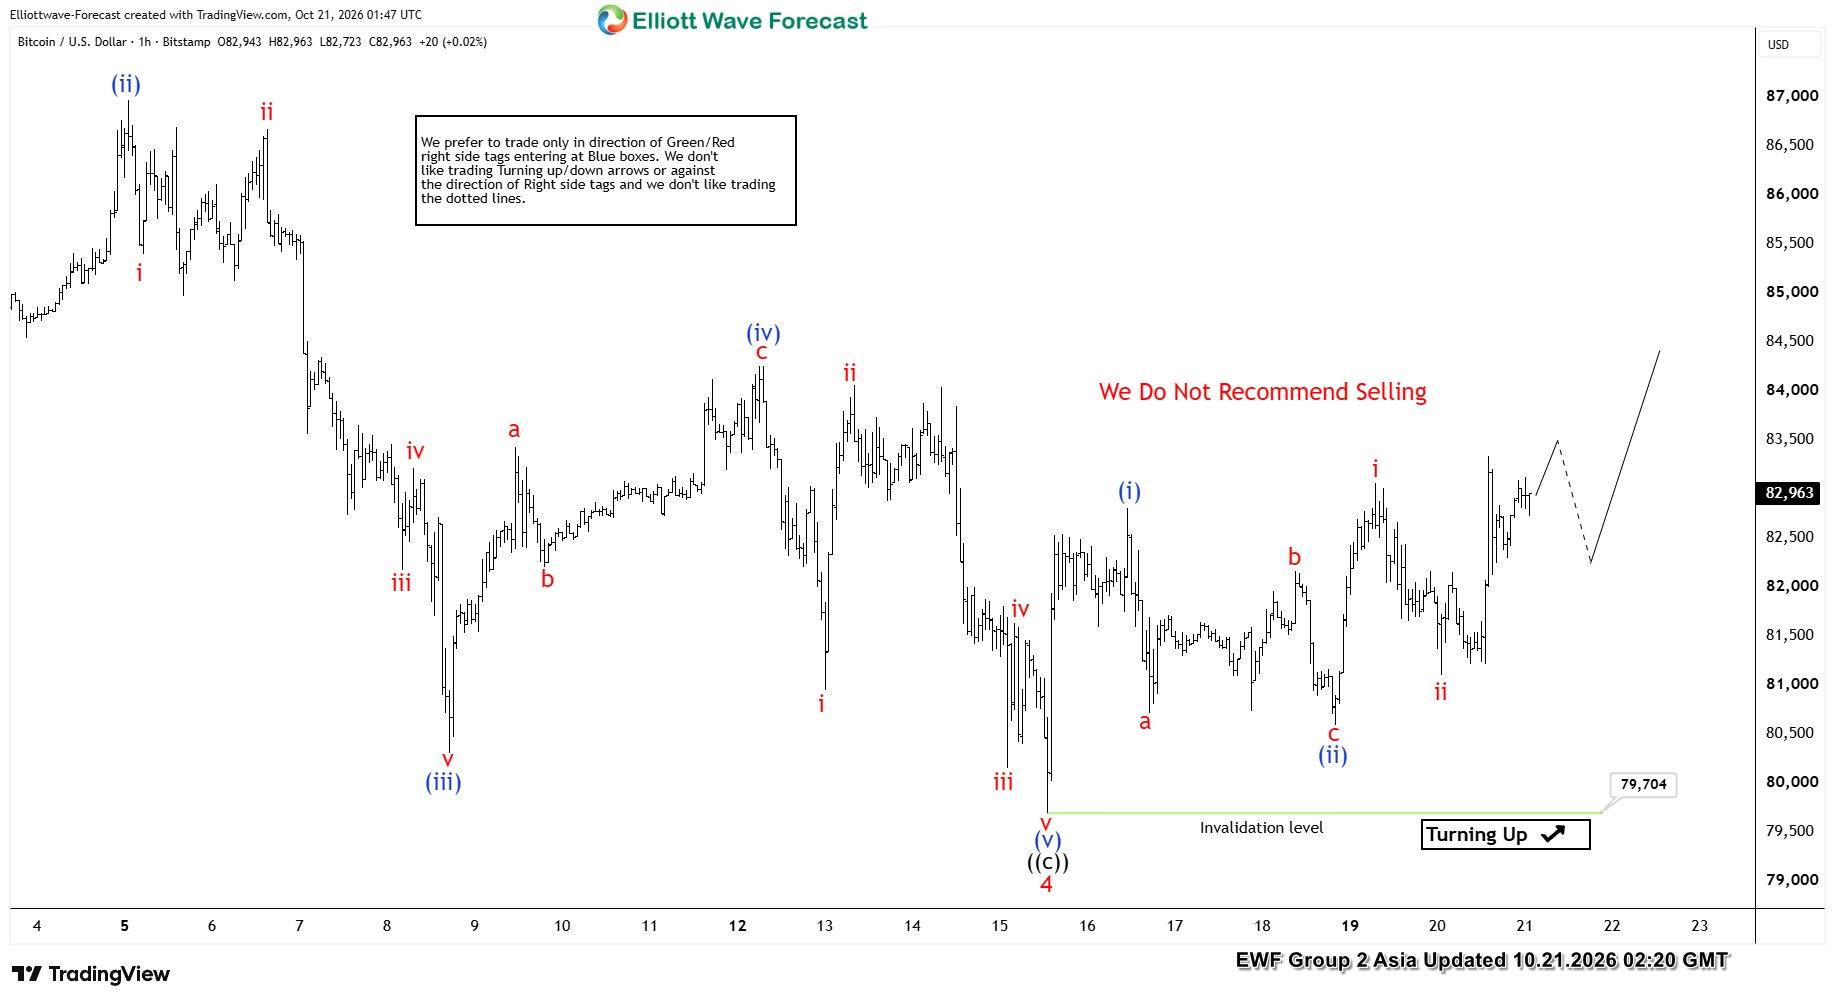
BTCUSD Elliott Wave 1 Hour Chart 10.21.2026
We have seen another break higher, which is a positive sign for the bulls. The current count suggests BTCUSD could be in red wave iii of blue wave (iii), potentially leading to further upside.
As our members know, we use the 50% Fibonacci retracement of the connector as confirmation that the cycle has completed. In this case, we are measuring the 50% Fibonacci level against the October 2 peak at 87,186, which gives us 83,458 as the key level to watch. A break above this level would provide further confirmation that the cycle has ended and strengthen the bullish outlook, with BTCUSD potentially targeting the 89,124 area next.
Alternatively, if price continues moving sideways without a significant break higher, the probability of the proposed view will decrease, leaving the 79,704 low more vulnerable to a break. If BTCUSD breaks below the 79,704 pivot, the alternative scenario will take precedence, suggesting a deeper H4 correction is underway.
Keep in mind that market is dynamic and presented view could have changed in the mean time. You can check most recent charts with target levels in the membership area of the site. Best instruments to trade are those having incomplete bullish or bearish swings sequences. We put them in Sequence Report and best among them are shown in the Live Trading Room





 Elliott Wave charts published in our members’ area.)