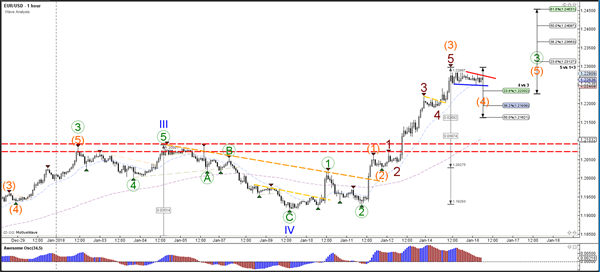
Currency pair EUR/USD
The EUR/USD bullish breakout within the uptrend is now building a sideways retracement. The consolidation zone is most likely just a correction before the bullish trend continues towards the Fibonacci targets of wave 5 (blue).
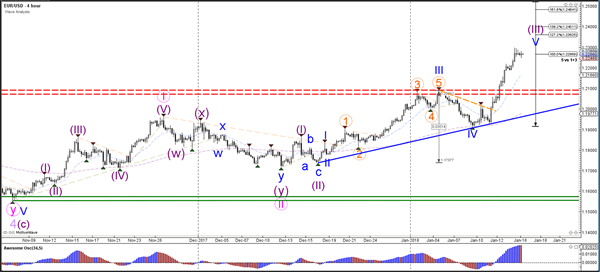
The EUR/USD bullish impulsive price action is best explained by the development of a wave 3 (orange). The shallow correctionis probably a wave 4 (orange) which could either retrace to the Fib levels or break above the resistance (red).
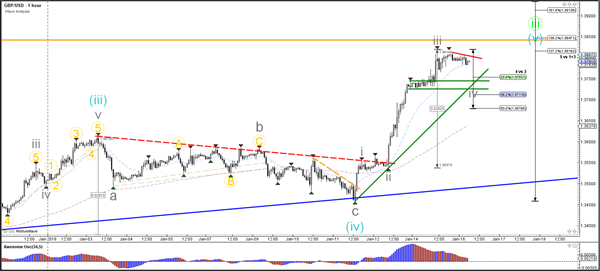
Currency pair GBP/USD
The GBP/USDis showing a strong bullish rally after the breakout. Price is now approaching a key resistance zone which is indicated by the resistance trend line (orange). The orange horizontal line is the bottom of wave 1 on a weekly chart and a break above it indicates an invalidation of a long-term bearish wave count.
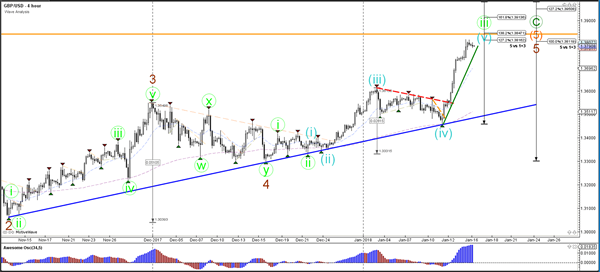
The GBP/USD bullishmomentum is best explained by a wave 3 (grey) and a retracement is most likely a wave 4 (grey) if price behaves slowly and correctively.
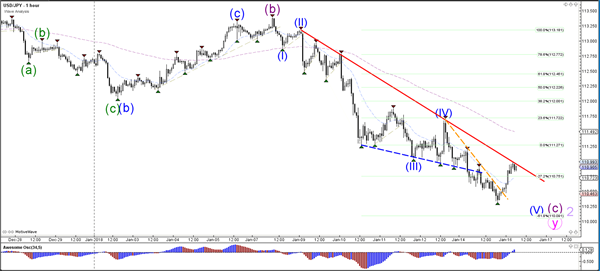
Currency pair USD/JPY
The USD/JPY downtrend is challenging the resistance trend line (red). A bearish bounce could indicate a continuation towards the -61.8% Fibonacci target at 110.
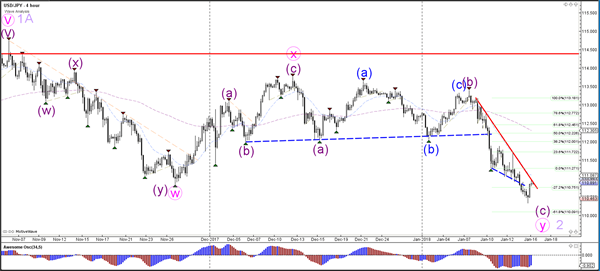
The USD/JPY is testing the resistance trend line (red) of the downtrend. A bullish break could indicate a reversal and continuation of the bullish momentum.