
A note on lower timeframe confirming price action…
Waiting for lower timeframe confirmation is our main tool to confirm strength within higher timeframe zones, and has really been the key to our trading success. It takes a little time to understand the subtle nuances, however, as each trade is never the same, but once you master the rhythm so to speak, you will be saved from countless unnecessary losing trades. The following is a list of what we look for:
- A break/retest of supply or demand dependent on which way you’re trading.
- A trendline break/retest.
- Buying/selling tails – essentially we look for a cluster of very obvious spikes off of lower timeframe support and resistance levels within the higher timeframe zone.
- Candlestick patterns. We tend to only stick with pin bars and engulfing bars as these have proven to be the most effective.
EUR/USD
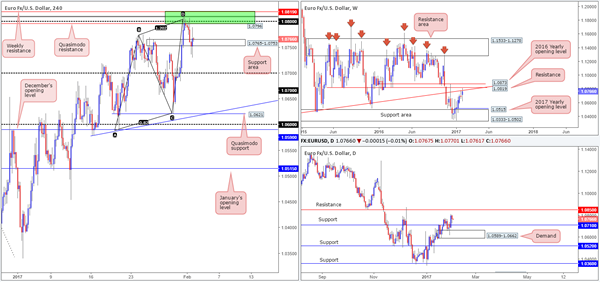
For those who read Wednesday’s report on the EUR you may recall that our desk executed a market sell order at 1.0798, with a stop placed at 1.0824. Fueled by the upbeat numbers seen from both the US ADP non-farm employment change and US manufacturing PMIs, the trade struck the H4 support area at 1.0765-1.0753 during yesterday’s sessions. 50% of the position was taken off the table, and risk was also reduced to breakeven. The final take-profit zone, according to our team, is set around the 1.07 neighborhood which is sited only a few pips south of daily support coming in at 1.0710.
Why we entered short where we did was due to the following converging structures: a H4 Quasimodo resistance level at 1.0796, a 1.08 handle, a H4 88.6% Fib resistance at 1.0810, Weekly resistance at 1.0819 and a H4 symmetrical AB=CD approach terminating at 1.0805. Well done to any of our readers who jumped on board here!
Our suggestions: Although there is a chance that price may retest the above noted H4 sell zone today, thereby taking us out of the current position, an additional retest could offer traders (and us) a second opportunity to trade this area. Why would we look to enter here when the zone may have been weakened by yesterday’s decline? Good question! Well, apart from the fact that weekly resistance at 1.0819 is now IN PLAY, stops below the H4 support area mentioned above at 1.0765-1.0753 have also very likely been taken out, thus clearing the path south down to 1.07ish.
Data points to consider: ECB President Draghi speaks at 12.15 pm. US Jobless claims at 1.30pm GMT.
Levels to watch/live orders:
- Buys: Flat (stop loss: N/A).
- Sells: 1.0798 ([live position] stop loss: breakeven).
GBP/USD
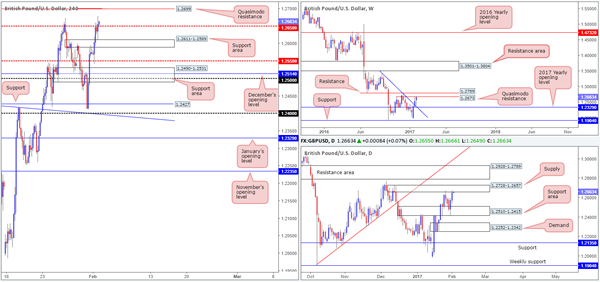
Following the FOMC’s decision to leave interest rates unchanged, as expected, sterling gravitated north from the top edge of a H4 support area coming in at 1.2611-1.2589. In consequence to this, the H4 mid-way resistance at 1.2650 was engulfed, potentially clearing the trail north to a H4 Quasimodo resistance drawn from 1.2699. What is quite notable here, at least from a technical standpoint, is its surrounding confluence! Fusing not only with the 1.27 psychological handle, it is also housed within a daily supply at 1.2728-1.2657, as well as positioned only 25 or so pips above the weekly Quasimodo resistance at 1.2673.
Our suggestions: On the data front today the GBP has a rather busy schedule ahead, with the main event being the BoE’s monetary policy decision. However, dependent on the time of day, one could possibly look to sell from the 1.27 mark without the need for additional confirmation, as stops can be positioned above the aforementioned daily supply around the 1.2730 range.
Data points to consider: UK Construction PMI at 9.30am, UK BoE inflation report and Interest-rate decision at 12.00pm followed by BoE Gov. Carney due to speak at 12.30pm. US Jobless claims at 1.30pm GMT.
Levels to watch/live orders:
- Buys: Flat (stop loss: N/A).
- Sells: 1.27 region ([possible area to look at selling from without the need for additional confirmation] stop loss: 1.2730 – 2 pips above daily supply).
AUD/USD
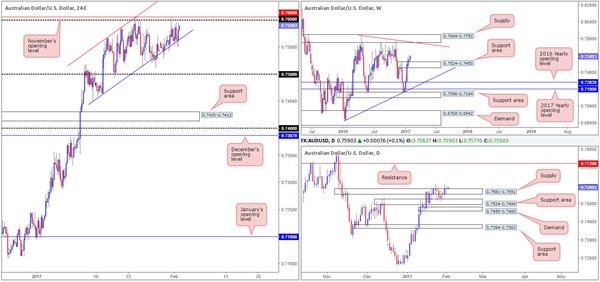
The Aussie dollar, as you can see, spent yesterday’s session clinging to the H4 channel support extended from the low 0.7449. While upside remains capped by the 0.76 handle and the nearby November’s opening level at 0.7606, we feel it’s only a matter of time before the bulls take charge and rise above these barriers. Our reasoning lies within the higher-timeframe structures. Over on the weekly chart, the weekly candles indicate bullish intent given the successful retest of a weekly support area at 0.7524-0.7450. In conjunction with the weekly timeframe, daily price is seen teasing the top edge of a daily supply zone coming in at 0.7581-0.7551. In the event that this barrier gives way, which we believe it will, the next upside hurdle on the hit list can be seen at 0.7720: a daily resistance level that is located 30 or so pips ahead of a weekly supply at 0.7849-0.7752 (the next upside target on the weekly scale).
Our suggestions: Before our team looks to become buyers in this market, nevertheless, we’d need to see a decisive H4 bullish close above the 0.7606 region. That way, we can be relatively sure that offers within the current daily supply are exhausted. A H4 close above this number, followed by a retest and either a lower-timeframe confirming buy signal (see the top of this report) or a H4 bullish candle close would, in our opinion, be sufficient enough to enter into a buy trade.
Data points to consider: Aussie building approvals and trade balance at 12.30am. US Jobless claims at 1.30pm GMT.
Levels to watch/live orders:
- Buys: Watch for a H4 close to be seen above 0.7606 and then look to trade any retest seen thereafter ([waiting for a lower-timeframe confirming setup to form following the retest is advised prior to pulling the trigger] stop loss: dependent on where one confirms this area).
- Sells: Flat (stop loss: N/A).
USD/JPY
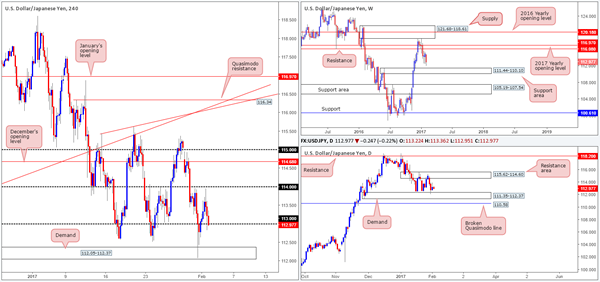
The buyers managed to find their feet early on in the day yesterday, successfully breaking above the 113 psychological handle. US ADP non-farm employment change, along with US manufacturing PMIs both came in above expectations, thus boosting the appeal to own US assets. Despite this, however, price failed to muster enough strength to overcome the 114 band and, fueled by the recent FOMC meeting, consequently dropped to lows of 112.83 by the close.
As of this time, we can see that the weekly candles have space to push south this week down to the weekly support area penciled in at 111.44-110.10. However, daily demand at 111.35-112.37, which is positioned on top of the above noted weekly support area, is still very much in play right now.
Our suggestions: Buying from 113 today would, in our book of technical charms, be considered a risky move. There’s very little confluence supporting this line both on the H4 chart and on the higher timeframes. While a breakdown through this level may encourage further selling to H4 demand at 112.05-112.37 (housed within the aforementioned daily demand), a short beyond this number places one in direct conflict with daily buyers! Therefore, opting to stand on the sidelines today may very well be the better path to take.
Data points to consider: US Jobless claims at 1.30pm GMT.
Levels to watch/live orders:
- Buys: Flat (stop loss: N/A).
- Sells: Flat (stop loss: N/A).
USD/CAD
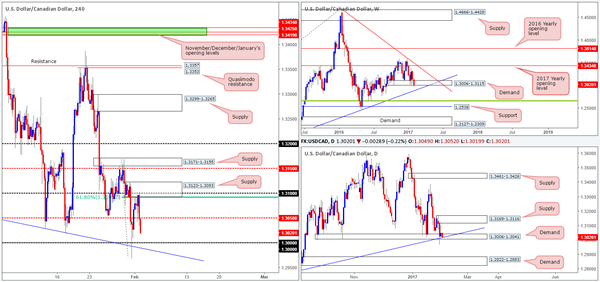
Exacerbated by yesterday’s FOMC meeting where interest rates were left unchanged, the H4 supply at 1.3123-1.3093 (bolstered by a H4 61.8% Fib resistance at 1.3091 and the 1.31 handle) held beautifully. This was a noted zone to watch for shorts assuming that the lower-timeframe action chalked in a sell setup. As price rebounded so fast, lower-timeframe confirmation was unfortunately not seen. Nevertheless, well done to any of our readers who managed to net some green pips here!
At the time of writing, the H4 candles recently squeezed through the H4 mid-way support at 1.3050 and looks to be on course to shake hands with the 1.30 handle. Seeing as how both weekly and daily price remain within demand at the moment (1.3006-1.3115/ 1.3006-1.3041), 1.30, coupled with a H4 trendline support extended from the low 1.3080, could potentially provide a floor in this market today.
Our suggestions: Although the higher-timeframe candles are positioned within demand, both areas recently suffered a breach, thus possibly weakening the zones. As a result, we feel the best method of approach here would be to wait for price to strike the 1.30 neighborhood and see if the H4 candles are able to print a reasonably sized H4 bull candle. Of course, this will not guarantee a winning trade, but what it will do is indicate whether or not there is buyer interest here.
Data points to consider: US Jobless claims at 1.30pm GMT.
Levels to watch/live orders:
- Buys: 1.30 region ([wait for a H4 bull candle to form before looking to execute a trade] stop loss: ideally beyond the trigger candle).
- Sells: Flat (stop loss: N/A).
USD/CHF
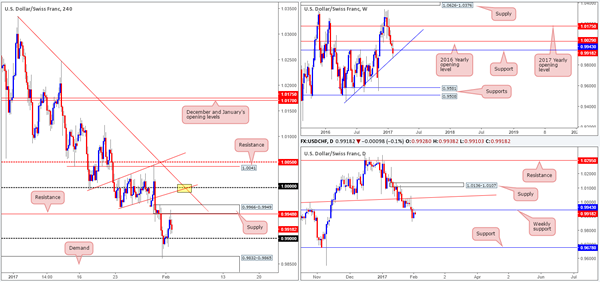
Going into the early hours of yesterday morning, the pair marginally closed above the 0.99 handle and retested the line as support. This – coupled with upbeat numbers seen from both the US ADP non-farm employment change and US manufacturing PMIs, helped lift the H4 candles up to H4 supply at 0.9966-0.9949. As you can see, reinforced by the FOMC leaving rates on hold, bids dried up after connecting with this zone and sent the unit to lows of 0.9909 on the day.
With the above in mind, here is how we see this market at the moment:
- Weekly action recently broke through weekly support at 0.9943, but is currently being supported by a weekly trendline taken from the low 0.9443.
- Daily flow is, as you can see, retesting the underside of the above noted weekly support as resistance.
Our suggestions: While H4 supply could continue to hold firm today given that it’s wrapped around the recently broken weekly support, let’s not forget that parity (1.0000) is lurking just above. This number alone attracts a huge amount of attention, but when combined with two H4 trendline resistances (0.9959/1.0335), which also sits just below a daily trendline resistance drawn from the high 0.9956, a reaction is highly probable!
Essentially, we’re recommending keeping an eyeball on both the H4 supply zone, and parity today. Whether or not the trader deems these areas to be stable enough to trade without additional confirmation is, of course, dependent on one’s trade plan. For us, we would require lower-timeframe confirming action (see the top of this report) to be seen before a sell trade can be executed. We require it at parity since there is no structural supply to the left of current price on the H4, and we also require it at the H4 supply since this will be its second retest!
Data points to consider: US Jobless claims at 1.30pm GMT.
Levels to watch/live orders:
- Buys: Flat (stop loss: N/A).
- Sells: 0.9966-0.9949 ([wait for a lower-timeframe confirming setup to form before looking to execute a trade] stop loss: dependent on where one confirms this area). 1.0000 neighborhood ([wait for a lower-timeframe confirming setup to form before looking to execute a trade] stop loss: dependent on where one confirms this area).
DOW 30
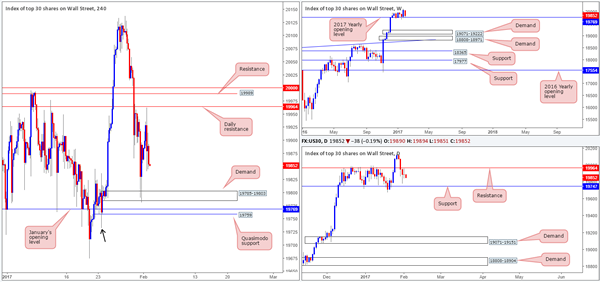
US equity prices are little changed this morning, despite yesterday’s upbeat US economic data. The H4 candles are seen loitering mid-range between a daily resistance level at 19964 and a H4 demand coming in at 19785-19803. Meanwhile, up on the weekly chart, the index is currently hovering just ahead of the 2017 yearly opening level at 19769. A decisive weekly close beyond this range could spark another wave of selling down to the weekly demand area at 19071-19222. Before this can be achieved, however, a daily close below the daily support at 19747 would, of course, need to be seen!
With the above noted H4 demand likely weakened by the recent attack, the next level of interest on our radar is still 19759: a sneaky H4 Quasimodo support that is bolstered by the 2017 yearly opening base and the nearby daily support.
Our suggestions: Given the confluence in place around the current H4 Quasimodo support, our team still has a pending buy order placed at 19760, with a stop set just below the apex of the Quasimodo formation (see black arrow) at 19730.
Data points to consider: US Jobless claims at 1.30pm GMT.
Levels to watch/live orders:
- Buys: 19760 ([pending order] stop loss: 19730).
- Sells: Flat (stop loss: N/A).
GOLD
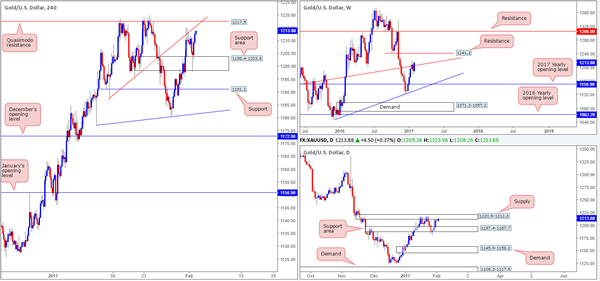
Kicking off this morning’s report with a look at the weekly chart, we can see that the weekly bulls are currently attempting to overcome the weekly trendline resistance taken from the low 1130.1. In the event that they succeed here, the next angle on the horizon is seen around the weekly resistance level at 1241.2. The story on the daily chart, however, shows that the candles remain capped by a daily supply area fixed at 1220.9-1212.0. Therefore, unless a daily close is seen above this area, our desk will not commit to any medium/long-term longs in the gold market.
Sliding over to the H4 timeframe, the H4 support area at 1198.4-1203.8 held beautifully going into yesterday’s US segment. Despite this, the yellow metal was effectively unchanged by the closing bell. A notable area of interest for our team on this scale today is the H4 Quasimodo resistance level at 1217.5, which, as you can see, converges beautifully with a H4 trendline resistance taken from the low 1187.7 and also sits within the above said daily supply.
Our suggestions: Put simply, we’ll be keeping a close tab on the H4 Quasimodo resistance today. Should price connect with this line and pencil in a lower-timeframe sell signal (see the top of this report), our team would look to sell, targeting the aforementioned H4 support area as an initial take-profit target.
Levels to watch/live orders:
- Buys: Flat (stop loss: N/A).
- Sells: 1217.5 region ([wait for a lower-timeframe confirming setup to form before looking to execute a trade] stop loss: dependent on where one confirms this area).


