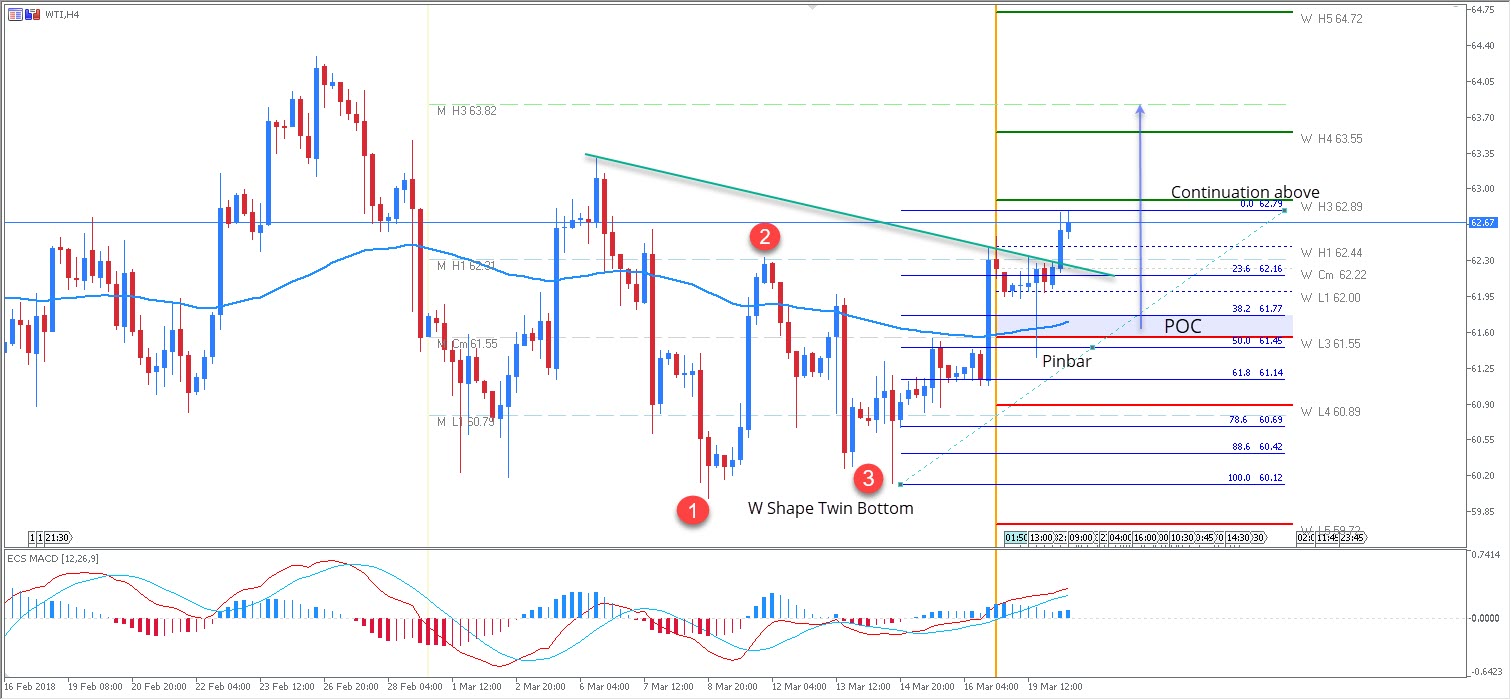
The WTI has formed a W-Shape Twin Bottom suggesting bullish pressure. The price has made a bullish pinbar straight off W L3 support which creates a POC zone. In the case of a retracement, the POC should provide another bounce. If we see a strong 1h momentum aboveW H3 (or 4h close above), next target is W H4/ M H3 63.55-82. As long as the price holds above W L4/ M L1 60.90, bulls should have the upper hand.
W H3 -Weekly Camarilla Pivot (Weekly Interim Resistance)
W L3 – Weekly Camarilla Pivot (Weekly Interim Support)
W H3 – Weekly Camarilla Pivot (Weekly Interim Resistance)
W H4 – Weekly Camarilla Pivot (Strong Weekly Resistance)
M H4 – Daily Camarilla Pivot (Very Strong Monthly Resistance)
M L3 – Daily Camarilla Pivot (Monthly Support)
M L4 – Daily H4 Camarilla (Very Strong Monthly Support)
POC – Point Of Confluence (The zone where we expect price to react aka entry zone)