
The FOMC gradual rate hiking clearly sustained the stock markets and indices along with stocks which enjoyed a sustained bullish rally. This has been going on since the 2008 Recession.
Volatility hit record lows in the 4th quarter of 2017 and this was obviously caused by investors’ complacency and buying euphoria.
The buying euphoria was suddenly interrupted on the 21st of Jan 2018, when Dow Jones, SNP500 and Nasdaq have shown huge drops in price action, causing investors to wake up on the edge of the cliff.
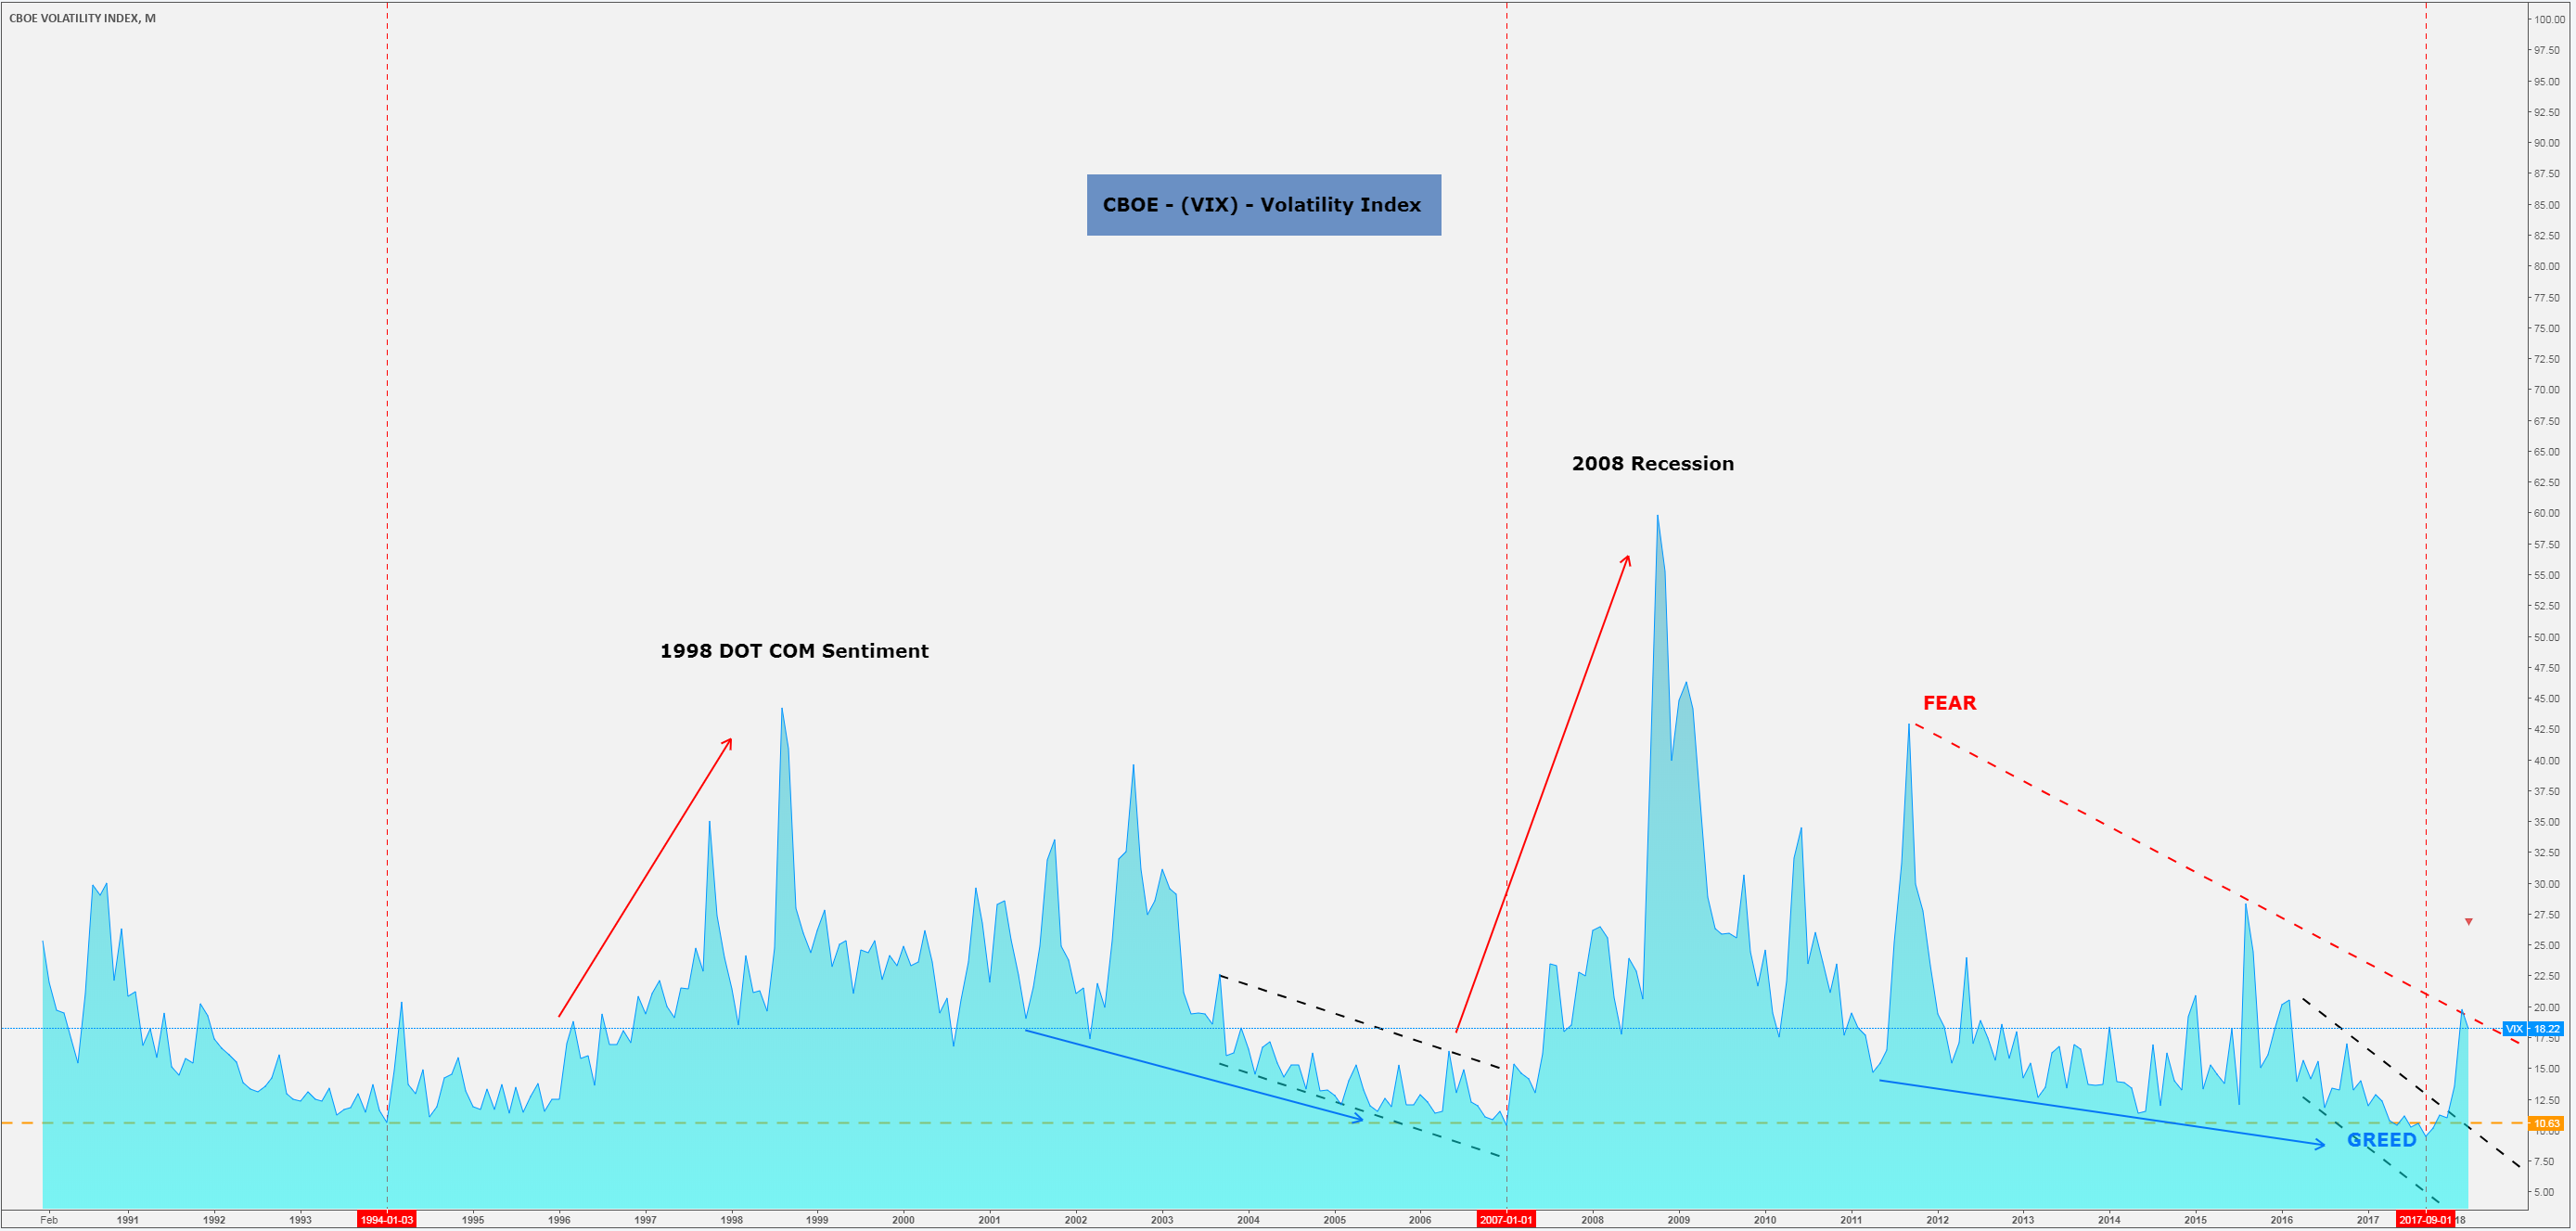
CBOE (VIX) is a Volatility Index and is also known as the Fear & Green indicator. It is used by traders as measurement tool in order to determine when the next significant swing would occur. When VIX is rising, the market keeps going bearish, making the fear effect possible.
From the VIX chart below, it can be clearly seen that volatility is back, and with it comes the fear effect.
VIX – Monthly Chart:
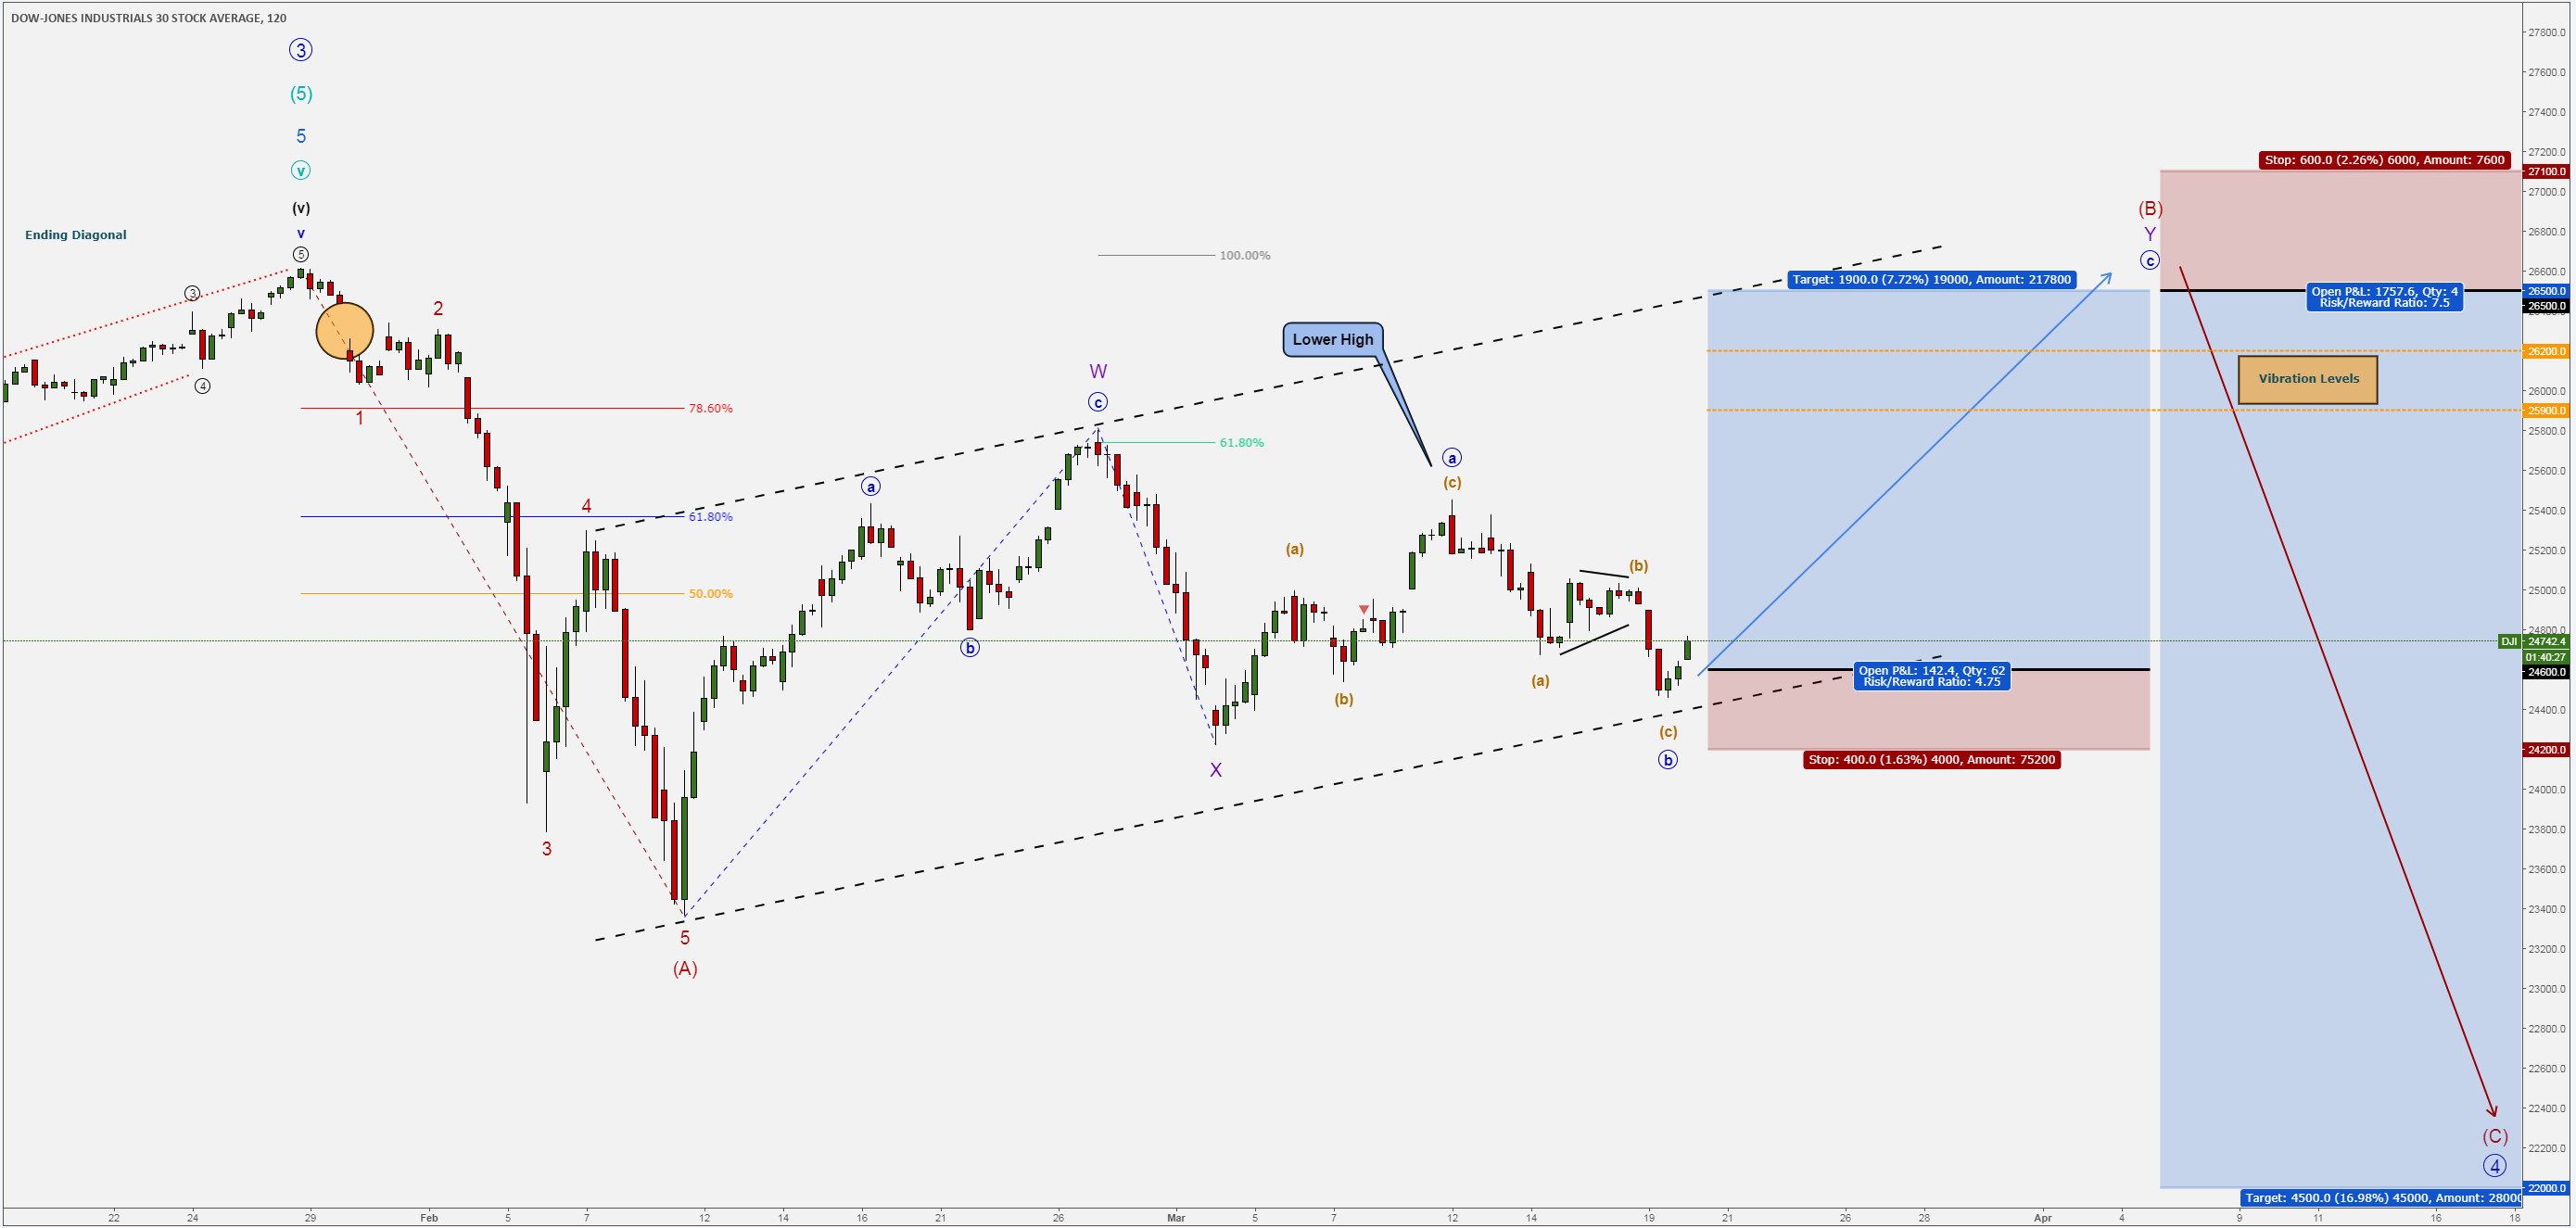
The Indices sell-off mentioned above would be considered, from a technical point of view, the first leg of the bigger Corrective Structure.
Sell-off paused on the 9th Feb 2018, and ever since then, Indices have been slowly grinding upwards, showing limitations and mostly sideways movements.
By looking at the VIX chart, one would notice that since Sep 2017, VIX broke on the up-side and caused uncertainty. Currently, it looks as if VIX could be preparing for another spike.
 FOMC Fundamentals & Speculation
Looking towards tomorrow’s FOMC press conference and rate decision, headlines and the overall feeling is that the FED will most likely increase interest rates, from 1.50% towards 1.75% benchmark points.
The key point which investors will be closely monitoring will be whether or not the FED will accelerate the pace of rate hikes this year. Three rate hikes are already priced in and at this stage, the FED may only surprise the market if more than three will be in play in 2018. This can only come from Jerome Powell’s comments during the Press Conference.
More aggressive rate increases would likely slow the economy and make stocks less appealing.
Technically, the charts are stating that the FED would remain on path with their projected and gradual interest rates rises.
Indices & Elliott Wave Analysis
Dow Jones 2H Chart:
 SNP500 2H Chart:
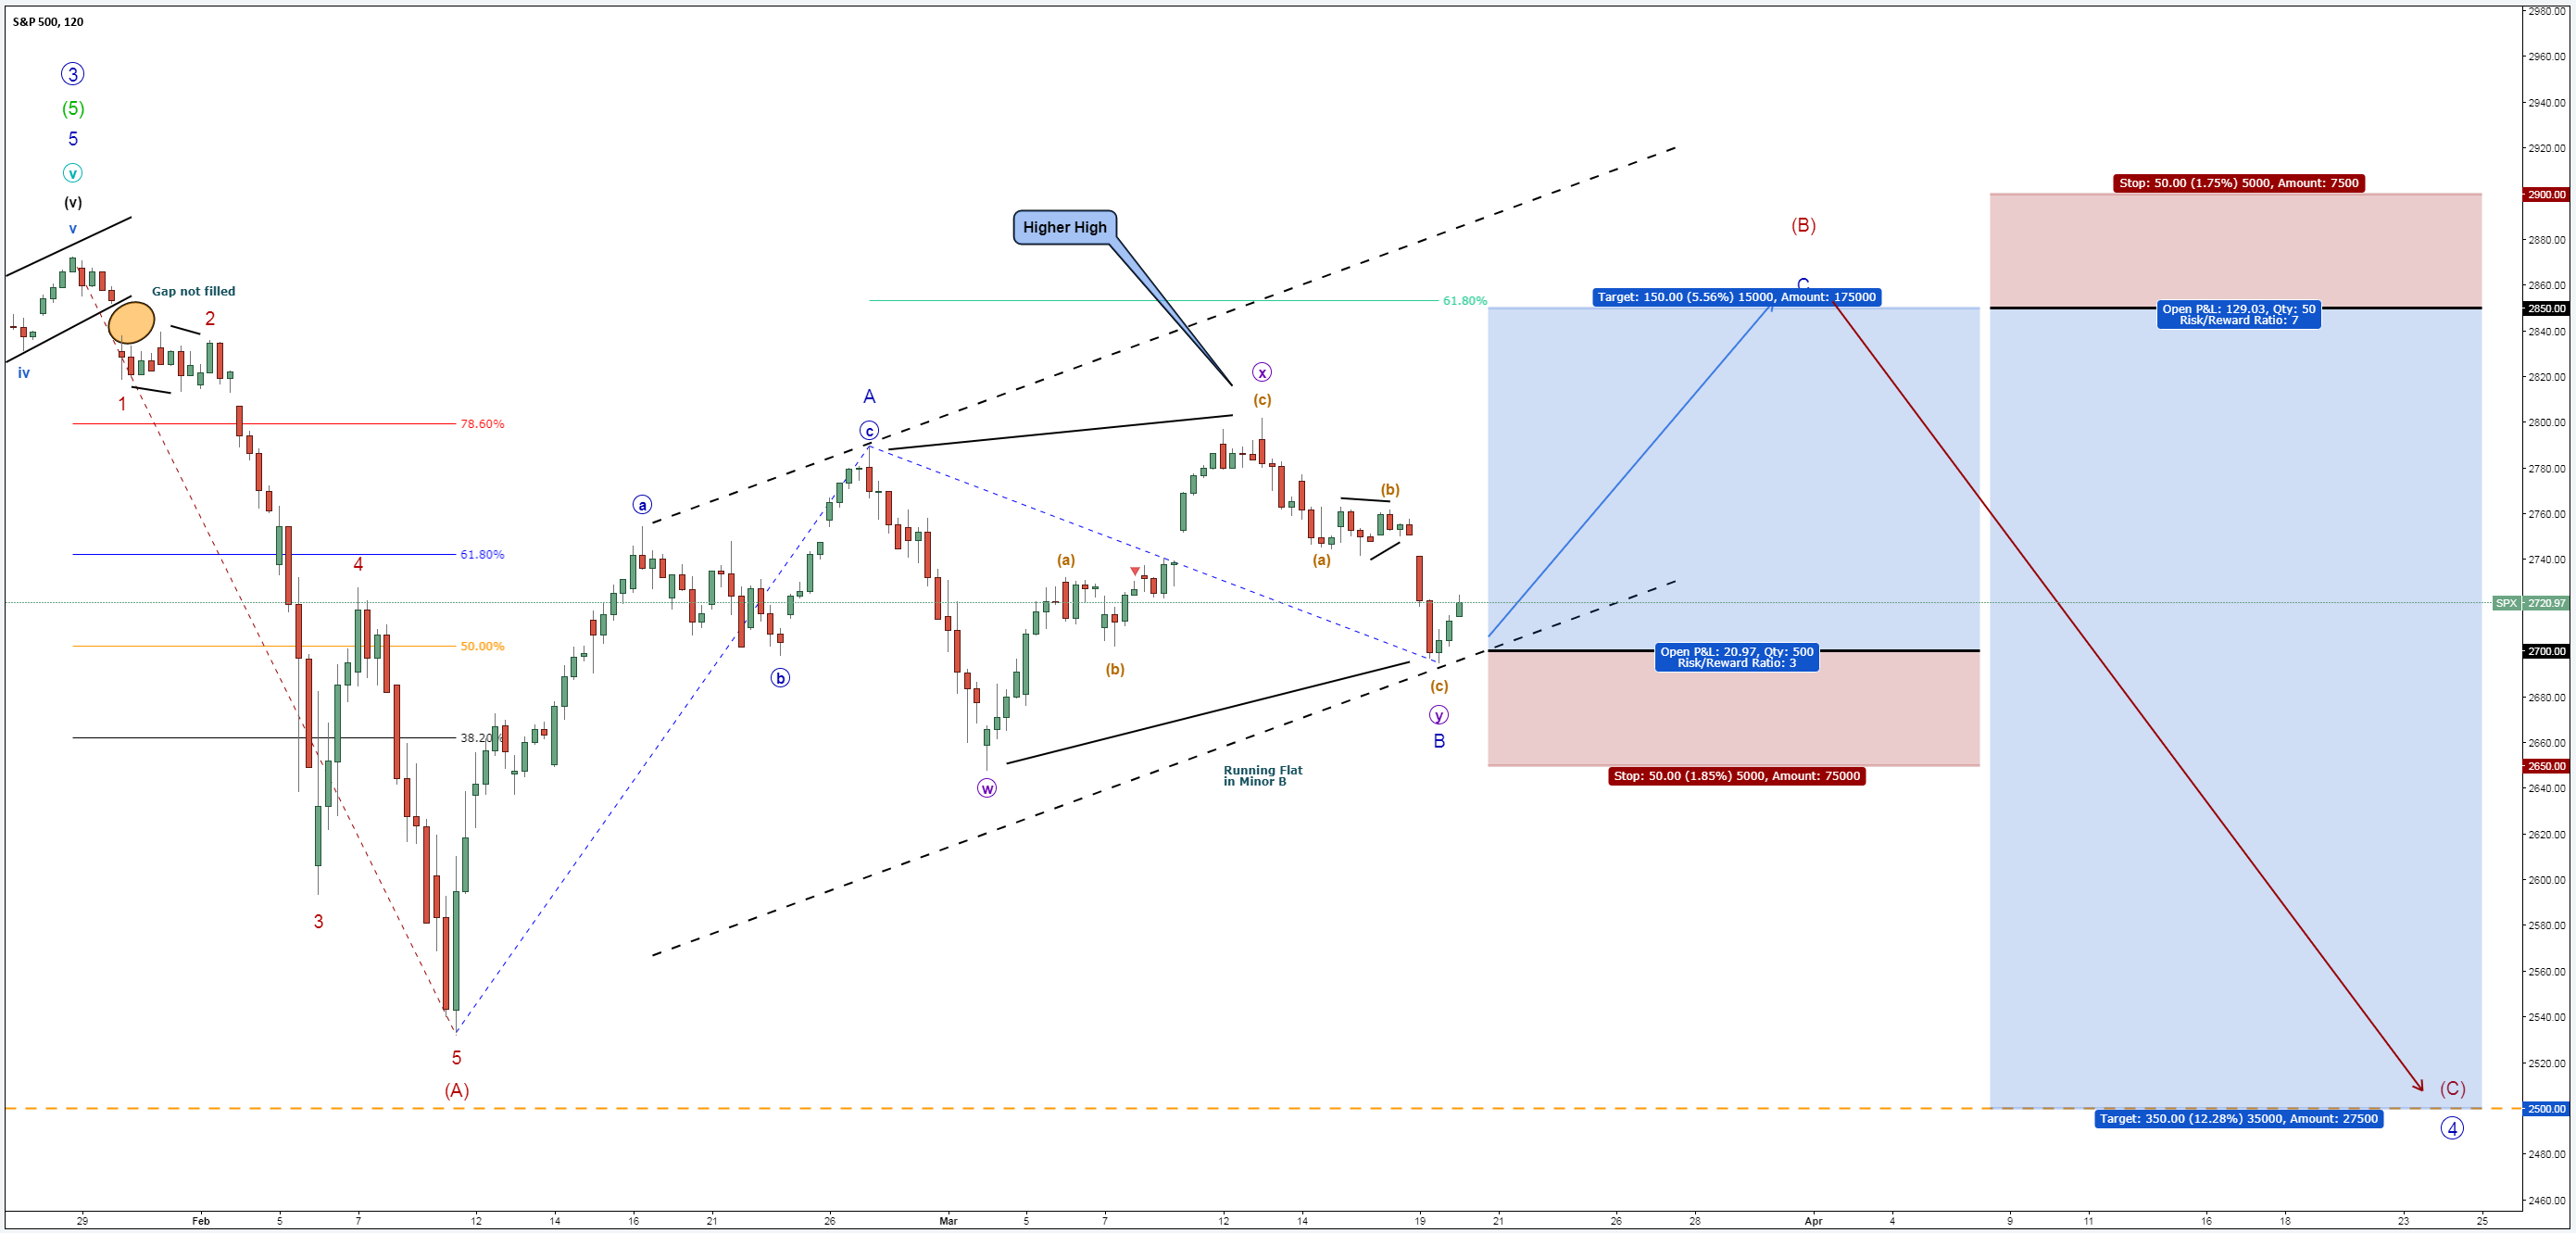
Nasdaq100 Daily Chart: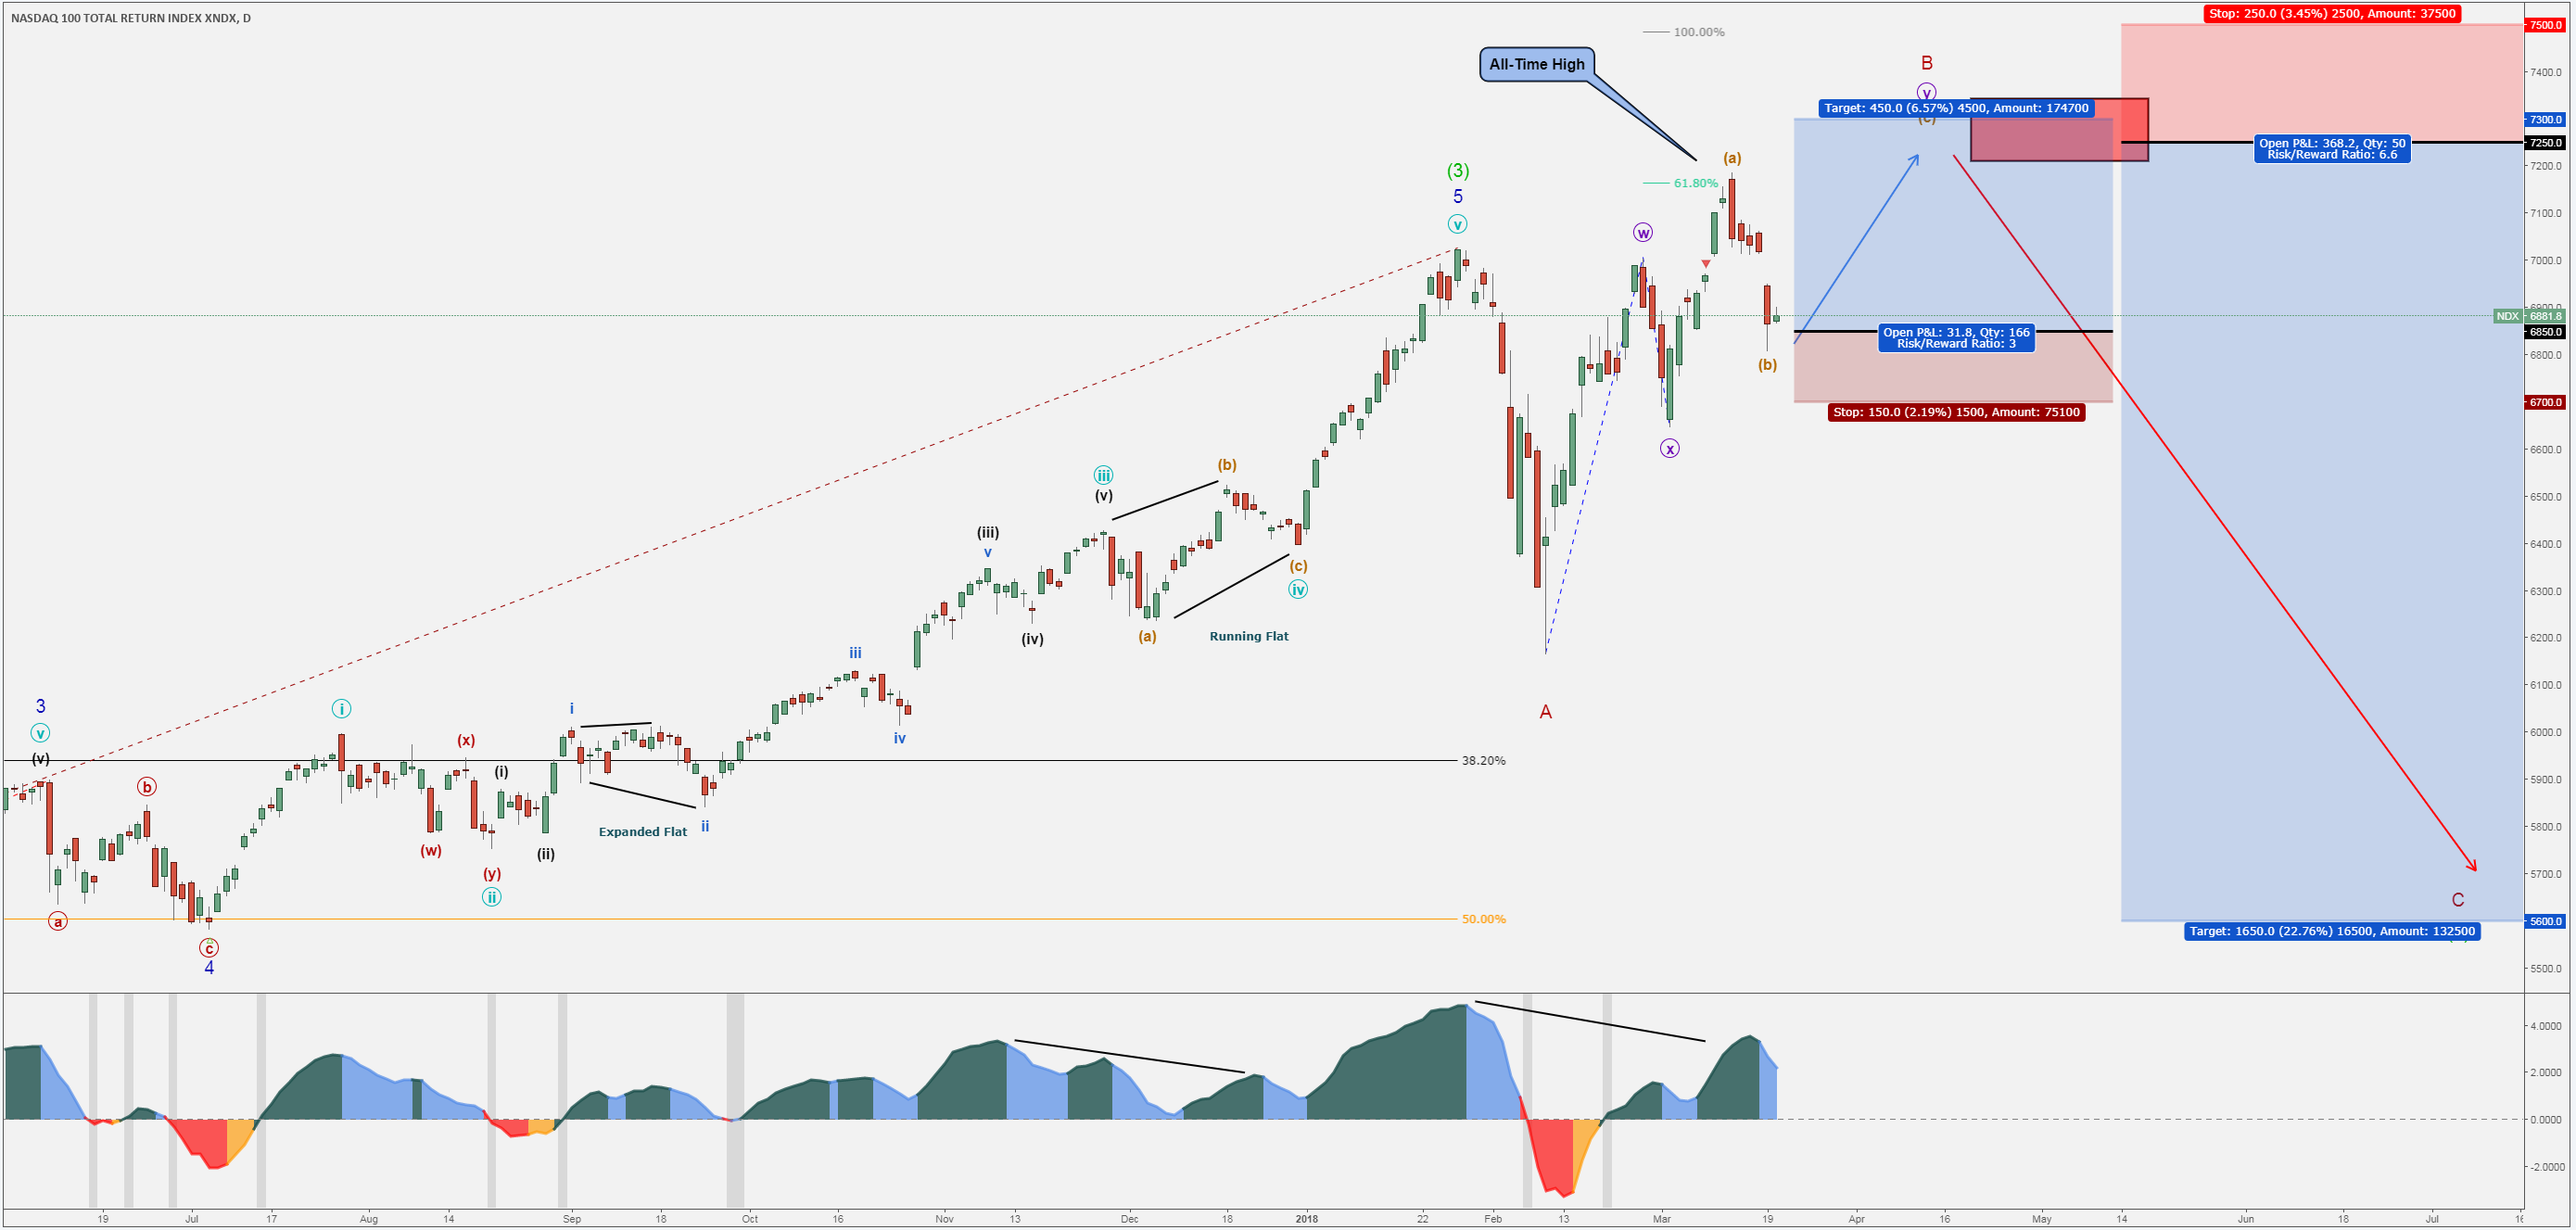
DAX30 2H Chart: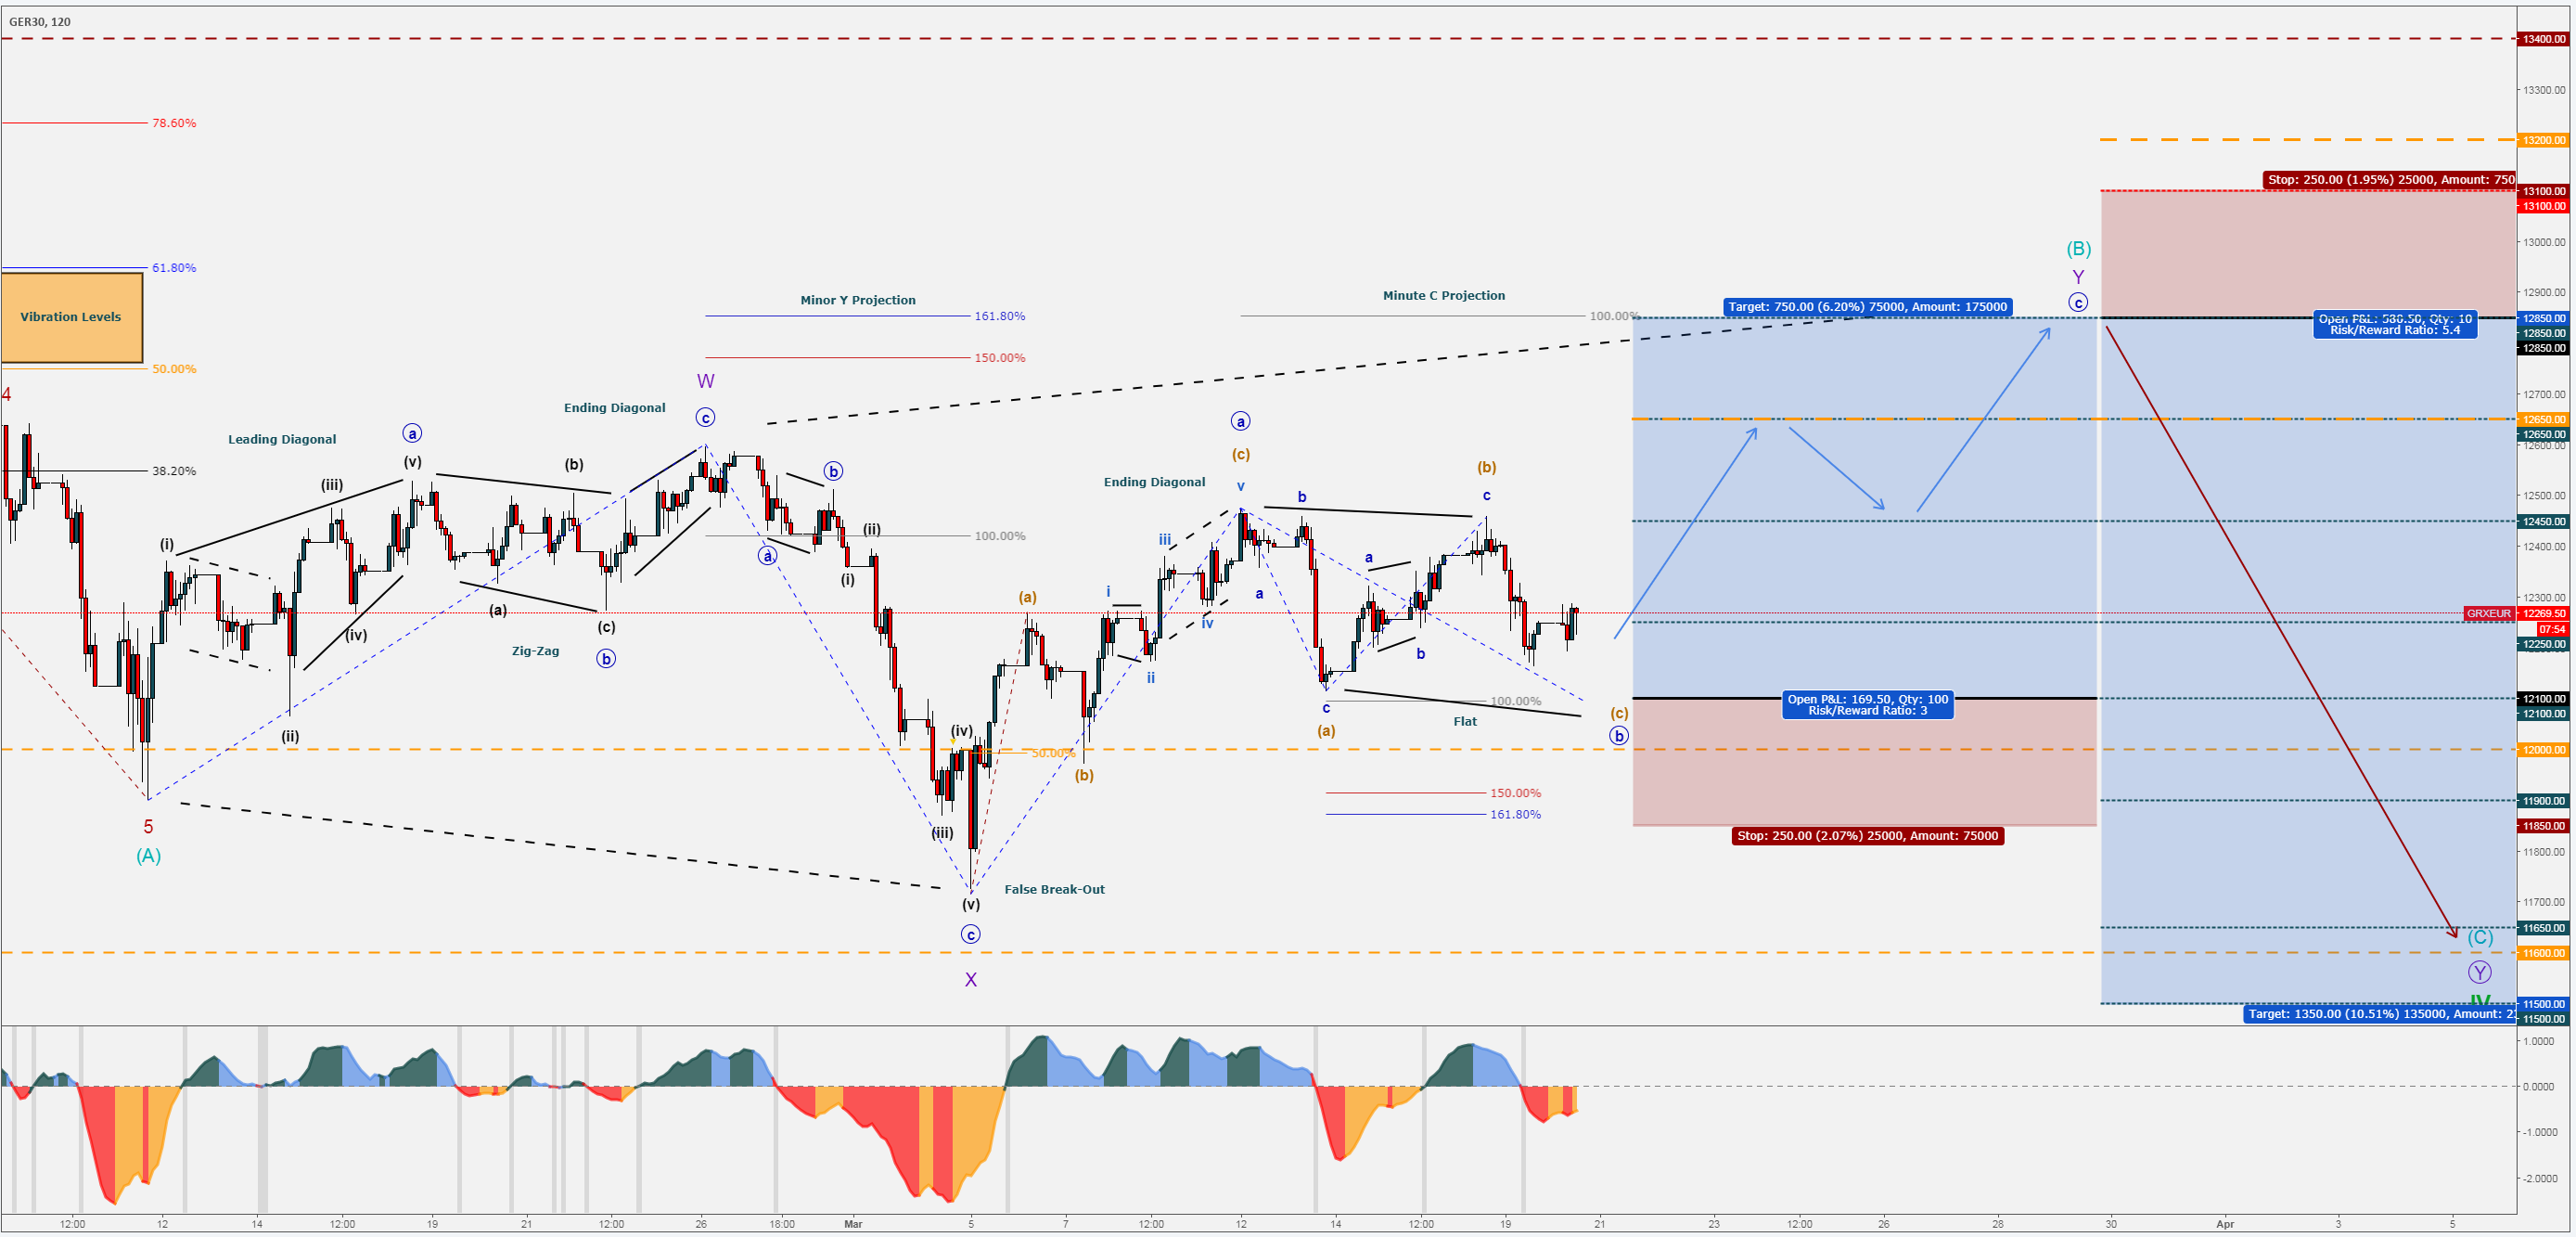
CAC40 4H Chart: Indices are pointing towards a possible bullish wave before the primary corrective structure would complete with another set of volatility fears.
*The present analysis is to be treated as simple market commentary and not as an investment advice or as a solicitation to trade. Please be aware of the real risk involved by trading financial instruments.
Many pips ahead.


