EUR/USD
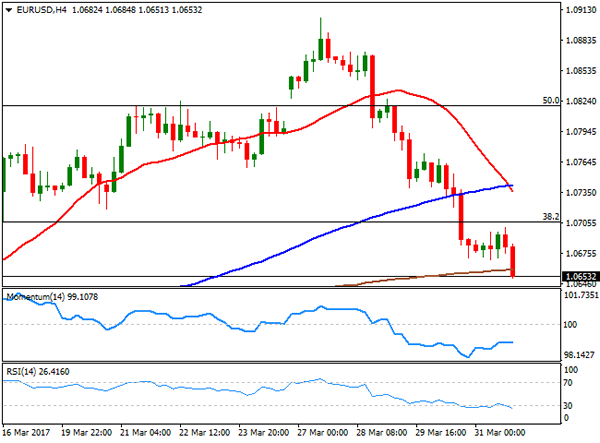
The EUR/USD pair maintained the sour tone on Friday, ending the week at 1.0656, its lowest since mid March. The release of worse-than-expected EU preliminary inflation for March weighed on the common currency, further reinforcing early week talks on the ECB being concerned about yields raise and that therefore, was not considering retrieving its massive stimulus program. Dollar’s performance was uneven across the board, but ended it generally stronger, except against the Pound that managed to end the week with gains, in spite of softer final growth figures for the last quarter of 2016, as Fed’s Dudley stated that the Central Bank could begin shrinking its balance sheet as soon as this year, should the economy perform in line with their expectations.
The week will start with the release if the final Markit manufacturing PMIs for the EU, expected with modest revisions from the flash readings, still showing that the EU’s private sector kept growing at its fastest pace in years, and another speech from Fed’s Dudley.
From a technical point of view, the EUR/USD pair has turned strongly bearish after toping at 1.0905 at the beginning of last week, given that in the daily chart, the price has faltered around the 200 DMA before turning south, now trading also below the 20 DMA and not far above a horizontal 100 DMA, this last around 1.0620, now the immediate support. Technical indicators in the mentioned time frame head sharply lower within negative territory, indicating strong momentum within sellers. In the shorter term, and according to the 4 hours chart, the RSI indicator turned south after being unable to recover from oversold territory, now around 26, whilst the Momentum indicator turned flat within bearish territory, as the price develops far below its 20 and 100 SMAs, all of which supports additional declines, with the downward momentum expected to accelerate on a break below 1.0590.
Support levels: 1.0620 1.0590 1.0565
Resistance levels: 1.0670 1.0710 1.0745
USD/JPY
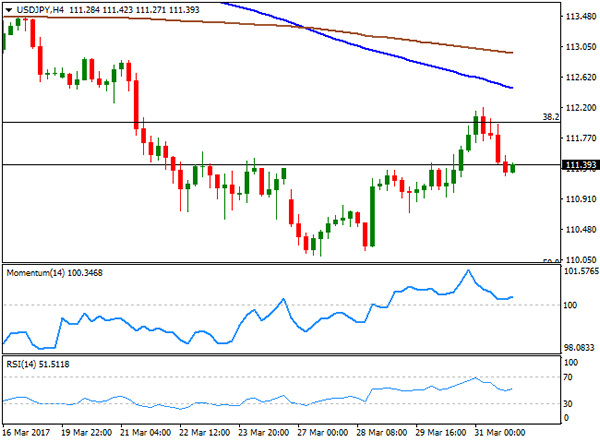
The USD/JPY pair advanced up to 112.19 early Friday, its highest for the week, but closed the day in the red around 111.36 as the positive momentum faded on mute yields. The advance, was triggered by better-than-expected Japanese inflation figures that picked up in February, whilst the unemployment rate fell to a two-decade low. Core yearly inflation surged for a second consecutive month up by 0.2% still far away from the BOJ’s 2% target, but at least out of negative territory. The poor performance of equities and yields, however, pushed the pair into the red during the last two sessions of the week. The daily chart shows that, despite closing with gains, the pair set a lower low and a lower high, indicating that the bearish dominant trend remains firm in place in the longer run. Daily basis, the pair is trading between the 100 and 200 SMAs, with the shortest capping the upside around 114.40, and the longest providing support at 109.20. Technical indicators in the mentioned chart diverge from each other, with the Momentum recovering and the RSI heading south, both within negative territory. Shorter term, the 4 hours chart shows that the 100 and 200 SMAs keep heading south above the current level, whilst technical indicators have turned flat within neutral territory. Renewed selling pressure below 111.00, will likely favor additional declines towards the 110.10 level, last week low.
Support levels: 110.95 110.50 110.10
Resistance levels: 111.60 112.00 112.50
GBP/USD
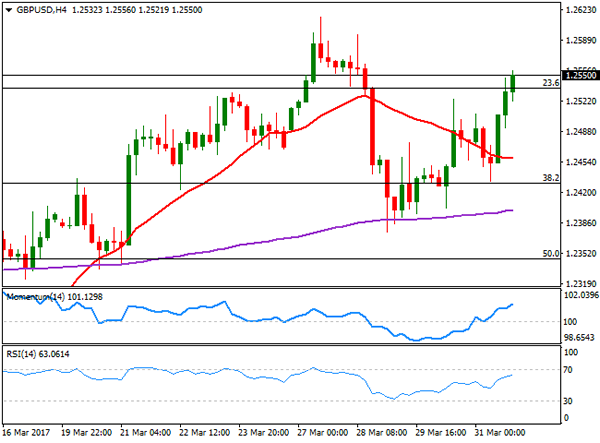
The GBP/USD pair closed Friday at 1.2550, marginally higher weekly basis and at its highest settlement since early February. The pair fell to 1.2375 last Wednesday, when the UK formally triggered the Brexit through a letter to the EU, further undermined by news that the Scottish Parliament backed FM minister Sturgeon desire to trigger a second independence referendum. The Pound, however, managed to recover the ground lost, despite UK’s final Q4 GDP suffered a modest downward revision, down to 1.9% from previous 2.0%, whilst Total Business investment fell by 0.9% in the last three months of 2016. The current account balance however, improved in the same period, printing a deficit of £12 billion against a previously revised one of £25 billion. Technically, the daily chart for the pair shows that the upside is favored as the price settled above the 23.6% retracement of its January’s rally and well above a bullish 20 SMA, whilst the RSI indicator resumed its advance within positive territory, now heading north around 60. In the 4 hours chart, technical indicators maintain upward slopes well into positive territory, whilst the 20 SMA has turned flat well below the current level, in line with the longer term perspective.
Support levels: 1.2520 1.2480 1.2445
Resistance levels: 1.2579 1.2620 1.2660
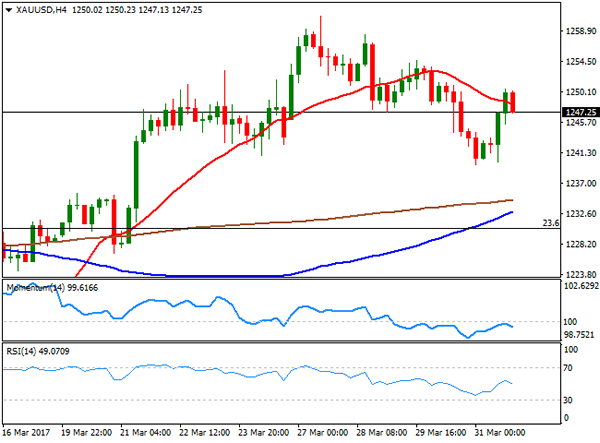
GOLD
The GBP/USD pair closed Friday at 1.2550, marginally higher weekly basis and at its highest settlement since early February. The pair fell to 1.2375 last Wednesday, when the UK formally triggered the Brexit through a letter to the EU, further undermined by news that the Scottish Parliament backed FM minister Sturgeon desire to trigger a second independence referendum. The Pound, however, managed to recover the ground lost, despite UK’s final Q4 GDP suffered a modest downward revision, down to 1.9% from previous 2.0%, whilst Total Business investment fell by 0.9% in the last three months of 2016. The current account balance however, improved in the same period, printing a deficit of £12 billion against a previously revised one of £25 billion. Technically, the daily chart for the pair shows that the upside is favored as the price settled above the 23.6% retracement of its January’s rally and well above a bullish 20 SMA, whilst the RSI indicator resumed its advance within positive territory, now heading north around 60. In the 4 hours chart, technical indicators maintain upward slopes well into positive territory, whilst the 20 SMA has turned flat well below the current level, in line with the longer term perspective.
Support levels: 1.2520 1.2480 1.2445
Resistance levels: 1.2579 1.2620 1.2660
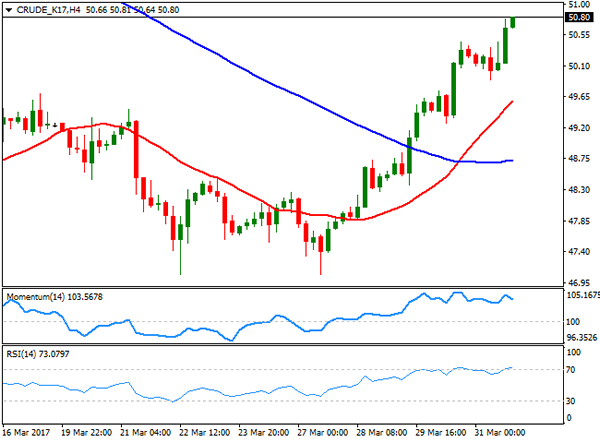
WTI CRUDE
Crude oil prices were in steady recovery mode this past week, with West Texas Intermediate crude oil futures settling at $50.80 a barrel. On Friday, the Baker Hughes report showed that the number of active US oil rigs drilling in the US rose by 10 to 662 in the week ending March 31st, but hopes that the OPEC would extend its output cut pass June lifted sentiment. During the weekend, OPEC’s Secretary-General Mohammad Barkindo said that stockpiles are starting to decline in the region, and bringing the market to balance, with a drag of an estimated of 285 million barrels of oil in storage, and therefore oil prices will likely hold on to gains. In the daily chart, the price has recovered far above its 20 and 200 DMAs, whilst technical indicators re-entered positive territory, although losing their upward momentum, somehow limiting chances of a steeper advance, but far from suggesting upward exhaustion. Shorter term, the 4 hours chart shows that indicators have settled in overbought territory, lacking directional strength, but also that the 20 SMA heads sharply higher above the 100 SMA and both below the current level, in line with the longer term perspective.
Support levels: 50.45 49.70 49.00
Resistance levels: 51.25 51.90 52.50
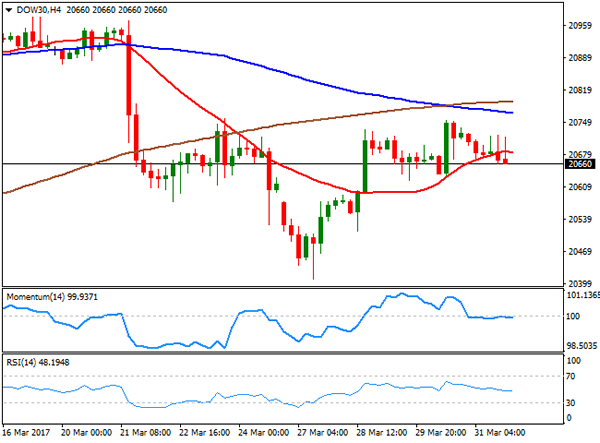
DJIA
US equities closed Friday in the red, although with solid gains for the first quarter of this 2017. The Dow Jones Industrial Average ended at 20,663.22, down 65 points on the day, but up 4.6% in the three months. The Nasdaq Composite shed 2 points to 5,911.74, while the S&P lost 0.23%, to 2,362.72 up 10% and 5.5% respectively in the quarter. Within the Dow, Intel was the best performer, adding 0.90%, followed by Wal-Mart that advanced 0.68%. Exxon Mobile was the worst performer, down 2.02%, followed by El du Pont that lost 1.60%. The DJIA daily chart shows that the index consolidated near its weekly high, but also that the risk remains towards the downside, as it was unable to advance beyond its 20 DMA, whilst technical indicators pared gains below their mid-lines, and resumed their slides. In the 4 hours chart, the benchmark presents a neutral-to-bearish stance, developing below its 100 and 200 SMAs and currently struggling with a horizontal 20 SMA, whilst technical indicators are stick around their mid-lines, with modest downward slopes.
Support levels: 20,623 20,562 20,513
Resistance levels: 20,717 20,757 20,806
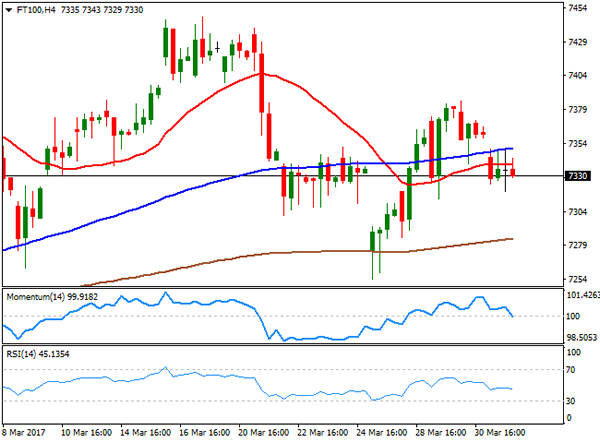
FTSE 100
The FTSE closed in the red last Friday, down 46 points or 0.63%, to 7,322.92, undermined by news coming from South Africa, as companies with business in the country led the decline following news that Finance Minister Gordhan was dismissed. Mining-related equities also weighed on the benchmark as metals fell on renewed dollar’s demand. Old mutual was the worst performer, down 7.51%, followed by Mediclinic International that shed 6.19% and Anglo American that closed 3.41% lower. The best performer was ITV that gained 3.55%. The daily chart for the Footsie shows that the index has settled below its 20 DMA whilst technical indicators turned south within neutral territory, increasing the risk of a bearish extension, although not enough to confirm it, given that the benchmark closed the week well off its low of 7,254. In the 4 hours chart, the index is now below horizontals 20 and 100 SMAs, whilst technical indicators are also easing around their mid-lines, in line with the longer term perspective. Friday’s low of 7,319 is the immediate support, the level to break to confirm another leg lower towards the mentioned 7,254.
Support levels: 7,319 7,289 7,254
Resistance levels: 7,349 7,387 7,415
DAX
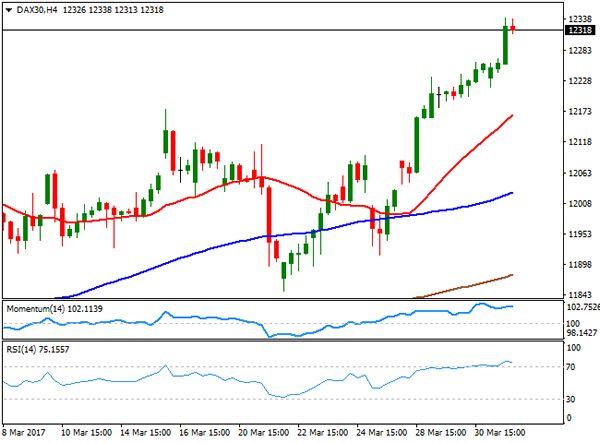
European equities closed mixed on Friday, but the German DAX managed to extend its advance, adding 56 points to end as 12,312.87, its highest settlement since April 2015. A weaker EUR underpinned the benchmark, while better-than-expected local employment data offsetting softer inflation figures released earlier in the week. RWE AG was the best performer, up 2.68% followed by E.ON that added 1.84%. Only six components closed in the red, with Commerzbank leading the decline, down 0.82%, followed by Daimler that shed 0.72%. The index holds not far from record highs settle two years ago at 12,399, maintaining the bullish reading according to technical readings, given that in the daily chart, it advanced further above a bullish 20 SMA, whilst technical indicators maintain their bullish slopes within positive territory, although with limited upward momentum. In the 4 hours chart, technical indicators consolidate within overbought territory, lacking directional strength, whilst the 20 SMA maintains its strong bullish slope far below the current level, indicating that the risk remains towards the upside.
Support levels: 12,275 12,221 12,180
Resistance levels: 12,341 12,399 12,450