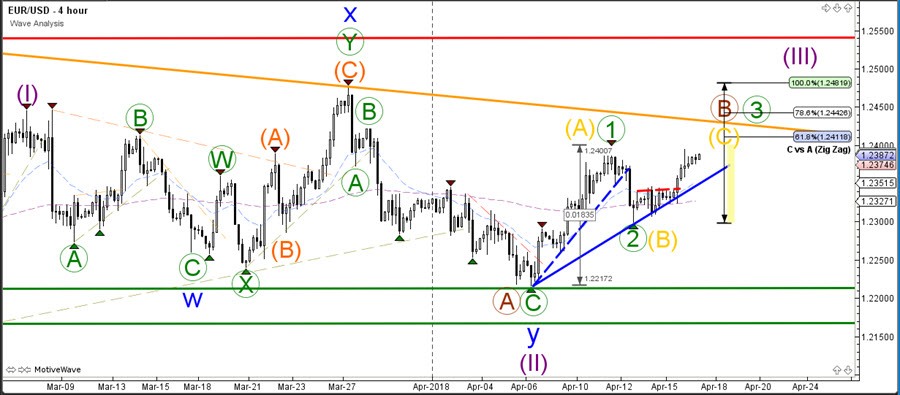
The EUR/USD made a bullish bounce, which could either be part of a larger ABC correction (gold) within a wave B (brown) or the start of an uptrend in wave 3 (green). The key level for determining whether it’s a 123 or ABC are the Fibonacci target levels. A bullish breakout above the 100% Fib level when comparing wave C versus A makes a wave 3 more likely.
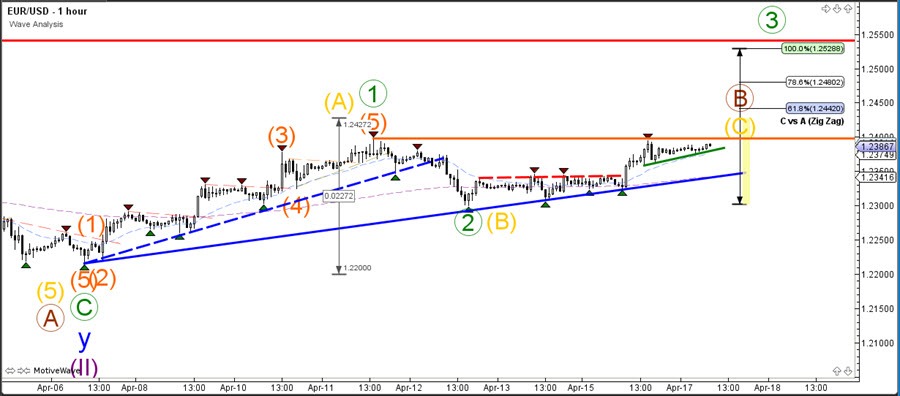
The EUR/USD broke above the resistance trend line (dotted red) and is now challenging the previous high (orange). A bullish breakout could expand the bullish momentum but the Fib levels remain key. A bearish breakout below the support trend lines could indicate weakness and a bearish reversal.
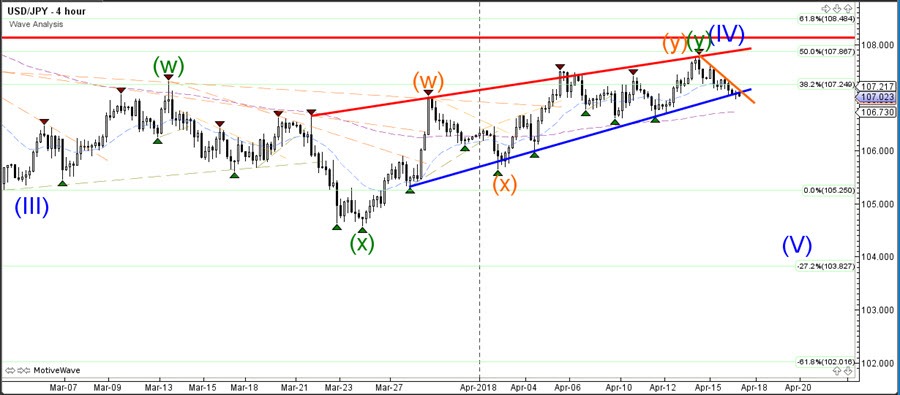
The USD/JPY has made a bearish reversal at the key 50% Fibonacci resistance level and price is now challenging and breaking below the support trend line (blue). The support is part of a rising wedge chart pattern and the bearish breakout could indicate a trend change.
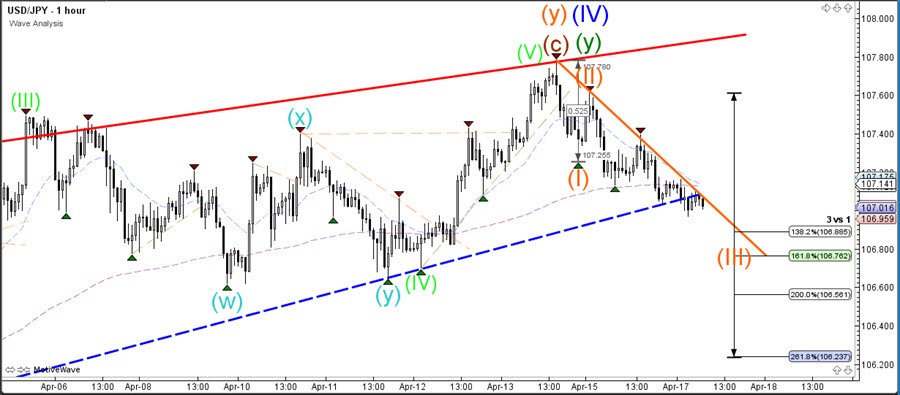
The USD/JPY is pushing below support (dotted blue) but price will need to reach at least the 161.8% Fibonacci target of wave 3 v1 before the wave 3 pattern becomes more likely. A bear flag chart pattern that appears after price hits this target could indicate a potential continuation setup.