Tension in Syria may have eased slightly with Trump’s suggestion of withdrawing US troops given that ISIS was largely contained. Macron’s views by comparison were slightly different, raising concerns still that instability in Syria will remain. On the flipside, as Oil prices have been rising, the US dollar hegemony on Oil contracts is at threat with China, Russia and Iran now finding an alternative to the US dollar for Oil contracts. US Treasury yields continue to rise, and is it a direct result to maintain demand and confidence in the US dollar is yet to be confirmed, but rising yields may push risk-off allocations towards Bond yields instead of Gold.
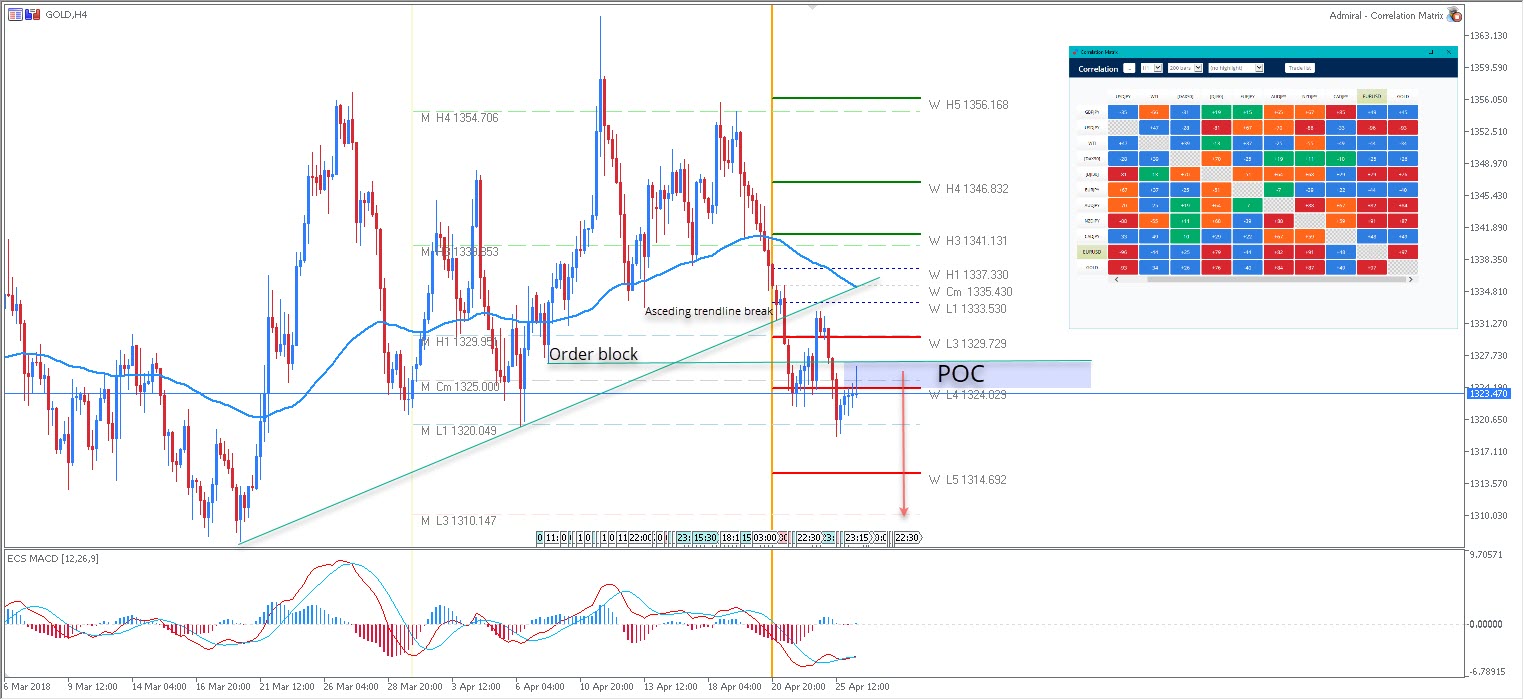
Looking at the correlation matrix, you can also see that there is a huge positive correlation between GOLD and EUR/USD. A drop in the EUR/USD also reflects on GOLD and vice versa. 1324-25 is the zone where we might see additional rejections towards M L1 -1320.049 and W L5 – 1314.69. This also implies a huge bearish structure that is a bit M-shaped so the Gold could be going for monthly L3 retest indeed -1310.14.
Source: Admiral Markets MT5 with MT5SE Add-on
W L3 – Weekly Camarilla Pivot (Weekly Interim Support)
W H3 – Weekly Camarilla Pivot (Weekly Interim Resistance)
W H4 – Weekly Camarilla Pivot (Strong Weekly Resistance)
M H4 – Monthly Camarilla Pivot (Very Strong Monthly Resistance)
M L3 – Monthly Camarilla Pivot (Monthly Support)
M L4 – Monthly H4 Camarilla (Very Strong Monthly Support)
POC – Point Of Confluence (The zone where we expect price to react aka entry zone)