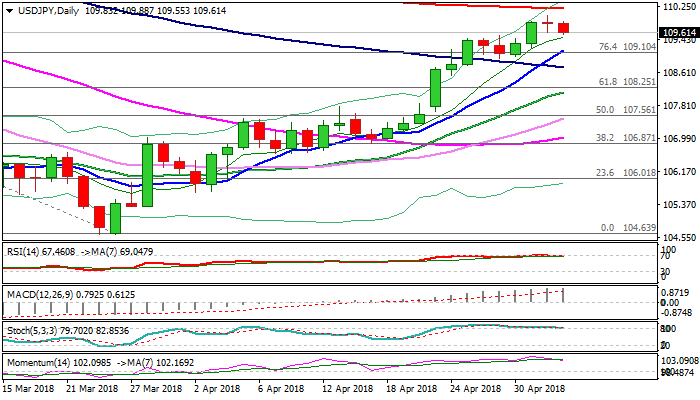
The pair holds in red in early Thursday’s trading and eases to 109.55 (European session low), penetrating rising hourly cloud (spanned between 108.71 and 109.50).
Reversal pattern is forming on daily chart after bulls stalled under 200SMA, following brief probe above psychological 110.00 barrier and Wednesday’s trading ended in Doji candle, signaling indecision.
Confirmation of reversal requires extension and close below rising 10SMA (109.15) to sideline bulls and signal deeper correction.
Daily RSI and slow stochastic are reversing from overbought territory and support scenario, together with 14-d momentum which turns south.
The notion could also find support from Fed’s policy statement which was seen by markets as not hawkish enough as expected to boost dollar for eventual break through 110.00 and 200SMA pivots.
Markets are focusing a number of data due later today, ahead of tomorrow’s release of US jobs data, which would provide stronger signals.
Res: 109.88, 110.03, 110.20, 110.48
Sup: 109.15, 109.15, 108.97, 108.74