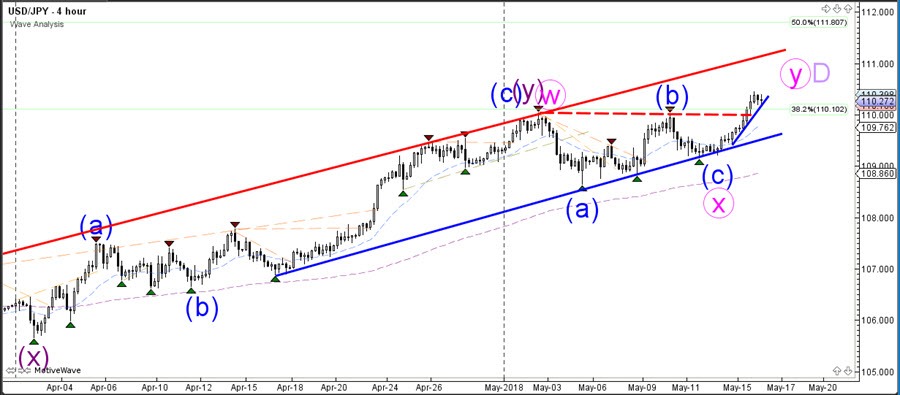
The USD/JPY broke above the previous top and resistance trend line (dotted red), which could indicate a continuation of the bullish channel towards 50% Fibonacci retracement level of wave D (light purple) at 111.80. The USD/JPY will need to stay above support trend lines (blue) to make an uptrend continuation more likely.
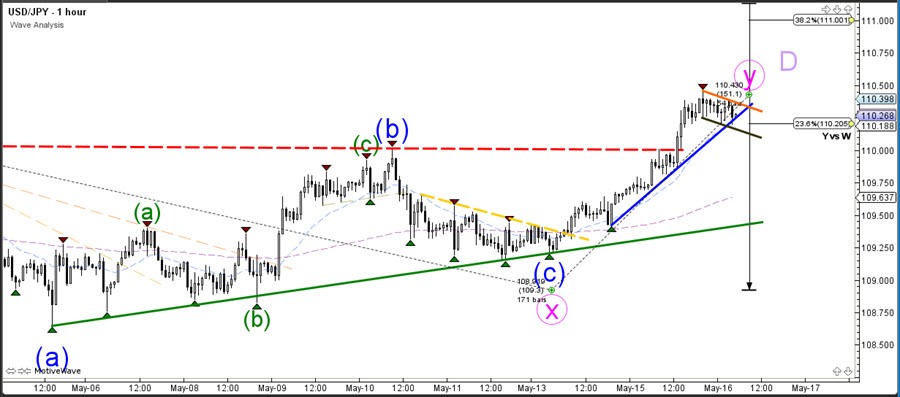
The USD/JPY is now building a bull flag chart pattern which could indicate a bullish continuation once price breaks above the pattern. Price can always retrace back down to retest the broken 110 resistance level which now could act as a potential support zone.