EUR/USD
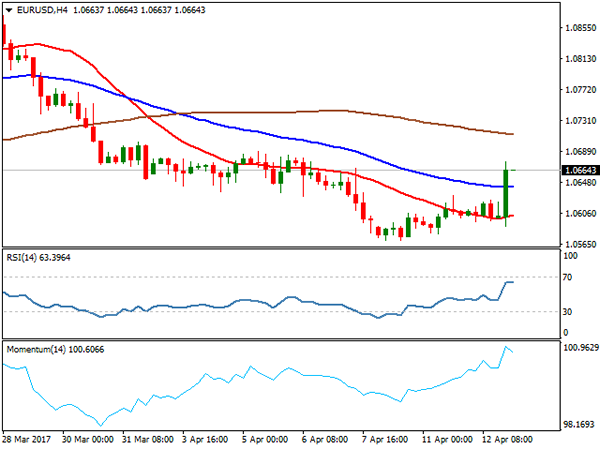
The EURUSD pair eventually broke above daily Ichimoku cloud and took out next strong barriers at 1.0622/66 (100 SMA / 55SMA), in late Wednesday’s strong bullish acceleration, triggered by comments fron President Trump about too strong dollar that sent the greenback sharply lower across the board.
The Euro enjoyed fresh support and emerged out of two-day congestion, hitting recovery high at 1.0675 near the end of the US session. Strong bullish close on Wednesday would improve pair’s near-term sentiment that was firmly bearish and signal stronger recovery.
Today’s strong bullish close generated positive signal for fresh acceleration higher for attack at pivotal 1.0700 barrier (Fibonacci 61.8% of 1.0906/1.0570 descend), break of which would confirm reversal.
However, daily studies are still weak and may keep the downside vulnerable if the pair fails to clear 1.0700 pivot. Broken 100 SMA marks key near-term support at 1.0623, loss of which will be bearish.
German, French and Italian inflation data will key releases from the Eurozone on Thursday, with forecasts showing mainly unchanged values in March.
Support: 1.0650, 1.0630, 1.0623, 1.0614
Resistance: 1.0675, 1.0700, 1.0715, 1.0738
USD/JPY
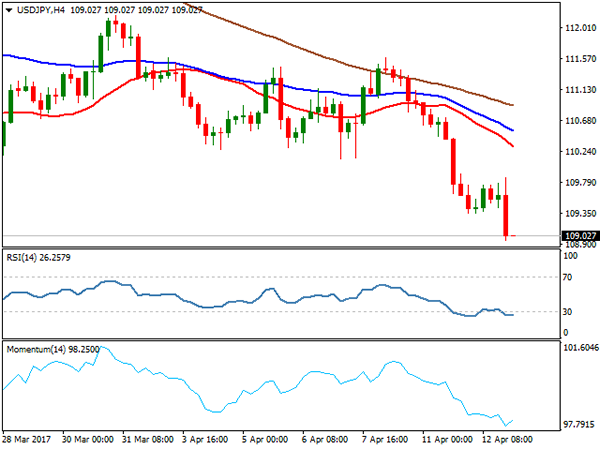
USD JPY slumped in late US session after comments from President Trump about too strong dollar. The pair accelerated strongly lower after consolidating previous day’s strong fall. Long bearish candle that was left on Tuesday, maintained strong bearish pressure, as yen remained supported by strong safe-haven buying amid growing geopolitical tensions.
The pair hit fresh nearly five-month low near 109.00 handle on Wednesday’s fresh bearish acceleration, on track for the second consecutive strong bearish daily close.Firmly bearish daily technical studies favour further weakness, as fundamentals are already working against the greenback. The pair is eyeing next target at 108.48 (Fibonacci 100% expansion of current wave C from 115.50), to validate wave principles and signal further weakness.
Former strong support at 110.00 that stayed intact on Wednesday, remains as key near-term barrier which should ideallycap corrective upticks, seen on daily RSI / Slow Stochastic entering oversold territory.
Support: 109.00, 108.48, 107.80, 106.73
Resistance: 109.86, 110.10, 110.59, 110.90
GBP/USD
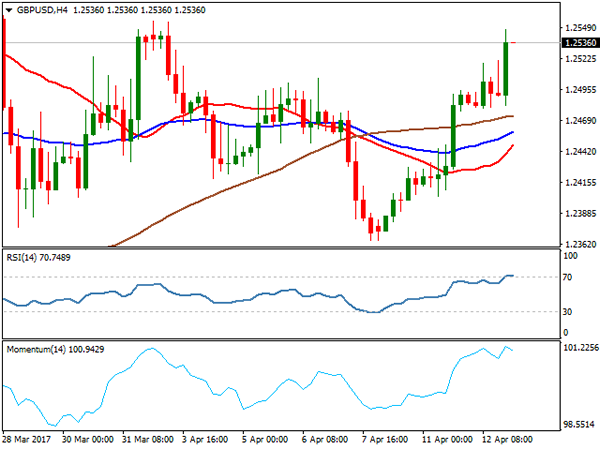
Cable maintained strong bullish sentiment of past two days on Wednesday and extended strong rally through pivotal barriers at 1.2500/05. Fresh bullish acceleration on comments from US President Trump that the US currency is too strong, smashed the greenback and e fresh support to sterling that also took out next significant barrier at 1.2520 (Fibonacci 61.8% of 1.2615/1.2365 pullback. The pair needs close above the latter for bullish signal for recovery extension. Fresh bullish acceleration is approaching another pivot at 1.2556 (Apr 03 high / Fibonacci 76.4% retracement) break of which will open way towards key near-term barrier at 1.2615 (Mar 27 high).
Cable received support from mixed UK labour data, released earlier today. UK Jobless claims unexpectedly rose to 25.5K vs forecasted -3.0K, but Average earnings beat the forecasts coming at 2.3% in March, vs 2.2% forecast.
Support: 1.2520, 1.2480, 1.2460, 1.2427
Resistance: 1.2543, 1.2555, 1.2613, 1.2631
AUDUSD
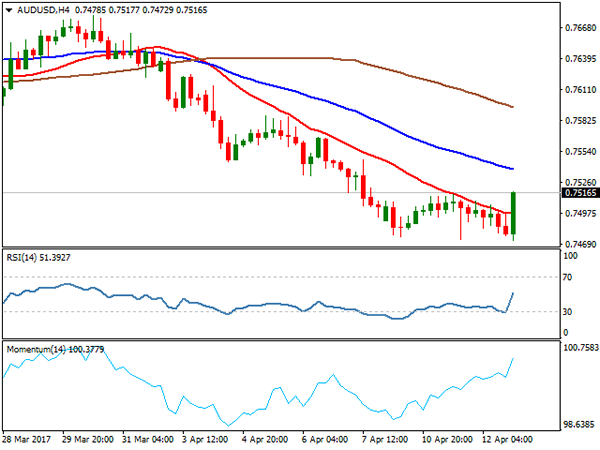
The Aussie dollar hasn’t changed significantly on Wednesday, remaining within tight consolidation range that is capped by sideways-moving 100SMA at 0.7514 that marks solid barrier and so far prevents stronger corrective action after broader downtrend from 0.7747 found support at 0.7473.
Initial signal of stronger recovery comes from daily slow stochastic that reversed from oversold territory, but initial requirement is firm break above 100SMA. Such scenario could anticipate fresh recovery and expose next pivotal barrier at 0.7550 (200SMA), break of which would confirm reversal and open way for stronger correction of 0.7747/0.7473 downleg.
Otherwise, prolonged consolidation would be likely near-term scenario, with risk shifted lower, as daily studies remain bearishly aligned.
Australian jobs data on Thursday are in focus, with strong forecast for new jobs at 20.0K in Mar, compared to -6.4K in Feb, while Unemployment rate is expected to stay unchanged at 5.9% in March.
Support: 0.7500, 0.7473, 0.7449, 0.7400
Resistance: 0.7514, 0.7550, 0.7576, 0.7611
GBPCAD
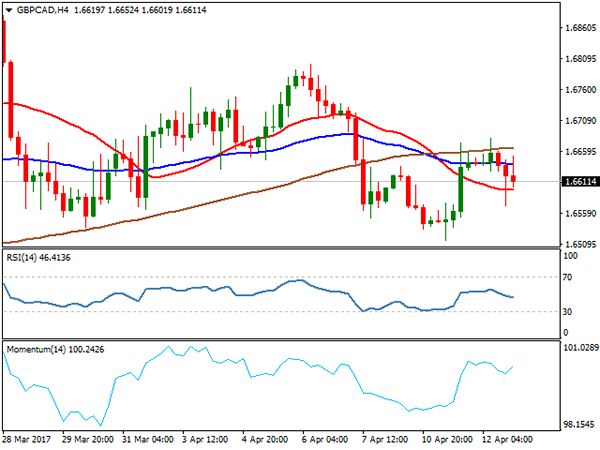
The GBPCAD cross showed no significant action on Wednesday and ended trading in Doji that signals indecision after strong rally on Tuesday. Recovery rally from 1.6515 low is struggling to clear 1.6657 barrier (50% of 1.6800/1.6515 downleg, following repeated false break above that was capped just under strong barrier at 1.6692 (200SMA).
Near-term price action is stuck between 100 and 200SMA’s and without clear direction.The notion is supported by mixed setup of daily MA’s and contradicting daily indicators. MACD is holding in the positive territory, while Momentum studies are negative and daily RSI is holding in neutrality zone.
Break of either congestion boundary, 200SMA at 1.6692 or 100SMA at 1.6493 is needed for firmer direction signal.
Break lower will complete daily Failure Swing pattern for deeper fall, while lift above 200SMA would signal false break below pivotal 1.6535 support (low of Mar 30) and open way for fresh recovery towards key barrier at 1.6800.
Support: 1.6571, 1.6535, 1.6515, 1.6493
Resistance: 1.6680, 1.6692, 1.6736, 1.6800
GOLD
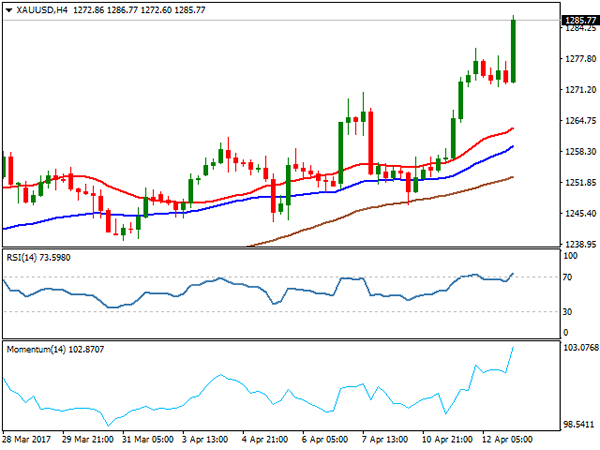
Spot Gold surged in late US session extending strong rally for the second day after US dollar slumped on comments from US President Donald Trump, who said that the US currency is getting too strong while geopolitical concerns continue to weigh on sentiment.
The yellow metal hit fresh five-month high at $1283, approaching its next target at $1286 (Fibonacci 76.4$ of $1337/$1122 descend. Gold is driven by rising geopolitical concerns that prompted investors to move from riskier assets into safe-haven gold.After Strong rally on Tuesday left long bullish daily candle that underpinned bullish action, gold price continued to rise and accelerated on the latest comments from President Trump. Strong bullish sentiment was boosted by fresh dollar’s weakness and could drive gold price through $1286 barrier towards targets at $1292 and psychological $1300 barrier in extension.
Firmly bullish technical studies remain supportive, however, overbought conditions on daily chart may pause rallies for consolidation.
Former tops at $1270/60 are expected to keep the downside protected.
Support: 1272, 1270, 1263, 1257
Resistance, 1283, 1286, 1292, 1300
WTI CRUDE OIL
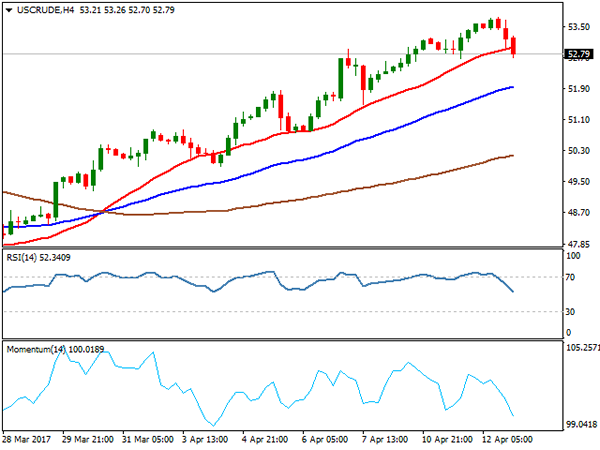
WTI oil ended trading in red on Wednesday for the first time after four straight days of gains that hit fresh five-week high at $53.74 per barrel. The oil price eased below $53.00 in late US session, extending pullback despite unexpected fall in US crude inventories. Energy Information Administration released its weekly report, showing fall of crude stocks by 2.2 million barrels in the week ended on Apr 7, compared to forecast for 87.000 barrels build.
Crude oil remains supported by rising tensions in Middle East and North Korea, also being supported by oil producers’ decision to extend output reduction for another six months and eyes key short-term barriers at $55.00 zone. Current easing is likely driven by technicals, as studies are overbought, as well as on profit-taking after four-day rally, near the end of holiday-shortened week.
Tuesday’s low, left after strong downside rejection at $52.68, marks initial support that stays intact for now, guarding hourly Ichimoku cloud base at $52.41 and broken Fibo 61.8% barrier at 51.97 which also act as significant supports.
Extended dips should find solid supports at $51.65/61 (converged 55/100 SMA), which are expected to contain and keep overall bullish structure intact.
Support: 52.79, 52.68, 51.97, 51.65
Resistance: 53.26, 53.74, 54.50, 55.00
DJIA
U.S. stocks ended lower on Wednesday as investors moved in safe-haven assets amid lingering geopolitical worries, but keeping the upcoming earnings season in sight. Investors remain concerned about the situation over Syria after US military attacked Syrian army base, with growing threats of escalation of conflict and further confrontation with Russia. Traders worry that these developments could distract president Trump from following his campaign promises in pro-business policies, such as tax cuts and higher infrastructure spending that drove Wall Street to its record highs since Trump’s election.
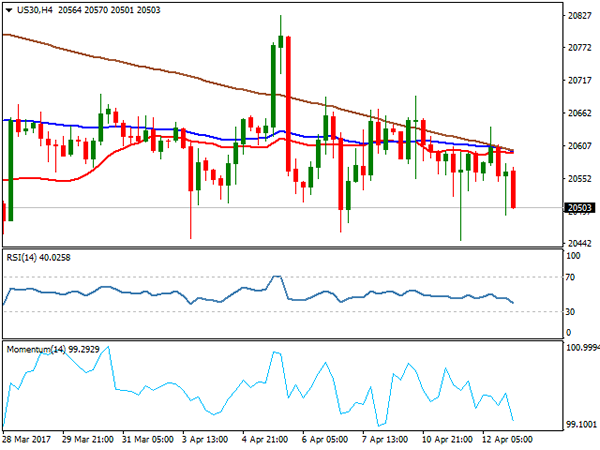
Dow Jones ended Wednesday’s trading in red and moved deeper into daily Ichimoku cloud, generating bearish signals after triple-Doji that signalled strong indecision during past few sessions.
Daily Tenkan-sen/Kijun-sen lines are in bearish setup and daily indicators entering negative territory, generating negative signal for attack at initial target at 20450 zone and extension towards key support at 20385 (daily Ichimoku cloud base, break of which could trigger further retracement of Jan/Mar 19713/21160 ascend.
Support: 20490,20450, 20385, 20266
Resistance: 20607, 20637, 20682, 20692
FTSE 100
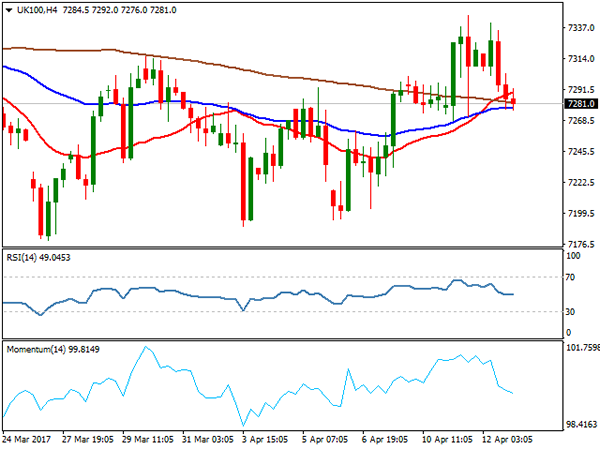
FTSE index ended in red on Wednesday, after repeated rejection at key 7343 resistance (Fibonacci 61.8% of pullback from record high at 7444 to 7179 (Mar 27 low). Subsequent easing returned below broken Kijun-sen line (7311) and softened near-term structure, as hourly indicators moved into negative territory. Weakness from 7343 managed to find footstep at daily 20SMA 7285 that guards lower trigger at 7268 (daily Tenkan-sen), break below which would further weaken near-term picture and risk return to key near-term support at 7240 (top of rising daily Ichimoku cloud.
Daily technical indicators are holding in neutral zone and lacking clearer signals for now, however, bullish bias would remain in play while the price holds above rising daily cloud.
UK stocks ended lower on Wednesday after gains from financial and industrial sector were offset by losses in Tesco shares that dropped 4.6% on Wednesday, making blue-chip FTSE 100 index to close the day 0.45% down.
Support: 7268, 7240, 7222, 7195
Resistance: 7311, 7343, 7381, 7400
DAX
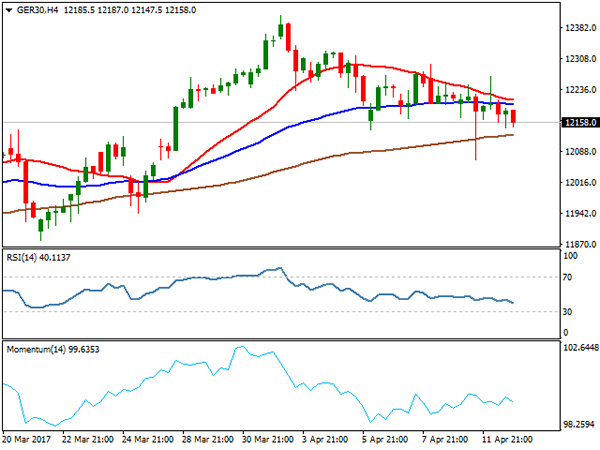
DAX ticked slightly above Tuesday’s high today, but remained in red at the end of the day and stayed directionless for the second consecutive day. The price held between daily Tenkan-sen and Kijun-sen line (12240/12141 respectively, after repeated attack at key support at 12141, also Apr 06 low. Mixed signals from daily technical studies are lacking clearer direction signals, after Tuesday’s long-legged daily Doji candle.The top performers of DAX index on Wednesday were Henkel (up 1.32%), Adidas (up 0.94%) and BMW which ended session up 0.90%.
On the other side, the worst performers were Thyssenkrupp (down 1.89%), Deutsche Boerse (down 1.08%) and Heidelbergcement (down 1.03%).
Rising stocks were 412 while 306 declined and 25 remained unchanged, with overall result keeping the index without stronger moves on Wednesday.
Rising daily 20SMA contained today’s dips and continues to underpin, with key support at 12144, clear break of which would generate stronger bearish signal.
The upper pivot is at 12240 (Tenkan-sen) with lift above 12300 zone (Apr 10 high) needed to trigger stronger recovery.
Support: 12141, 12069, 12000, 11943
Resistance: 12199, 12240, 12267, 12296