
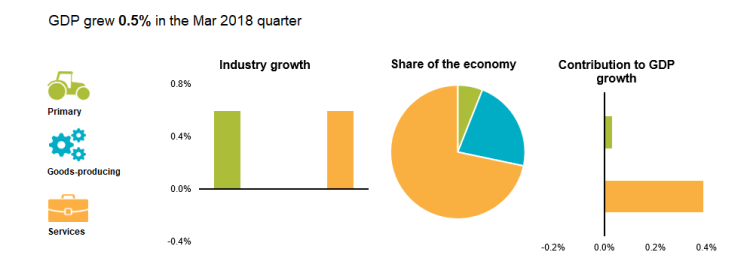
New Zealand GDP grew 0.5% qoq in the March quarter, slowed from 0.6% qoq in the prior quarter and met expectation. Over the year, GDP grew 2.7% ended March 2018. Per capita GDP was unchanged, down from 0.1% qoq rise in the prior quarter. Services industries grew 0.6%, notably slowed from prior 1.1%. Good-producing industries were flat as jump in manufacturing was offset by fall in constructions. Primary industries rebounded by growing 0.6%, up from prior quarter’s -2.6%.
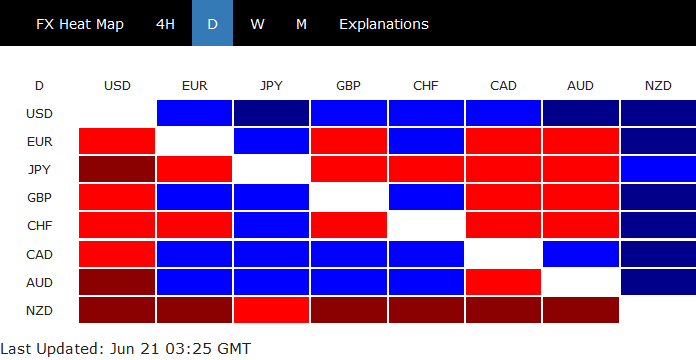
New Zealand Dollar remains pressured after GDP data and is extending the recent broad based decline. It’s trading as the weakest for today and for the week.
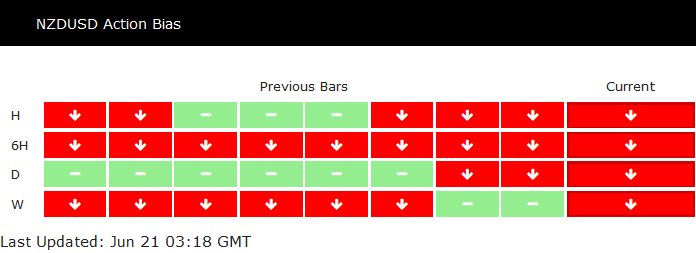
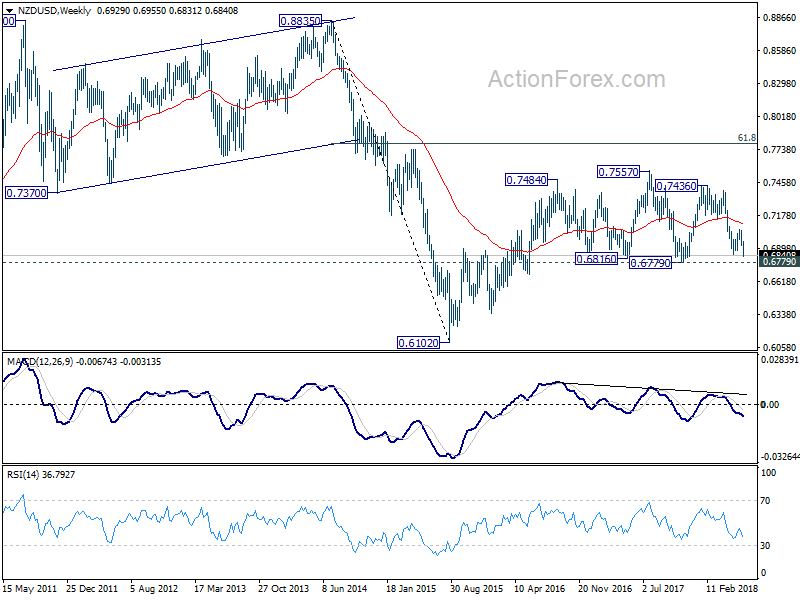
NZD/USD breaks May’s low at 0.6850 to resume recent down trend from 0.7436. NZD/USD action bias table and the D action bias chart show that the down trend is picking up downside momentum again.
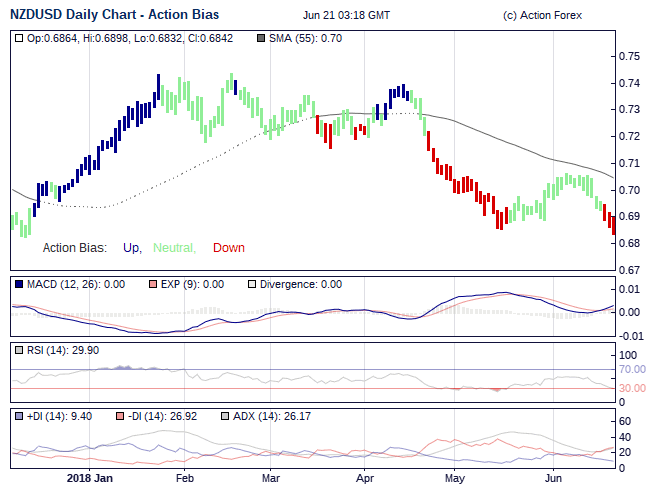
Nonetheless, we’d like to point out that 0.6779 (2017 low) is a key support level decisive break there will confirm completion of the corrective rise from 2015 low at 0.6102. And that will very likely resume the long term down trend from 2014 high at 0.8835, through 0.6102. So for quick trading, selling NZD/USD is the strategy for sure. But one has to be alerted as it touches 0.6779. For position trading, we’d prefer to see if 0.6779 would be taken out firmly first.


