
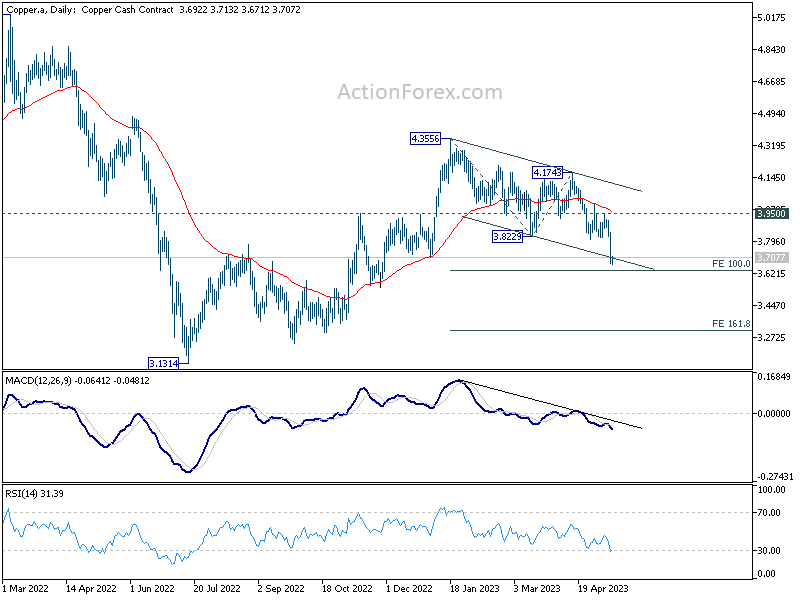
Copper prices experienced a precipitous drop this week, puncturing 3.8229 support level and reaching a nadir last seen in November. This sell-off was largely catalyzed by a stark contraction in Chinese import data, which plummeted by -7.9% yoy in April. Specifically, copper imports in the first four months lagged -13% behind 2022’s pace.
This downward trend was exacerbated by release of China’s CPI data, which showed a meager 0.1% yoy rise in April – the lowest since February 2021. Additionally, China’s PPI took a nosedive by -3.6%, marking the steepest descent since May 2020.
These data, combined with recent PMI figures indicating a contraction in manufacturing in April, paint a picture of a modest post-lockdown rebound at best, with risks skewed to the downside.
From a technical perspective, resumption of fall from 4.3556 puts immediate focus on 100% projection of 4.3556 to 3.8229 from 4.1743 at 3.6416. Should this level provide strong support and instigate a rebound through 3.950 resistance level, there’s potential for a bullish resurgence leading to another rise above 4.3556. This would likely resume the whole rebound from 3.1314.
However, sustained break of 3.6416 could prompt downside acceleration towards 161.8% projection at 1.3124. It’s premature to anticipate resumption of the whole fall from 5.0332. Decline from 4.3556 might just be the second leg of the pattern from 3.1314, even in a bearish scenario. But that would depend on the downside momentum of the move.
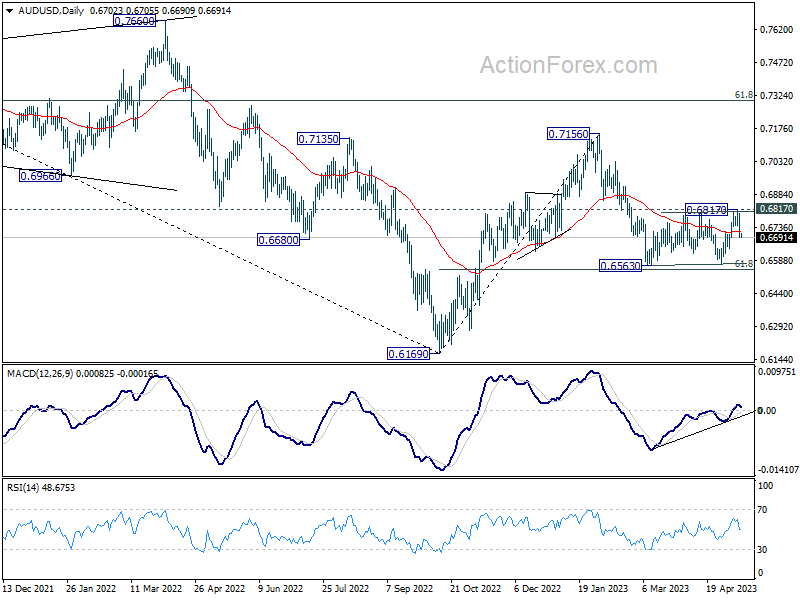
Furthermore, should the bearish Copper scenario materialize with a firm break of 3.6416 Fibonacci projection, AUD/USD could be dragged down through 0.6563 support level, thereby resuming the overall decline from 0.7156.


