
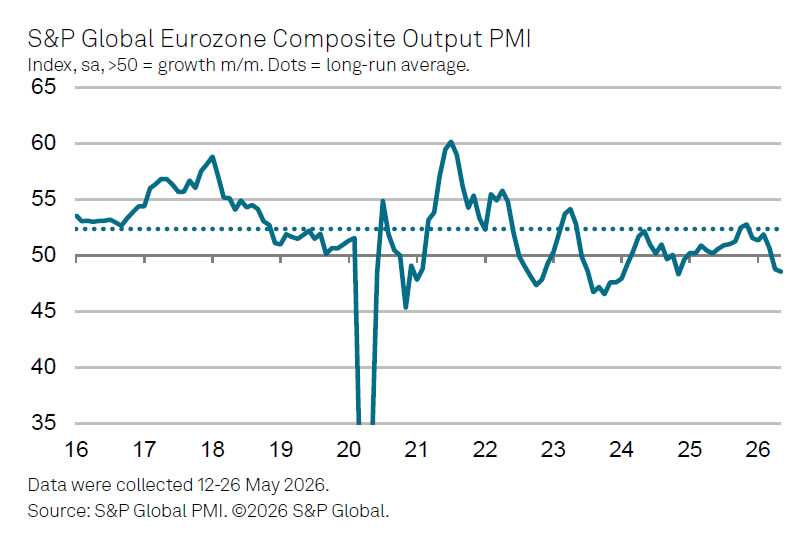
Eurozone business activity deteriorated further in May, adding to concerns that the region could slip into contraction in the second quarter. The final Composite PMI Output Index fell from 48.8 to 48.5, its lowest level in 18 months. PMI Services edged up slightly from 47.6 to 47.7. Although the services reading improved marginally, both indicators remained firmly below the 50 threshold that separates expansion from contraction.
According to S&P Global’s Chris Williamson, the latest survey data point to a worsening growth outlook. He said the PMI figures are consistent with a -0.2% quarterly decline in GDP unless activity improves significantly in June. At the same time, inflation pressures are moving in the opposite direction. Williamson warned that price pressures have intensified to their most concerning levels in more than three years, with inflation potentially running close to 4% in the coming months.
The combination leaves the ECB facing an increasingly uncomfortable policy dilemma. On one hand, rising inflation and recent upside surprises in core CPI strengthen the case for next week’s widely expected rate hike. On the other, weakening business activity suggests the economy is already losing momentum. Williamson argued that one rate increase could be viewed as an “insurance policy” against inflation becoming entrenched, but warned that the case for additional tightening will become harder to justify if demand continues to weaken.
| Indicator | April | May | Notes |
|---|---|---|---|
| PMI Composite | 48.8 | 48.5 | 18-month low |
| PMI Services | 47.6 | 47.7 | 2-month high |
| GDP Signal (Q2) | -0.2% | PMI-implied estimate | |
| Inflation Signal | Near 4% | PMI price indicators |


