
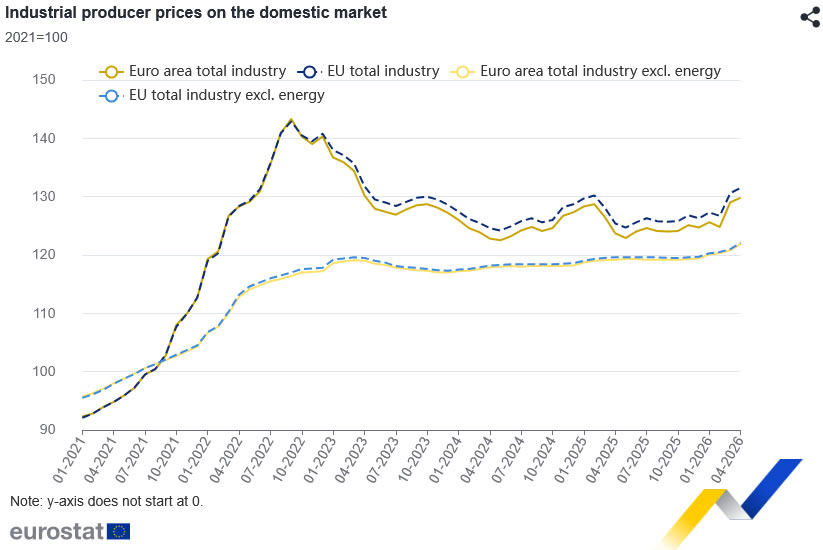
Eurozone producer prices rose more than expected in April, adding to evidence that inflation pressures are continuing to build beneath the surface of the economy. Producer Price Index increased 0.6% mom, above expectations of 0.4% mom. Annual producer inflation accelerated sharply from 2.0% yoy to 4.9% yoy, slightly above forecasts of 4.8% yoy. The figures come just a day after stronger-than-expected Eurozone inflation data reinforced expectations for an ECB rate hike next week.
The details suggest inflationary pressures are becoming increasingly broad-based in Eurozone. Intermediate goods prices rose 1.8% mom on the month, indicating higher costs are continuing to move through supply chains. Capital goods and durable consumer goods prices both increased 0.3%, while non-durable consumer goods prices were unchanged. Energy prices actually fell -0.4% during the month, implying that the acceleration in producer inflation was not solely driven by energy costs.
Across the European Union, producer prices rose 0.7% mom and 4.9% yoy. Denmark, Croatia, and Belgium recorded the largest monthly increases, while France, Estonia, and Sweden saw declines.
| Indicator | March | April | Expectation |
|---|---|---|---|
| Eurozone PPI M/M | 3.4% | 0.6% | 0.4% |
| Eurozone PPI Y/Y | 2.0% | 4.9% | 4.8% |
| EU PPI M/M | 0.7% | ||
| EU PPI Y/Y | 4.9% |
Eurozone PPI Components (M/M)
| Component | April |
|---|---|
| Intermediate Goods | +1.8% |
| Capital Goods | +0.3% |
| Durable Consumer Goods | +0.3% |
| Non-Durable Consumer Goods | 0.0% |
| Energy | -0.4% |
Largest Monthly Changes by Country
| Country | PPI M/M |
|---|---|
| Denmark | +3.0% |
| Croatia | +2.7% |
| Belgium | +2.4% |
Largest Monthly Declines by Country
| Country | PPI M/M |
|---|---|
| France | -2.1% |
| Estonia | -0.8% |
| Sweden | -0.3% |


