
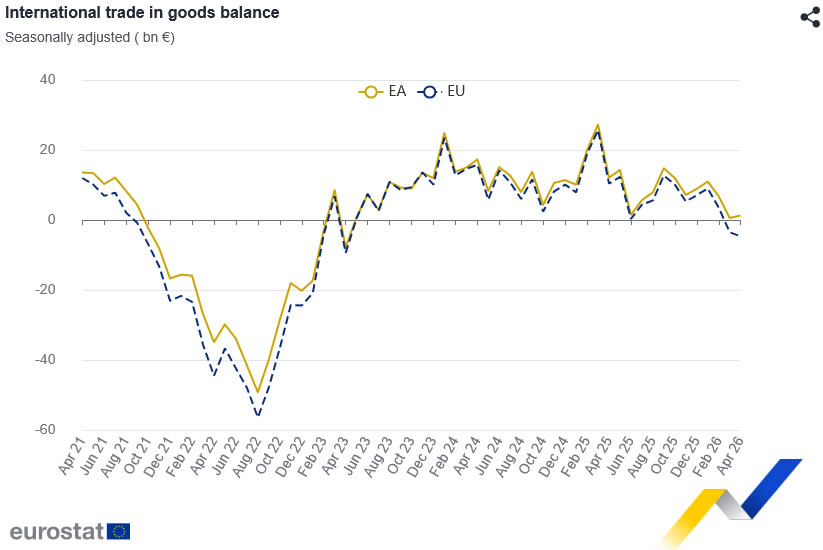
The Eurozone recorded a EUR 1.0bn deficit in goods trade with the rest of the world in April, a sharp deterioration from the EUR 8.7bn surplus recorded a year earlier. While exports continued to grow, stronger import demand more than offset the gains, highlighting the impact of rising external purchases on the region’s trade position.
Exports rose 5.0% yoy to EUR 255.4bn, up from EUR 243.3bn in April 2025. However, imports increased at a much faster pace of 9.3% yoy to EUR 256.4bn, compared with EUR 234.6bn a year earlier.
The broader European Union showed a similar pattern, with its trade balance shifting from a EUR 7.3bn surplus to a EUR 7.1bn deficit as imports surged 10.1% yoy while exports rose 3.2% yoy.
The geographical breakdown revealed notable divergences among major trading partners of the EU. Exports to the United States fell -12.7% yoy, reducing the EU’s trade surplus with its largest export market to EUR 9.9bn from EUR 17.1bn a year earlier. Meanwhile, exports to Switzerland rose 18.0% and shipments to the United Kingdom increased 7.8%.
On the import side, purchases from Taiwan surged 47.2%, while imports from Norway jumped 30.0%, contributing to wider trade deficits with both economies. The data suggest that strong import growth, rather than weak exports, was the primary driver behind the deterioration in the Eurozone’s trade balance.
Eurozone Trade in Goods (April 2026)
| Indicator | Apr |
|---|---|
| Trade Balance | EUR -1.0bn |
| Exports | +5.0% Y/Y |
| Imports | +9.3% Y/Y |
European Union Trade in Goods (April 2026)
| Indicator | Apr 2026 |
|---|---|
| Trade Balance | EUR -7.1bn |
| Exports | +3.2% Y/Y |
| Imports | +10.1% Y/Y |
Major Trading Partners (EU Trade)
| Partner | Export Y/Y | Import Y/Y | Trade Balance (EUR bn) |
|---|---|---|---|
| United States | -12.7% | +3.9% | +9.9 |
| China | +1.8% | +7.1% | -31.9 |
| United Kingdom | +7.8% | +7.6% | +16.0 |
| Switzerland | +18.0% | +4.2% | +8.2 |
| Norway | +12.8% | +30.0% | -4.9 |
| India | +11.5% | -6.9% | -1.2 |
| Taiwan | -0.5% | +47.2% | -2.8 |
Full Eurozone and EU trade balance release here.


