
Sample Category Title
Aussie Dollar Trading On A Weaker Footing This Morning
For the 24 hours to 23:00 GMT, the AUD rose 0.07% against the USD and closed at 0.8053 on Friday.
LME Copper prices declined 0.9% or $62.5/MT to $6780.0/MT. Aluminium prices declined 0.1% or $3.0/MT to $2072.0/MT.
Over the weekend, data indicated that in China, Australia's largest trading partner, the consumer price index (CPI) advanced to a seven-month high of 1.8% YoY in August, more than market expectations for a rise of 1.6%. In the prior month, the CPI had advanced 1.4%. Moreover, the nation's producer price index (PPI) climbed more-than-anticipated by 6.3% in August, jumping to a four-month high and following a gain of 5.5% in the preceding month. Markets had anticipated the PPI to increase 5.6%.
In the Asian session, at GMT0300, the pair is trading at 0.8048, with the AUD trading 0.06% lower against the USD from Friday's close.
The pair is expected to find support at 0.8012, and a fall through could take it to the next support level of 0.7977. The pair is expected to find its first resistance at 0.8104, and a rise through could take it to the next resistance level of 0.8161.
Going ahead, market participants will closely monitor Australia's NAB business confidence index for August, due to release in the early hours of tomorrow.
The currency pair is trading below its 20 Hr moving average and showing convergence with its 50 Hr moving average.

German Trade Surplus Narrowed In July
For the 24 hours to 23:00 GMT, the EUR rose 0.08% against the USD and closed at 1.2032 on Friday.
In economic news, Germany’s seasonally adjusted trade surplus narrowed more-than-expected to a level of €19.5 billion in July, as growth in imports outstripped that of exports. The nation had registered a trade surplus of €22.3 billion in the prior month, while market participants were expecting the country’s surplus to narrow to a level of €21.0 billion.
In the US, data indicated that consumer credit increased more-than-expected by $18.5 billion in July, after rising by a revised $11.8 billion in June and compared to market expectations for a rise of $15.0 billion. Further, the nation’s seasonally adjusted final wholesale inventories grew more than initially estimated by 0.6% in July, compared to a flash print indicating a rise of 0.4%. Wholesale inventories had registered a revised similar rise in the previous month.
In the Asian session, at GMT0300, the pair is trading at 1.2018, with the EUR trading 0.12% lower against the USD from Friday’s close.
The pair is expected to find support at 1.1981, and a fall through could take it to the next support level of 1.1943. The pair is expected to find its first resistance at 1.2074, and a rise through could take it to the next resistance level of 1.2129.
With no macroeconomic releases in the Euro-zone today, investor sentiment will be governed by global macroeconomic factors.
The currency pair is trading below its 20 Hr moving average and showing convergence with its 50 Hr moving average

UK’s Manufacturing Production Rebounded For The First Time This Year In July
For the 24 hours to 23:00 GMT, the GBP rose 0.79% against the USD and closed at 1.3200 on Friday, following upbeat economic data from the UK.
Macroeconomic data revealed that Britain's manufacturing production rebounded more-than-expected by 0.5% on a monthly basis in July, rising for the first time in seven months, suggesting that an upturn in the industrial sector was on the cards. Investors had envisaged manufacturing production to rise by 0.3%, after posting a flat reading in the prior month. Moreover, the nation's industrial production climbed 0.2% MoM in July, meeting market consensus and following a gain of 0.5% in the previous month. On the other hand, the nation's construction output fell 0.9% on a monthly basis in July, dipping to its lowest in three months and compared to a drop of 0.1% in the prior month.
Other economic data revealed that UK's total trade deficit surprisingly dropped to a level of £2.87 billion in July, defying market expectations for the nation's deficit to widen to a level of £3.25 billion and following a revised deficit of £2.91 billion in the previous month. Further, NIESR estimated that the nation's gross domestic product (GDP) climbed 0.4% in the three months ended August, compared to a rise of 0.2% predicted in the three months to July.
In the Asian session, at GMT0300, the pair is trading at 1.3183, with the GBP trading 0.13% lower against the USD from Friday's close.
The pair is expected to find support at 1.3115, and a fall through could take it to the next support level of 1.3046. The pair is expected to find its first resistance at 1.3238, and a rise through could take it to the next resistance level of 1.3292.
In absence of any macroeconomic releases in the UK today, investors will look forward to global macroeconomic news for further direction.
The currency pair is showing convergence with its 20 Hr moving average and trading above its 50 Hr moving average.

Japan’s Machinery Orders Sharply Rebounded In July
For the 24 hours to 23:00 GMT, the USD declined 0.55% against the JPY and closed at 107.77 on Friday.
In the Asian session, at GMT0300, the pair is trading at 108.39, with the USD trading 0.58% higher against the USD from Friday's close.
Overnight data indicated that Japan's machinery orders rebounded by 8.0% MoM in July, surpassing market expectations for an advance of 4.2%. In the prior month, machinery orders had recorded a drop of 1.9%.
Earlier today, data revealed that the nation's tertiary industry index rebounded 0.1% in July, in line with market expectations. The index had dropped by a revised 0.2% in the previous month.
The pair is expected to find support at 107.62, and a fall through could take it to the next support level of 106.85. The pair is expected to find its first resistance at 108.86, and a rise through could take it to the next resistance level of 109.33.
Moving forward, traders will eye Japan's flash machine tool orders for August, scheduled to release in a while.
The currency pair is trading above its 20 Hr moving average and showing convergence with its 50 Hr moving average.

Switzerland’s Unemployment Rate Remained Steady In August
For the 24 hours to 23:00 GMT, the USD declined 0.55% against the CHF and closed at 0.9450 on Friday.
On the macro front, Switzerland's seasonally adjusted unemployment rate remained unchanged at 3.2% in August, meeting market expectations.
In the Asian session, at GMT0300, the pair is trading at 0.9490, with the USD trading 0.42% higher against the CHF from Friday's close.
The pair is expected to find support at 0.9439, and a fall through could take it to the next support level of 0.9387. The pair is expected to find its first resistance at 0.9524, and a rise through could take it to the next resistance level of 0.9557.
The currency pair is trading above its 20 Hr moving average and showing convergence with its 50 Hr moving average.

Canadian Unemployment Rate Dipped To A 9-Year Low In August
For the 24 hours to 23:00 GMT, the USD rose 0.26% against the CAD and closed at 1.2146 on Friday.
Macroeconomic data showed that Canada's unemployment rate unexpectedly fell to 6.2% in August, hitting a nine-year low level and adding to the narrative of a strengthening economy. Meanwhile, investors had envisaged for the unemployment rate to remain unchanged at 6.3%.
In the Asian session, at GMT0300, the pair is trading at 1.2140, with the USD trading a tad lower against the CAD from Friday's close.
The pair is expected to find support at 1.2080, and a fall through could take it to the next support level of 1.2019. The pair is expected to find its first resistance at 1.2183, and a rise through could take it to the next resistance level of 1.2225.
Ahead in the day, investors will focus on Canada's housing starts data for August.
The currency pair is showing convergence with its 20 Hr and 50 Hr moving averages.

Daily Technical Analysis: EUR/USD Retesting 1.20 Support In Key Decision Zone
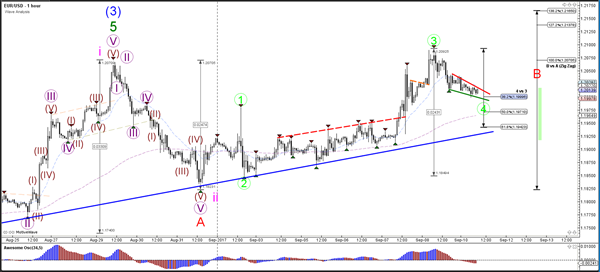
Currency pair EUR/USD
The EUR/USD challenged the previous top (red) but till now has been unable to break above that resistance. A bullish break could be part of a potential wave 3 (pink) whereas a failure to break above the 138.2% Fib of wave B vs A at 1.2165 could still indicate a wave B (red).
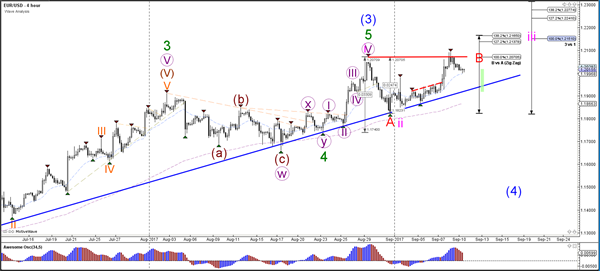
The EUR/USD invalidates wave 4 (green) with a potential break below the 61.8% Fib of wave 4 vs 3 and the support trend line (blue), which could indicate a larger ABC (red) correction. A break above the resistance trend line (red) could start a wave 5. Price is now at the 38.2% Fib at 1.20.
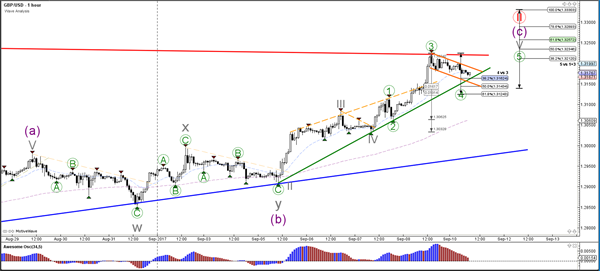
Currency pair GBP/USD
The GBP/USD is challenging a deep 88.6% resistance Fibonacci retracement level of wave 2 vs 1 (red). A break above the 100% Fib level invalidates that wave 2 (red). Price could either be in an ABC (purple) correction or in a wave 123.
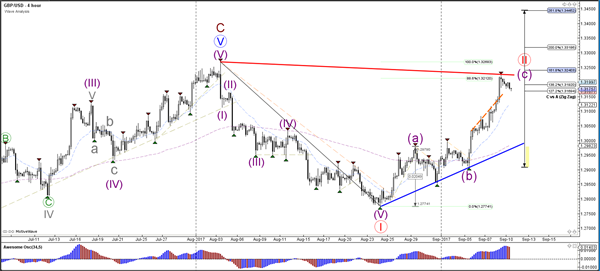
The GBP/USD is testing an important resistance trend line (red).
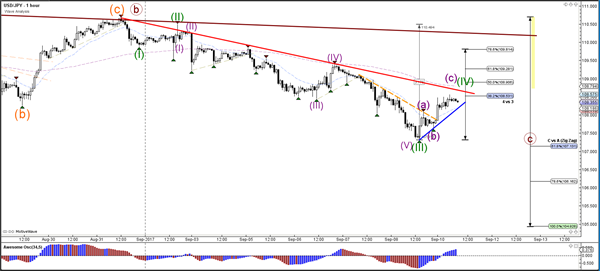
Currency pair USD/JPY
The USD/JPY broke below the support zone (dotted greens) and could now be making a pullback towards the resistance (red).
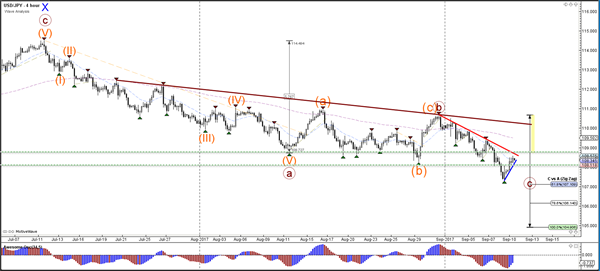
The USD/JPY could be making a pullback towards the Fibonacci levels of wave 4 (green).
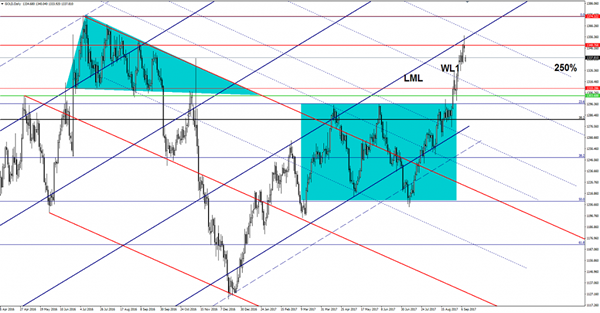
Gold Registered An Amazing Drop
The yellow metal dropped aggressively today and reached the $1333 per barrel again. Has opened with a gap down and now is trying to recover after the immense drop. The failure to close above the lower median line (lml) or on this line has signaled that a corrective phase is favored in the upcoming period.
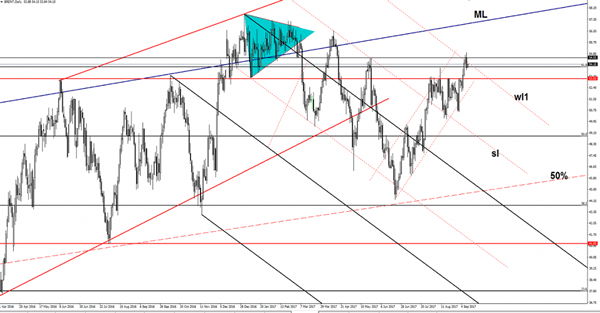
Brent Oil False Breakout?
Price has plunged on Friday and has invalidated the breakout above the first warning line (wl1) of the major descending pitchfork. We’ll see what will happen because right now is retesting the 61.8% retracement level. I’ve said in the previous days that only a valid breakout above the warning line (wl1) will confirm a further increase towards the $57 per barrel.
EUR/USD Losing Momentum
Price changed little in the early morning, has opened with a gap down and seems too overbought to resume the upside movement. Is trading in the red right now and could hit new lows in the upcoming days if the USDX will really start another leg higher after the massive drop.
EUR/USD is trading above the 1.2010 level and stays in the green area, but the bulls seem exhausted. We’ll see what will happen in the upcoming days because we still need a confirmation that the rate will start another leg lower.
We have a poor economic calendar, so the rate will be driven by the technical factors today. Price shows some exhaustion signs, but as I’ve said, is premature to talk about a broader corrective phase.
Price is facing tough resistance on the Daily chart, you can see that has found strong resistance right above the 1.2041 static resistance and above the outside sliding line (sl) of the minor ascending pitchfork. EUR/USD failed to close above these levels and above the 50% Fibonacci line (ascending dotted line) and now should retest the upper median line (uml) of the minor ascending pitchfork.
I’ve said in the previous weeks that the rate will come back to retest the mention levels after the false breakdown below the median line (ml) of the minor descending pitchfork. Could drop again if stays within the descending pitchfork’s body, you can see that has retested the upper median line (uml), a breakdown below the upper median line (uml) of the minor ascending pitchfork will confirm a further drop.
