
Sample Category Title
USD/CHF Mid-Day Outlook
Daily Pivots: (S1) 0.8907; (P) 0.8927; (R1) 0.8947; More…
Intraday bias in USD/CHF remains mildly on the upside at this point. Decisive break of 0.8956 resistance will confirm resumption of whole rally from 0.8374. Next target is 61.8% projection of 0.8374 to 0.8956 from 0.8735 at 0.9095. On the downside, below 0.8866 minor support will delay the bullish case and bring more consolidations first.
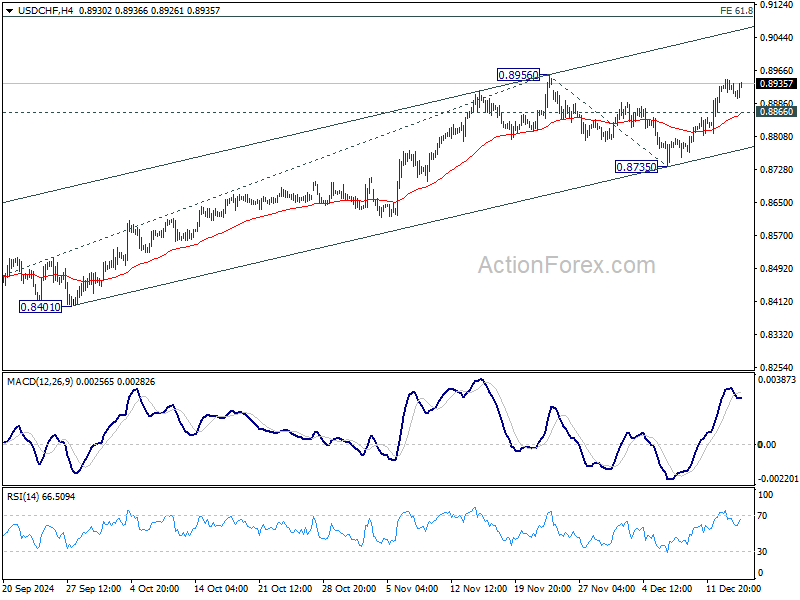
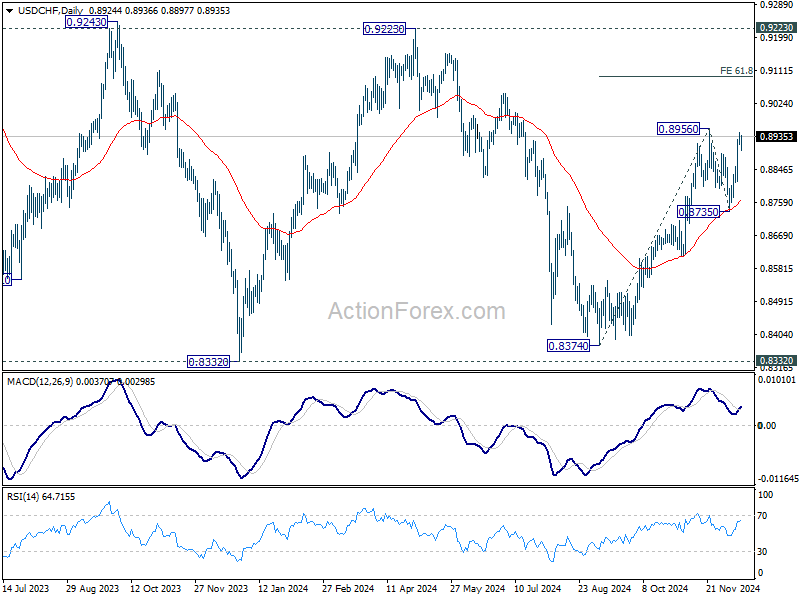
In the bigger picture, price actions from 0.8332 (2023 low) are currently seen as a medium term corrective pattern, with rise from 0.8374 as the third leg. Overall outlook will continue to stay bearish as long as 0.9223 resistance holds. Break of 0.8332 low is in favor at a later stage when the consolidation completes.
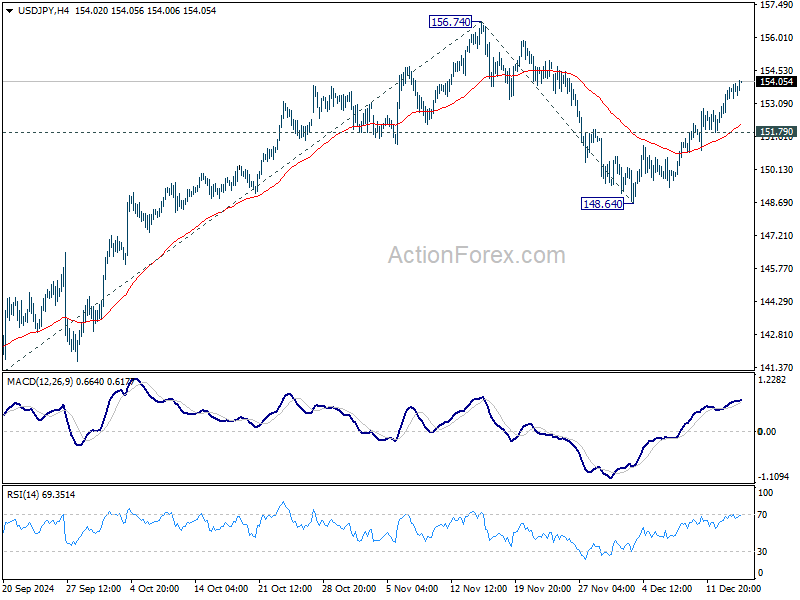
USD/JPY Mid-Day Outlook
Daily Pivots: (S1) 152.80; (P) 153.30; (R1) 154.14; More...
Intraday bias in USD/JPY remains on the upside as rebound from 148.64 is in progress. Further rally should be seen to retest 156.74 first. Firm break there will resume whole rally from 139.57, and target 61.8% projection of 139.57 to 156.74 from 148.64 at 159.25 next. On the downside, below 151.79 minor support will turn intraday bias neutral. But risk will stay on the upside as long as 148.64 support holds, in case of retreat.
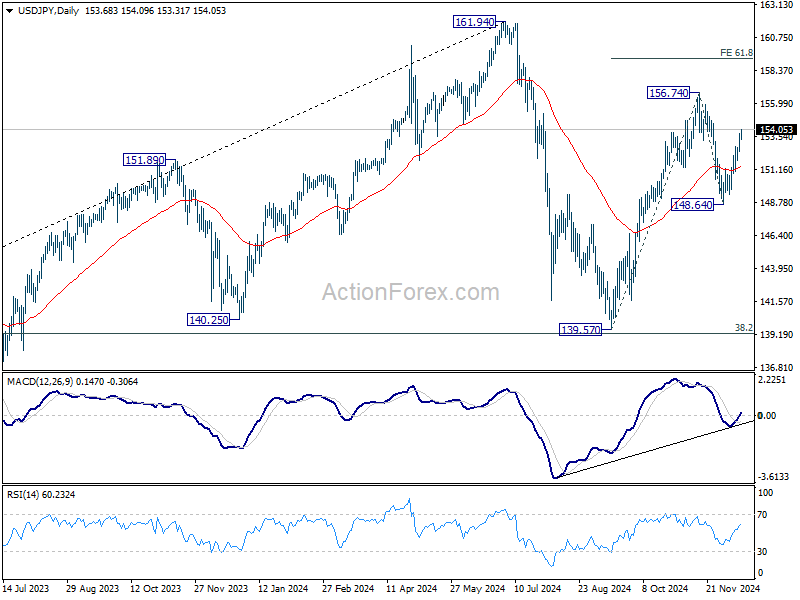
In the bigger picture, price actions from 161.94 are seen as a corrective pattern to rise from 102.58 (2021 low). The range of medium term consolidation should be set between 38.2% retracement of 102.58 to 161.94 at 139.26 and 161.94. Nevertheless, sustained break of 139.26 would open up deeper medium term decline to 61.8% retracement at 125.25.
Yen Under Pressure on BoJ Expectations; Bitcoin Soars on Trump’s Bold Crypto Vision
Yen weakened across the board today in an otherwise consolidative market , as traders increasingly anticipate that BoJ will hold steady on monetary policy at its upcoming this week. BoJ policymakers appear to see no urgency in extending the tightening cycle this month, preferring instead to wait for January’s updated economic projections before deciding on further hikes. This cautious approach reflects both near-term and structural challenges, including uncertainty over domestic wage growth and shifts in US trade policies under the incoming administration.
A critical issue for Japan’s inflation outlook is whether wage increases can extend beyond large corporations to smaller and medium-sized enterprises. While Rengo, the country’s largest labor federation, has set a lofty target of at least 6% wage hikes for SMEs in 2025, early indications suggest businesses in this segment are hesitant to commit to such significant increases, due to their own challenges including surging import prices. Without broader wage gains, domestic demand may struggle to expand sufficiently, limiting the sustainability of inflation at BoJ's 2% target. This would complicate any sustained policy normalization and could keep the central bank cautious well into next year.
In the broader currency markets, British Pound is the day’s strongest performer so far, supported by UK PMI data. While, the underlying economic outlook for the UK remains fragile, resurgence of inflationary pressures is expected to keep the BoE on track for up to four rate cuts next year, at most. New Zealand Dollar follows as the second strongest, underpinned by a robust improvement in services sector data, while Dollar rounds out the top three. On the other hand, Swiss Franc and Canadian Dollar are among the weakest currencies alongside Yen, while Euro and Australian Dollar are mixed in the middle.
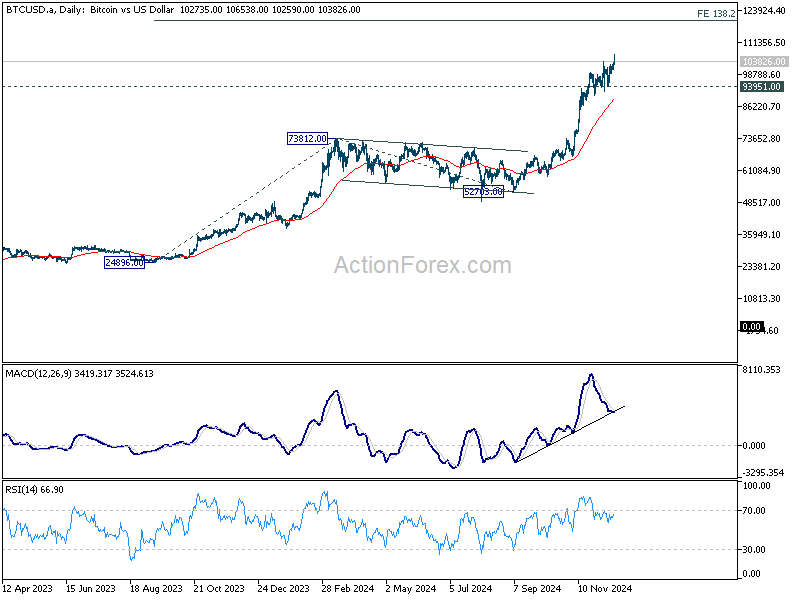
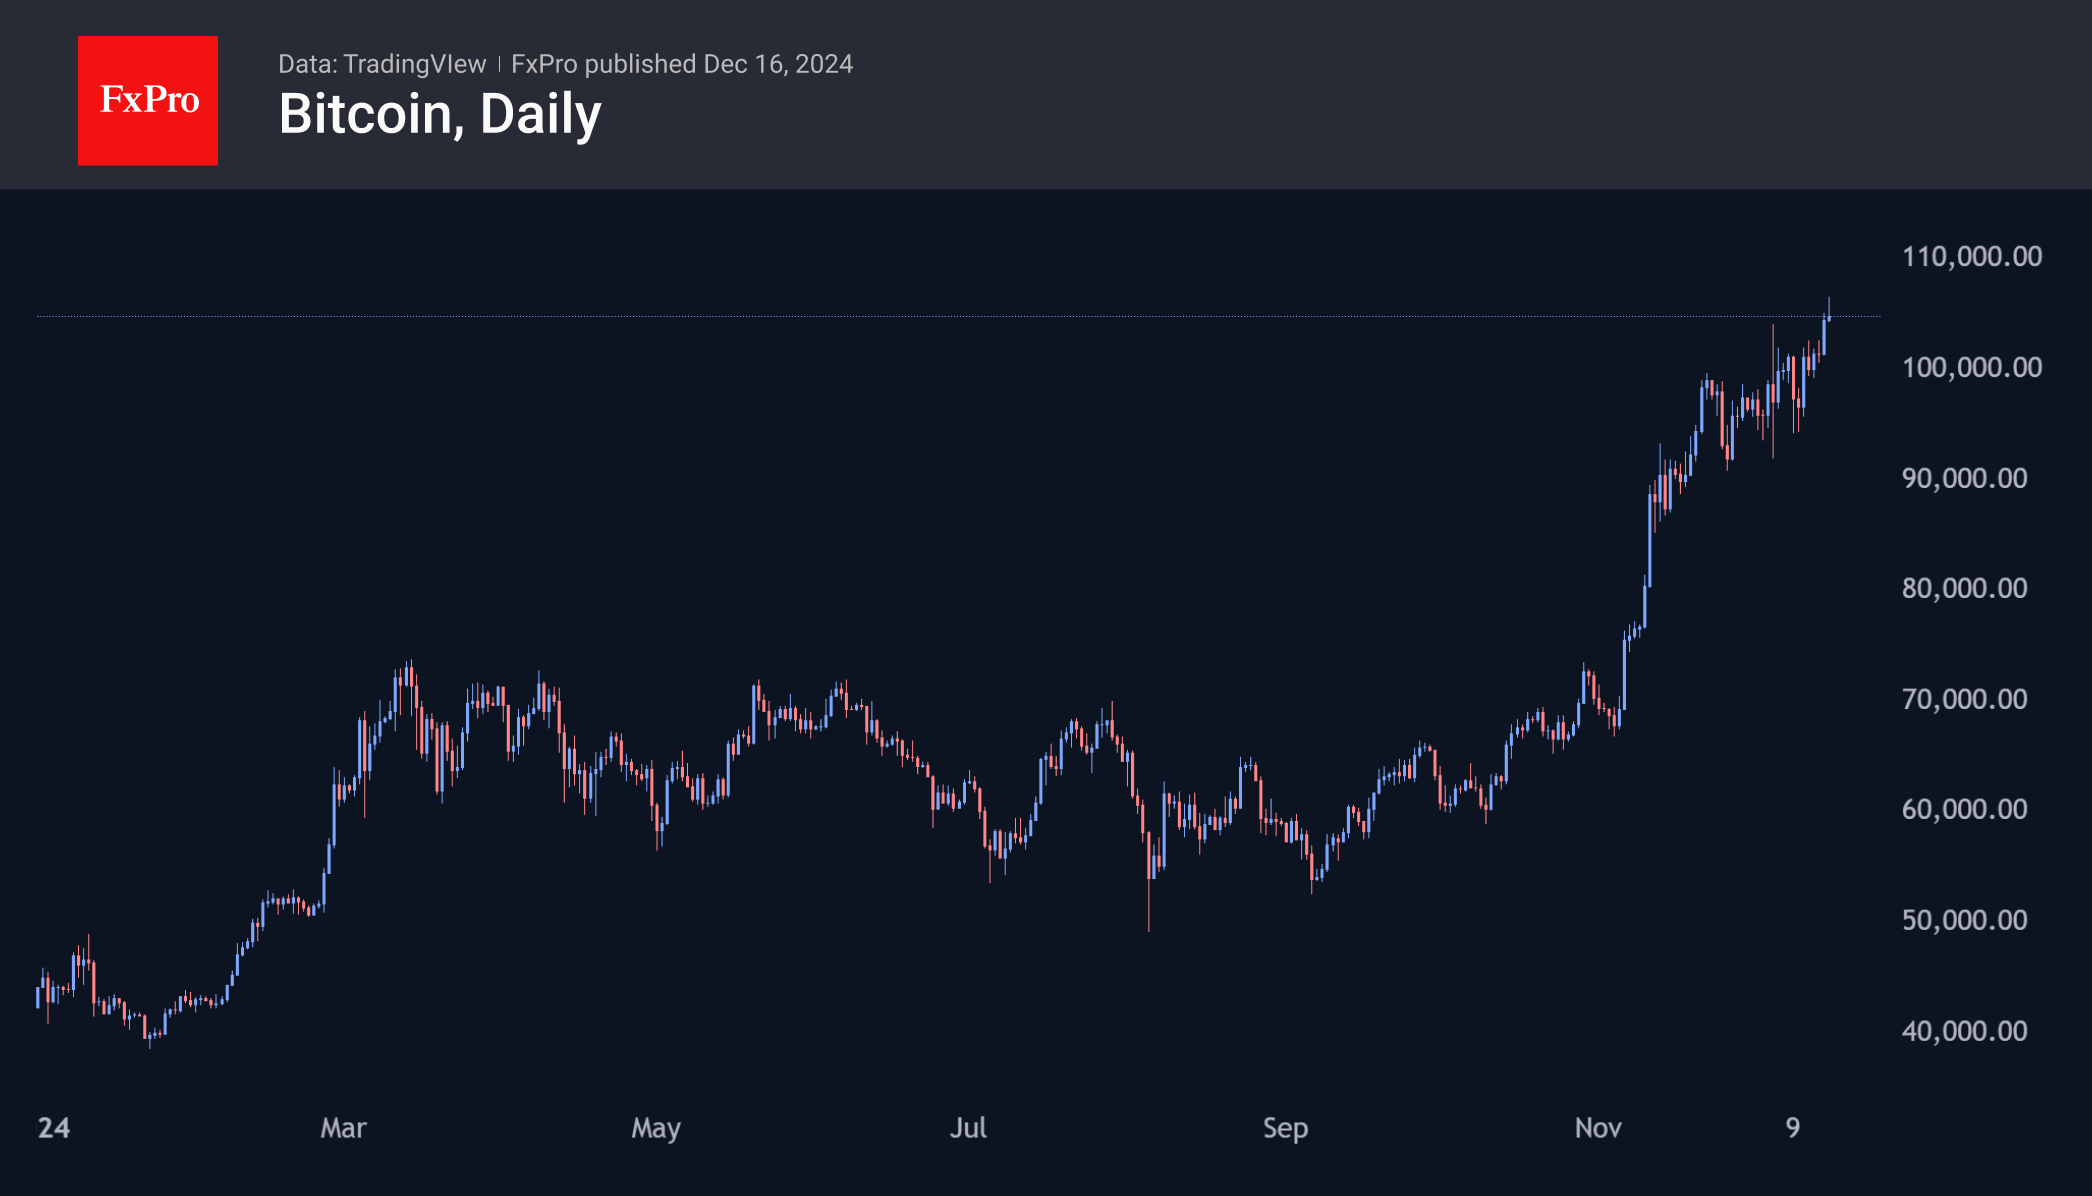
Meanwhile, in the cryptocurrency market, Bitcoin surged to a new all-time high following comments from US president-elect Donald Trump, who revealed plans to implement a strategic cryptocurrency reserve akin to the US oil reserve. Speaking to CNBC on Sunday, Trump promised “something great” for the cryptocurrency sector under his administration. Technically, outlook in Bitcoin will stay bullish as long as 93951 support holds. Current up trend is on track to 138.2% projection of 24896 to 73812 from 52703 at 120304, i.e. 120k handle.
In Europe, at the time of writing, FTSE is down -0.40%. DAX is down -0.30%. CAC is down -0.87%. UK 10-year yield is down -0.016 at 4.402. Germany 10-year yield is down -0.029 at 2.234. Earlier in Asian, Nikkei fell -0.03%. Hong Kong HSI fell -0.88%. China Shanghai SSE fell -0.16%. Singapore Strait Times rose 0.28%. Japan 10-year JGB yield rose 0.314 to 1.072.
ECB's Lagarde: Shifting focus to appropriate policy from prolonged monetary restriction
ECB President Christine Lagarde's speech today marked a departure from previous guidance shaped by high inflation and significant uncertainty.
Lagarde highlighted that the earlier approach, which aimed to maintain restrictive rates “for as long as necessary,” is no longer aligned with the ECB’s evolving outlook for inflation and risk balance.
However, with "disinflation process well on track" and growth risks becoming more pronounced, ECB now aims for an "appropriate" policy approach.
She reiterated that if data continues to confirm their expectations, ECB expects to lower rates further.
UK PMI composite unchanged at 50.5, triple whammy of growth, employment and inflation
UK PMI Manufacturing PMI slipped from 48.0 to 47.3, an 11-month low. Services PMI improved from 50.4 to 51.4. PMI Composite held steady at 50.5, signaling stagnation in overall economic activity.
Chris Williamson, Chief Business Economist at S&P Global Market Intelligence, described a "triple whammy" facing businesses: stalled growth, declining employment, and renewed inflationary pressures.
While the PMI suggests that the economy remained broadly stagnant in Q4, the outlook for 2025 appears increasingly uncertain. Weak confidence, labor market retrenchment, and inflation risks could weigh heavily on economic activity.
Williamson said BoE faces the difficult task of balancing support for growth against the need to maintain inflation control, suggesting a cautious approach to monetary easing in the coming months.
Eurozone PMI improves to 49.5 with potential positive surprises from politics ahead
Eurozone PMI Services rose notably from 49.5 to 51.4, marking a return to expansion territory. However, PMI Manufacturing remained static at 45.2, firmly in contraction. Consequently, PMI Composite edged up from 48.3 to 49.5, signaling ongoing weakness in overall economic momentum.
Cyrus de la Rubia, Chief Economist at Hamburg Commercial Bank, noted that the service sector's rebound is a "welcome boost" to the Eurozone economy, while manufacturing continues to face a severe downturn.
Inflationary pressures remain a concern, particularly in the services sector. Input costs have risen for the third consecutive month, largely due to higher wage agreements, with businesses passing these costs onto customers. This persistent inflation challenge informed ECB's cautious decision earlier this month to cut rates by just 25bps.
Germany and France, the Eurozone’s largest economies, add to the uncertainty with ongoing political challenges, delaying necessary reforms to stimulate growth. Despite this, de la Rubia suggested there is potential for "positive surprises" in 2025 if clearer economic policies emerge from future governments.
Japan's PMI composite rises to 50.8, stubborn inflation caps growth
Japan’s private sector activity showed a modest improvement in December, driven by a stronger services sector, while manufacturing continued to contract.
PMI Manufacturing index declined from 49.5 to 49.0, marking the fourth consecutive month of contraction. In contrast, PMI Services index rose from 50.5 to 51.4, lifting Composite PMI from 50.1 to 50.8, indicating mild overall growth.
Usamah Bhatti, economist at S&P Global Market Intelligence, pointed out the contrasting trends: “Services firms saw the strongest rise in new business in four months, while goods producers faced a sharper decline in orders.” This divergence highlights persistent weakness in manufacturing amid subdued demand and improving momentum in the services sector.
Inflationary pressures persisted, fueled by the Yen’s weakness, which increased the cost of imported materials. Input prices rose at the fastest pace in four months, while selling price inflation hit its highest level since May, as businesses passed on rising costs to consumers. Bhatti noted, “Stubborn inflation held back a stronger expansion of the Japanese private sector in December.”
Australian PMI composite falls to 49.9, bolsters case for early RBA rate cut
Australia's December PMI data pointing to a broad-based slowdown. The Manufacturing index fell from 49.4 to 48.2. Services PMI edged down from 50.5 to 50.3. Meanwhile, Composite PMI dropped from 50.2 to 49.9, slipping into mild contraction territory.
Jingyi Pan, Economics Associate Director at S&P Global Market Intelligence, noted that the data reflects growing strain across sectors, with manufacturing leading the downturn and services beginning to falter.
Forward indicators presented mixed signals. While business confidence reached its highest level in over two-and-a-half years, new business growth slowed, and unfinished work declined further. Employment gauge showed its first contraction since August 2021.
Muted selling price inflation provides room for RBA to consider rate cuts in early 2024. However, rising cost pressures remain a concern.
NZ BNZ services jumps to 49.5, closer to stability
New Zealand’s BusinessNZ Performance of Services Index rose significantly from 46.2 to 49.5 in November, signaling a move closer to stabilization. However, the index remains under the no-change threshold of 50.0 and well below its long-term average of 53.1.
Key subcomponents offered a mixed picture. Activity/sales improved from 44.4 to 48.6, and new orders/business rose to 49.8, nearing expansion territory. Employment showed only a slight uptick, from 46.4 to 46.8, reflecting continued caution among firms. Stocks/inventories and supplier deliveries moved into expansionary territory at 52.2 and 52.5, respectively, signaling some recovery in supply chain dynamics.
Negative sentiment among respondents eased, with the proportion of unfavorable comments dropping to 53.6% from October’s 59.1%. However, the ongoing concerns over the economic climate and the cost of living remain dominant themes, indicating persistent headwinds for the sector.
USD/JPY Mid-Day Outlook
Daily Pivots: (S1) 152.80; (P) 153.30; (R1) 154.14; More...
Intraday bias in USD/JPY remains on the upside as rebound from 148.64 is in progress. Further rally should be seen to retest 156.74 first. Firm break there will resume whole rally from 139.57, and target 61.8% projection of 139.57 to 156.74 from 148.64 at 159.25 next. On the downside, below 151.79 minor support will turn intraday bias neutral. But risk will stay on the upside as long as 148.64 support holds, in case of retreat.
In the bigger picture, price actions from 161.94 are seen as a corrective pattern to rise from 102.58 (2021 low). The range of medium term consolidation should be set between 38.2% retracement of 102.58 to 161.94 at 139.26 and 161.94. Nevertheless, sustained break of 139.26 would open up deeper medium term decline to 61.8% retracement at 125.25.
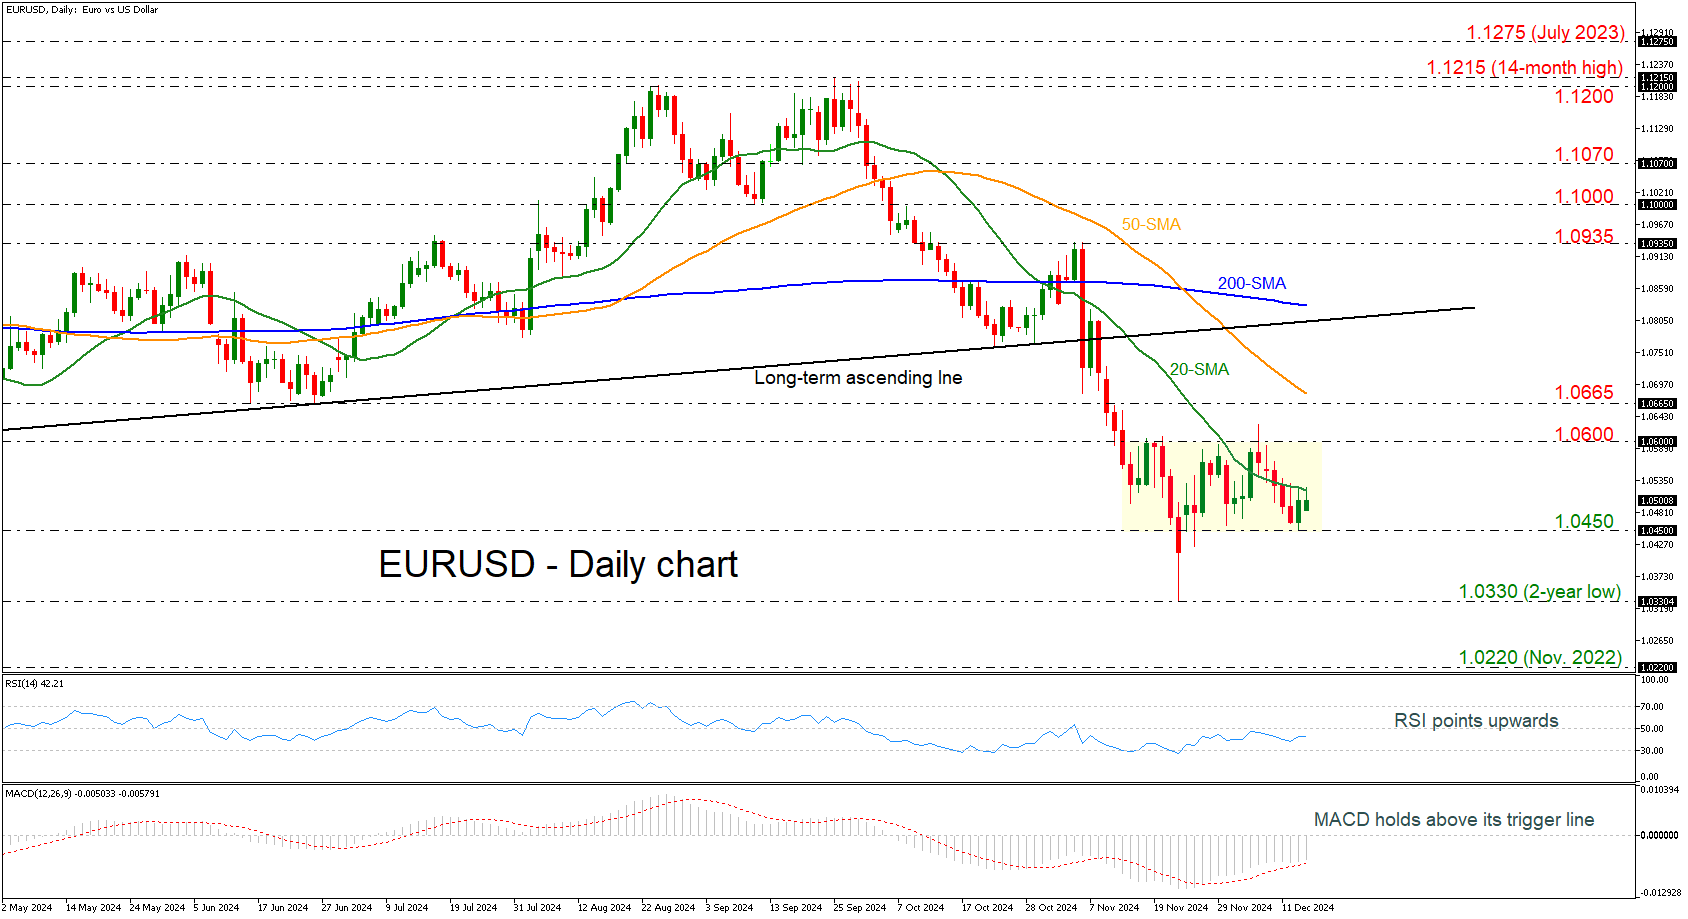
EURUSD Remains Under Pressure Below 20-day SMA
- EURUSD holds within tight range in near term
- MACD and RSI were below their mid-levels
EURUSD had another pullback off the lower boundary of the short-term trading range within 1.0450–1.0600, but the 20-day simple moving average (SMA) seems to be a tough obstacle to surpass.
Technically, the RSI indicator is pointing upwards below the neutral threshold of 50, while the MACD is holding above its trigger line beneath the zero level. Both confirm an upside retracement in the market.
If the pair successfully breaks above the immediate 20-day SMA line at 1.0520, it will retest the 1.0600 mark. A move above this region would be the green light for more increases until the 1.0665 resistance and the 50-day SMA at 1.0680. Further upward pressure could pave the way for the 200-day SMA at 1.0830.
On the other hand, a slide below the 1.0450 key level could lead to a retouch of the two-year low of 1.0330, ahead of the November 2022 low at 1.0220.
All in all, EURUSD has been developing within a consolidation area since mid-November, and the current risks are negative.
Gold Technical: A Less Dovish Fed May Reinforce a Medium-Term Corrective Decline
- The proposed policies of Trumponomics 2.0 may ignite a further uptick in inflationary expectations in the US.
- Market-transacted inflationary expectations gauge, the 5-year and 10-year US breakeven inflation rates have been trending higher since September 2024.
- The Fed may switch its current dovish monetary policy to a “wait and see” pivot stance on 18 December FOMC.
- Watch the US$2,716 key medium-term resistance on Gold (XAU/USD).
Since our last publication, the price actions of Gold (XAU/USD) have staged a minor bounce of 7% to revisit the prior minor swing of US$2,710 printed on 8 November twice; on 22 November and 11 December but failed to make a significant breakout above US$2,710.
The yellow metal traded lower last Friday, 13 December, and reintegrated below its 50-day moving average which suggests that the bulls are being subdued as we head into a key event this week; the US Federal Reserve monetary policy decision and the release of its latest economic projections (“dot plot”) this Wednesday, 18 December.
Market participants in the Fed funds futures market have already priced in with near certainty (97.1% chance based on the CME FedWatch tool as of 16 December) that the Fed will proceed to cut by 25 basis points (bps), its third cut to bring to Fed funds rate to 4.25-4.50%.
A less dovish Fed may be on the horizon next
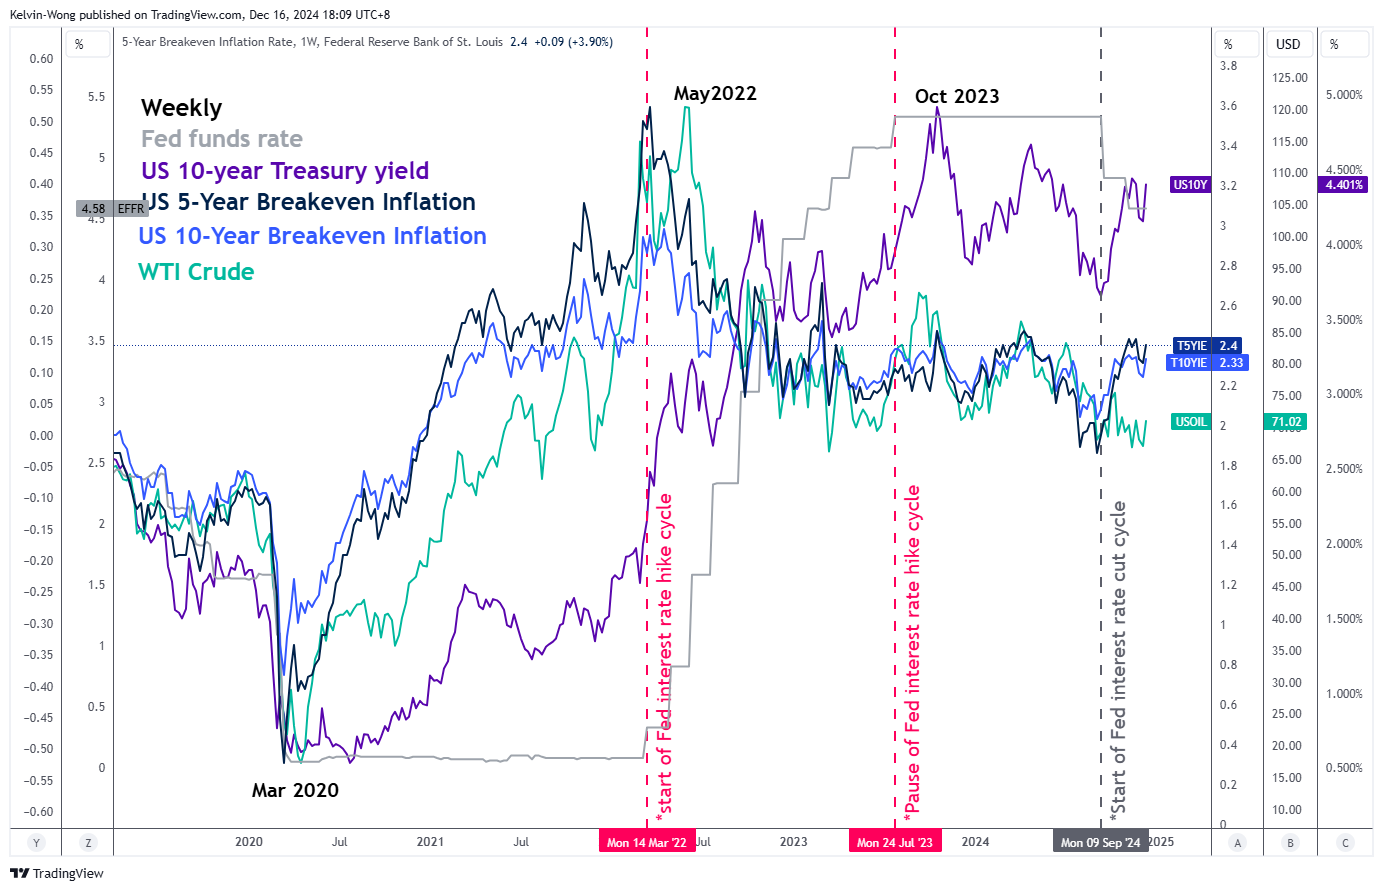
Fig 1: 5-year & 10-year US breakeven inflation rates major trends as of 13 Dec 2024 (Source: TradingView, click to enlarge chart)
Market-transacted financial instruments have started to price in a further uptick in US inflationary expectations as derived from the movements of both the 5-year and 10-year US breakeven inflation rates that have been trending upwards since the start of the current Fed’s interest rate cut cycle on September 2024, to hover at 2.40% and 2.33% respectively as of 16 December 2024, above the Fed’s long-term inflation target of 2% (see Fig 1).
The primary catalyst for the current medium-term uptrend movements of the 5-year and 10-year US breakeven inflation rates have been triggered by the proposed policies of Trumponomics 2.0 that consist of deeper corporate tax cuts and higher trade tariffs imposed on US imports that will likely revive inflationary pressures in 2025, and beyond.
Based on the CME FedWatch tool as of 16 December 2024, market participants are expecting another two potential Fed funds rate cuts of 25 bps each in 2025 to bring the Fed funds rate to 3.75-4.00%, which is lesser than the last “dot plot” implied projection released on 18 September FOMC meeting that highlighted an approximate of four interest rate cuts of 25 bps each in 2025 (to bring the Fed funds rate to 3.4%) based on a median projection from Fed officials.
Bullish reversal in 10-year US Treasury real yield
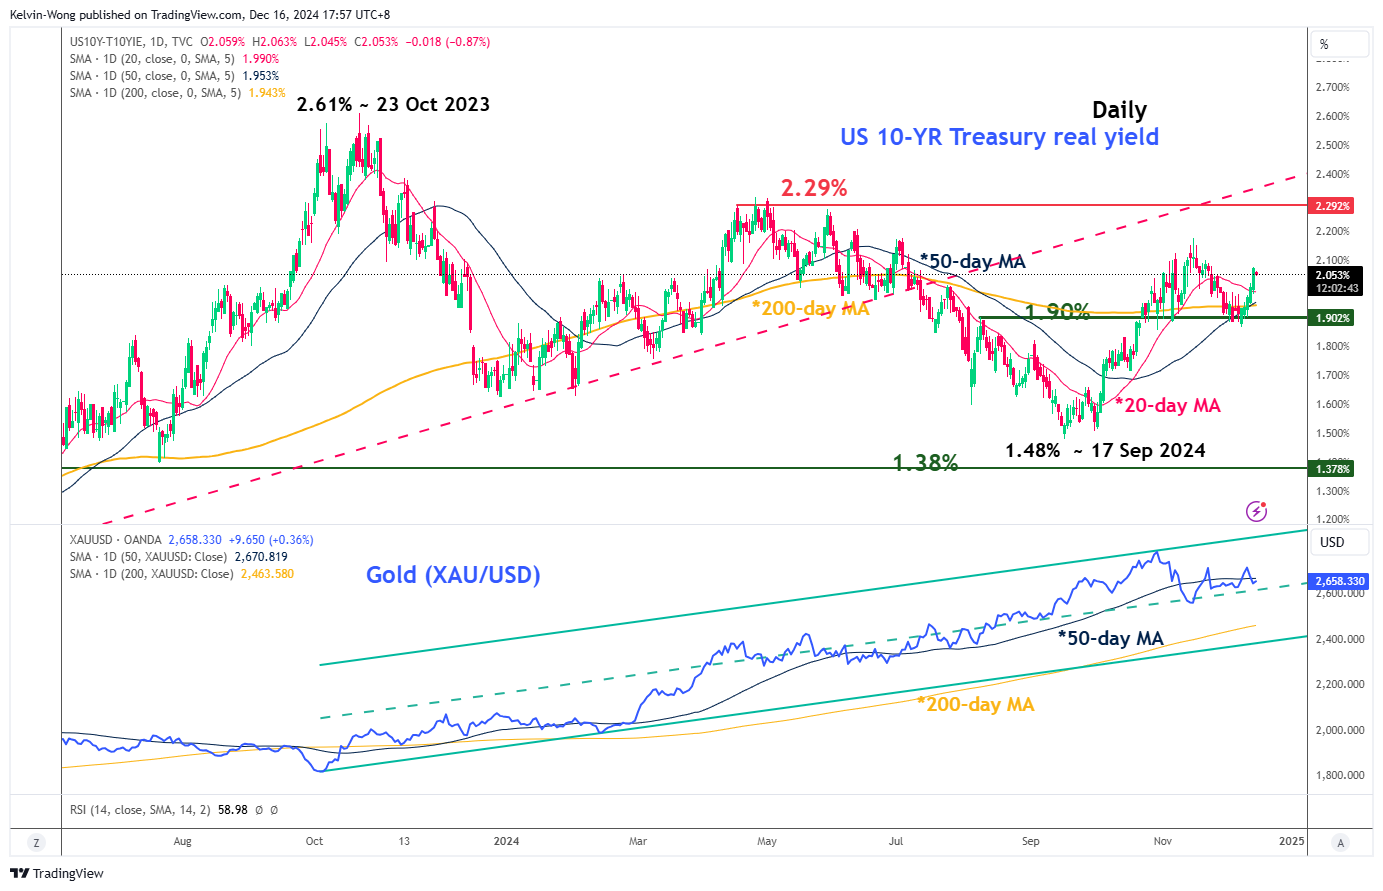
Fig 2: 10-year US Treasury real yield medium-term & major trends as of 13 Dec 2024 (Source: TradingView, click to enlarge chart)
Last week, the 10-year US Treasury real yield staged a significant V-shaped rebound of 16 bps after a retest on its key medium-term support at the 1.90% level on Monday, 9 December.
A potential further push up towards the 2.29% medium-term resistance will increase the opportunity cost of holding Gold (XAU/USD), and eventually cap its bullish strength at least in the short to medium-term horizon (see Fig 2).
An important point to note is that the major uptrend phase of Gold (XAU/USD) in place since October 2023 remains intact. Also, it is likely to be supported by the longer-term effects of higher trade tariffs component of Trumponomics 2.0 which may lead to a further escalation of deglobalization that can trigger headwinds to global economic growth where Gold (XAU/USD) may see higher demand due to its defensive hedging element.
Watch the US$2,716 key medium-term resistance on Gold (XAU/USD)
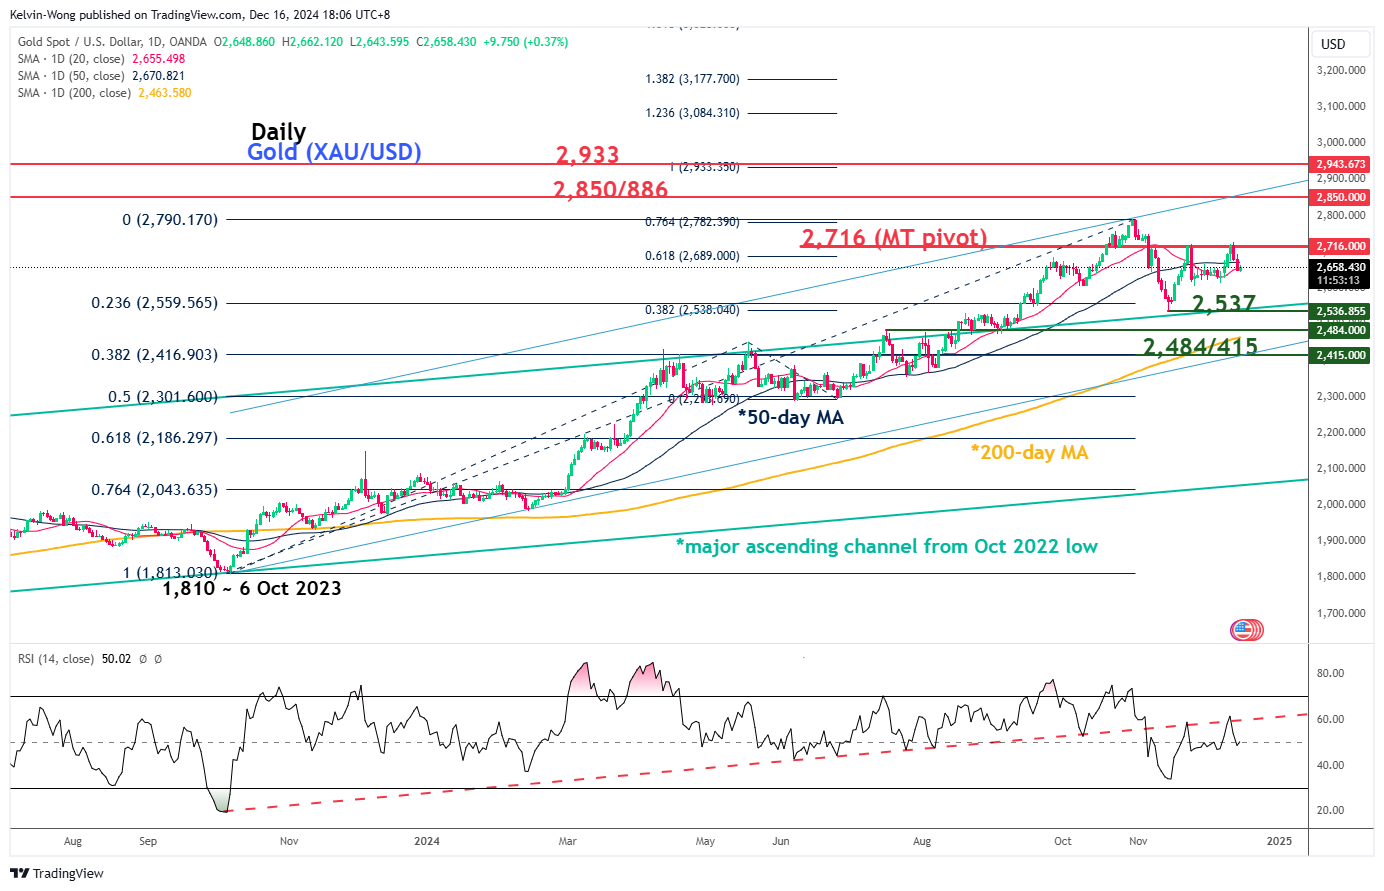
Fig 3: Gold (XAU/USD) medium-term & major trends as of 16 Dec 2024 (Source: TradingView, click to enlarge chart)
Since its recent current all-time high of US$2,716 printed on 31 October, the price actions of Gold (XAU/USD) have started to oscillate in consolidation configuration with a lingering risk of facing a multi-week corrective decline to retest its key 200-day moving average within its major uptrend phase in place since 6 October 2023.
A break below the US$2,537 first medium-term support may reinforce the corrective decline sequence to expose the next medium-term support zone of US$2,484/415. It is also a potential inflection zone to kickstart another potential bullish impulsive sequence for Gold (XAU/USD) (see Fig 3).
On the other hand, a clearance above US$2,716 invalidates the corrective decline bearish scenario to revive the bulls towards the next medium-term resistance zone of US$2,850/886 in the first step.
Pound Higher as Services PMI Rises, Job Report Next
The British pound has moved higher on Monday, after declining 1% last week. In the European session, GBP/USD is trading at 1.2747, up 0.30% on the day.
UK Services improves, manufacturing slips
The UK Services PMI rose to 51.4 in December, up from 50.8 in November, which was a 13-month low. This beat the market estimate of 51.0, but points to weak business activity as demand for UK exports has been weak and confidence among services providers remains subdued.
UK manufacturing is mired in a depression, and the PMI fell to 47.3 in December, down from 48.0 in November and shy of the market estimate of 48.2. This marked the lowest level in eleven months, as production and new orders showed an accelerated decrease.
The weak PMI data followed Friday’s GDP report, which showed a 0.1% decline for a second straight month in October. This missed the market estimate of 0.1%. GDP rose just 0.1% in the three months to October.
The UK releases employment and wage growth numbers on Tuesday. The economy is projected to have lost 12 thousand jobs in the three months to October, after a sparking 200 thousand gain in the previous report. Wages including bonuses is expected to climb to 5% from 4.8%.
The Bank of England meets on Thursday and is expected to hold the cash rate at 4.75% after cutting rates by 25 basis points in November. The economy could use another rate cut but inflation remains a risk to upside, with CPI climbing in October to 2.3% from 1.7%. The BoE will be keeping a close eye on wage growth, which has been a driver of inflation.
The US releases PMIs later today. Manufacturing remained in contraction territory in November at an upwardly revised 49.7 and there is optimism that the new Trump administration’s protectionist stance could benefit US manufacturers.
The services sector is in good shape and improved in November to 56.1, up from 55.0 in October. The uncertainty ahead of the US election is over and lower interest rates have contributed to stronger expansion in services.
GBP/USD Technical
- GBP/USD is testing resistance at 1.2638. The next resistance line is 1.2668
- 1.2592 and 1.2562 are the next support levels
Bitcoin Has Overcome Selling Resistance
Market Picture
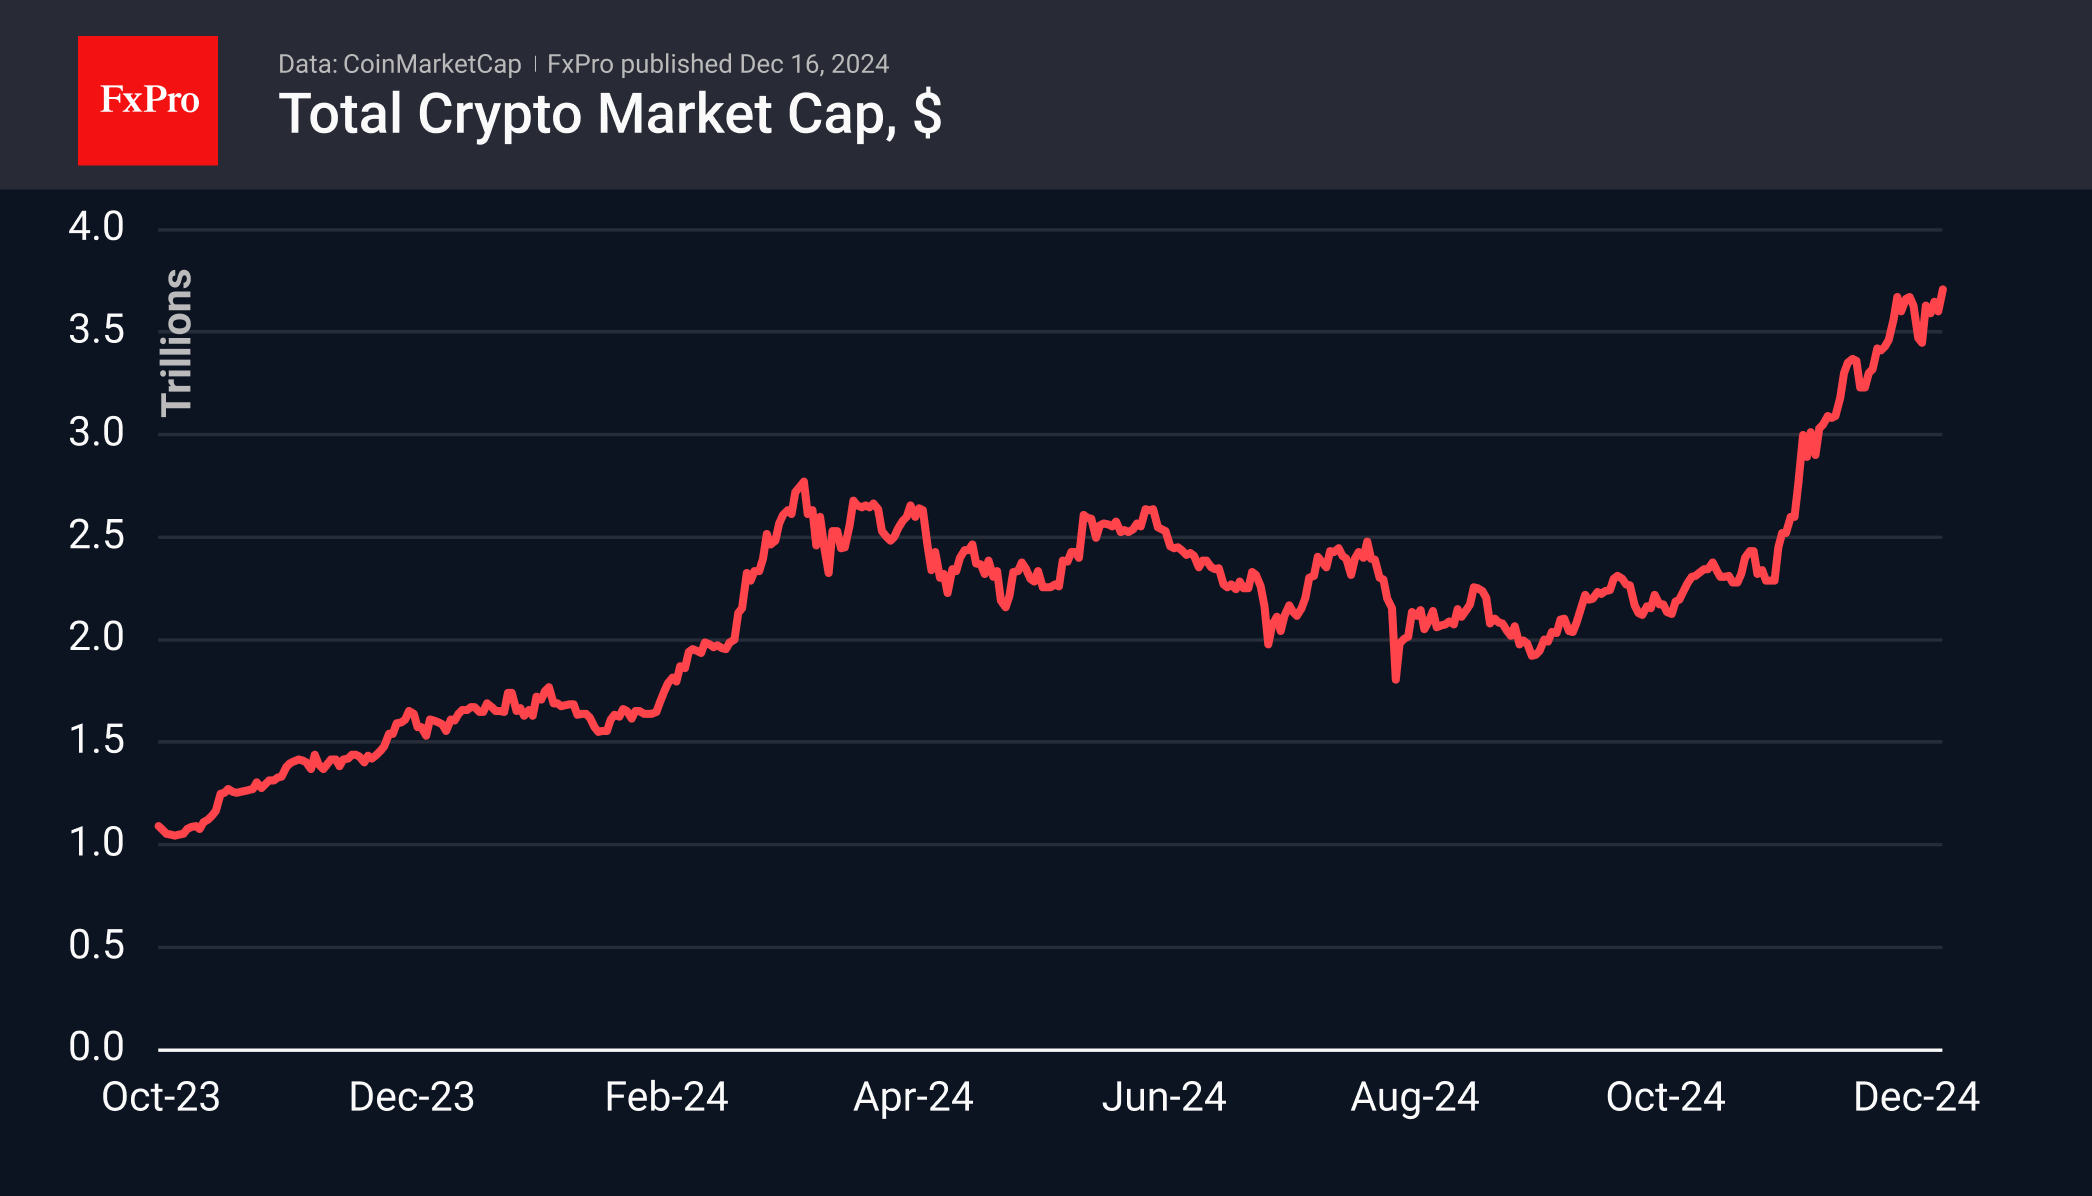
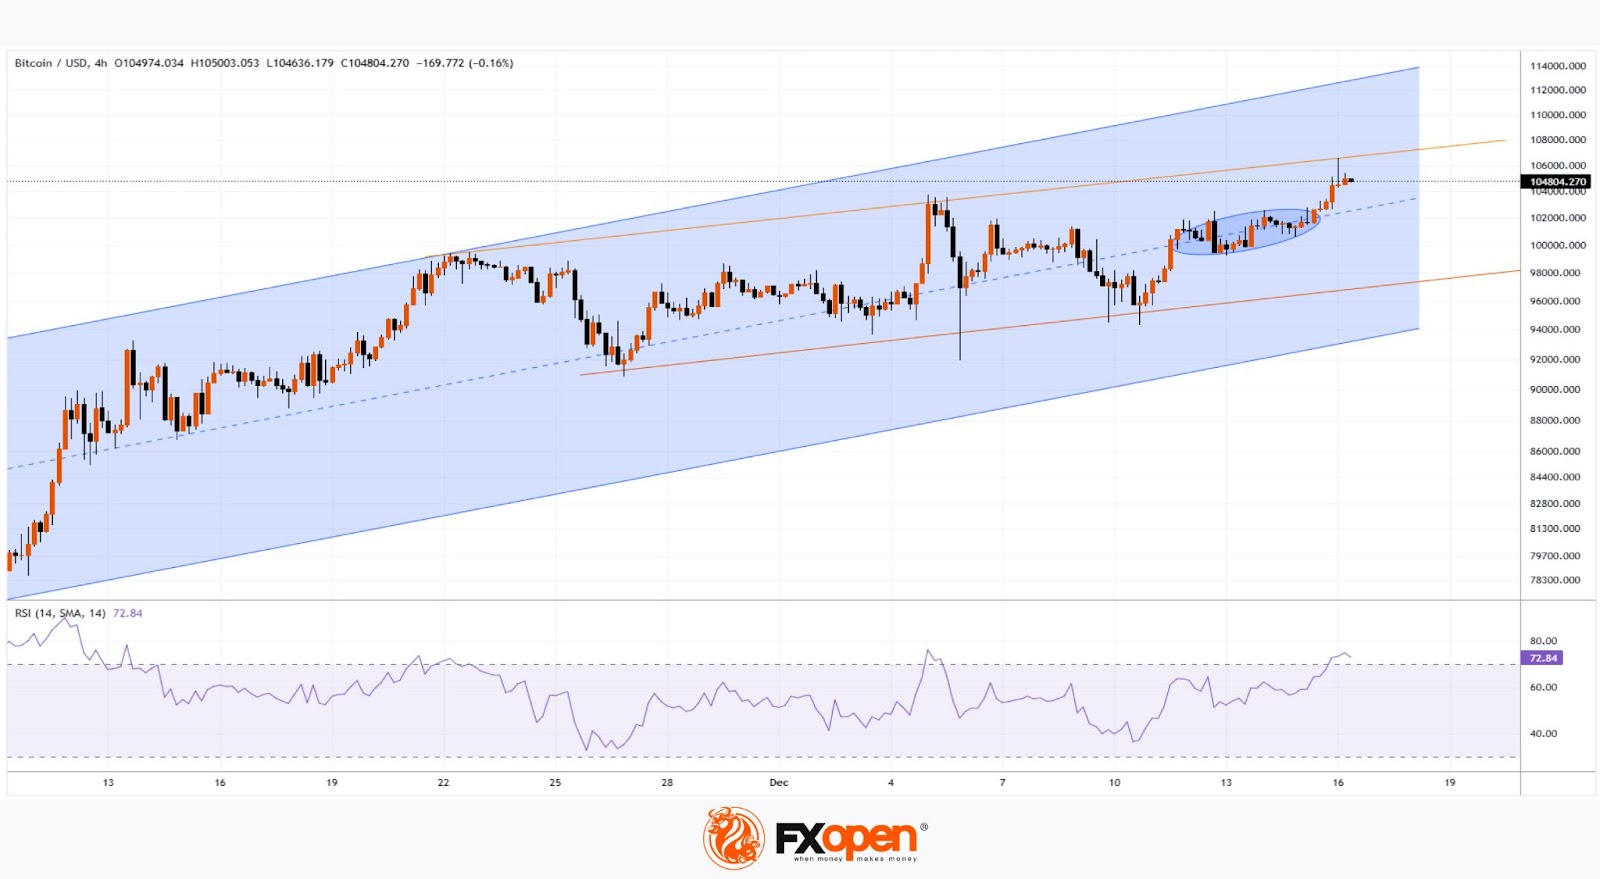
The cryptocurrency market hit record highs in terms of capitalisation, reaching $3.73 trillion at the start of active Asian trading and is sitting at $3.71 trillion at the time of writing. The market digested the overhang of pending selling in Bitcoin near psychologically important levels and continued to move higher.
Bitcoin gained about 3% over the past day, slightly outperforming the broader market. The move into all-time high territory, including this morning’s push above $106K, confirms the bullish bias. This is especially important after a three-week consolidation near the $100K level. An acceleration in growth is now likely if unexpected news from the traditional financial markets doesn’t stop this rally.
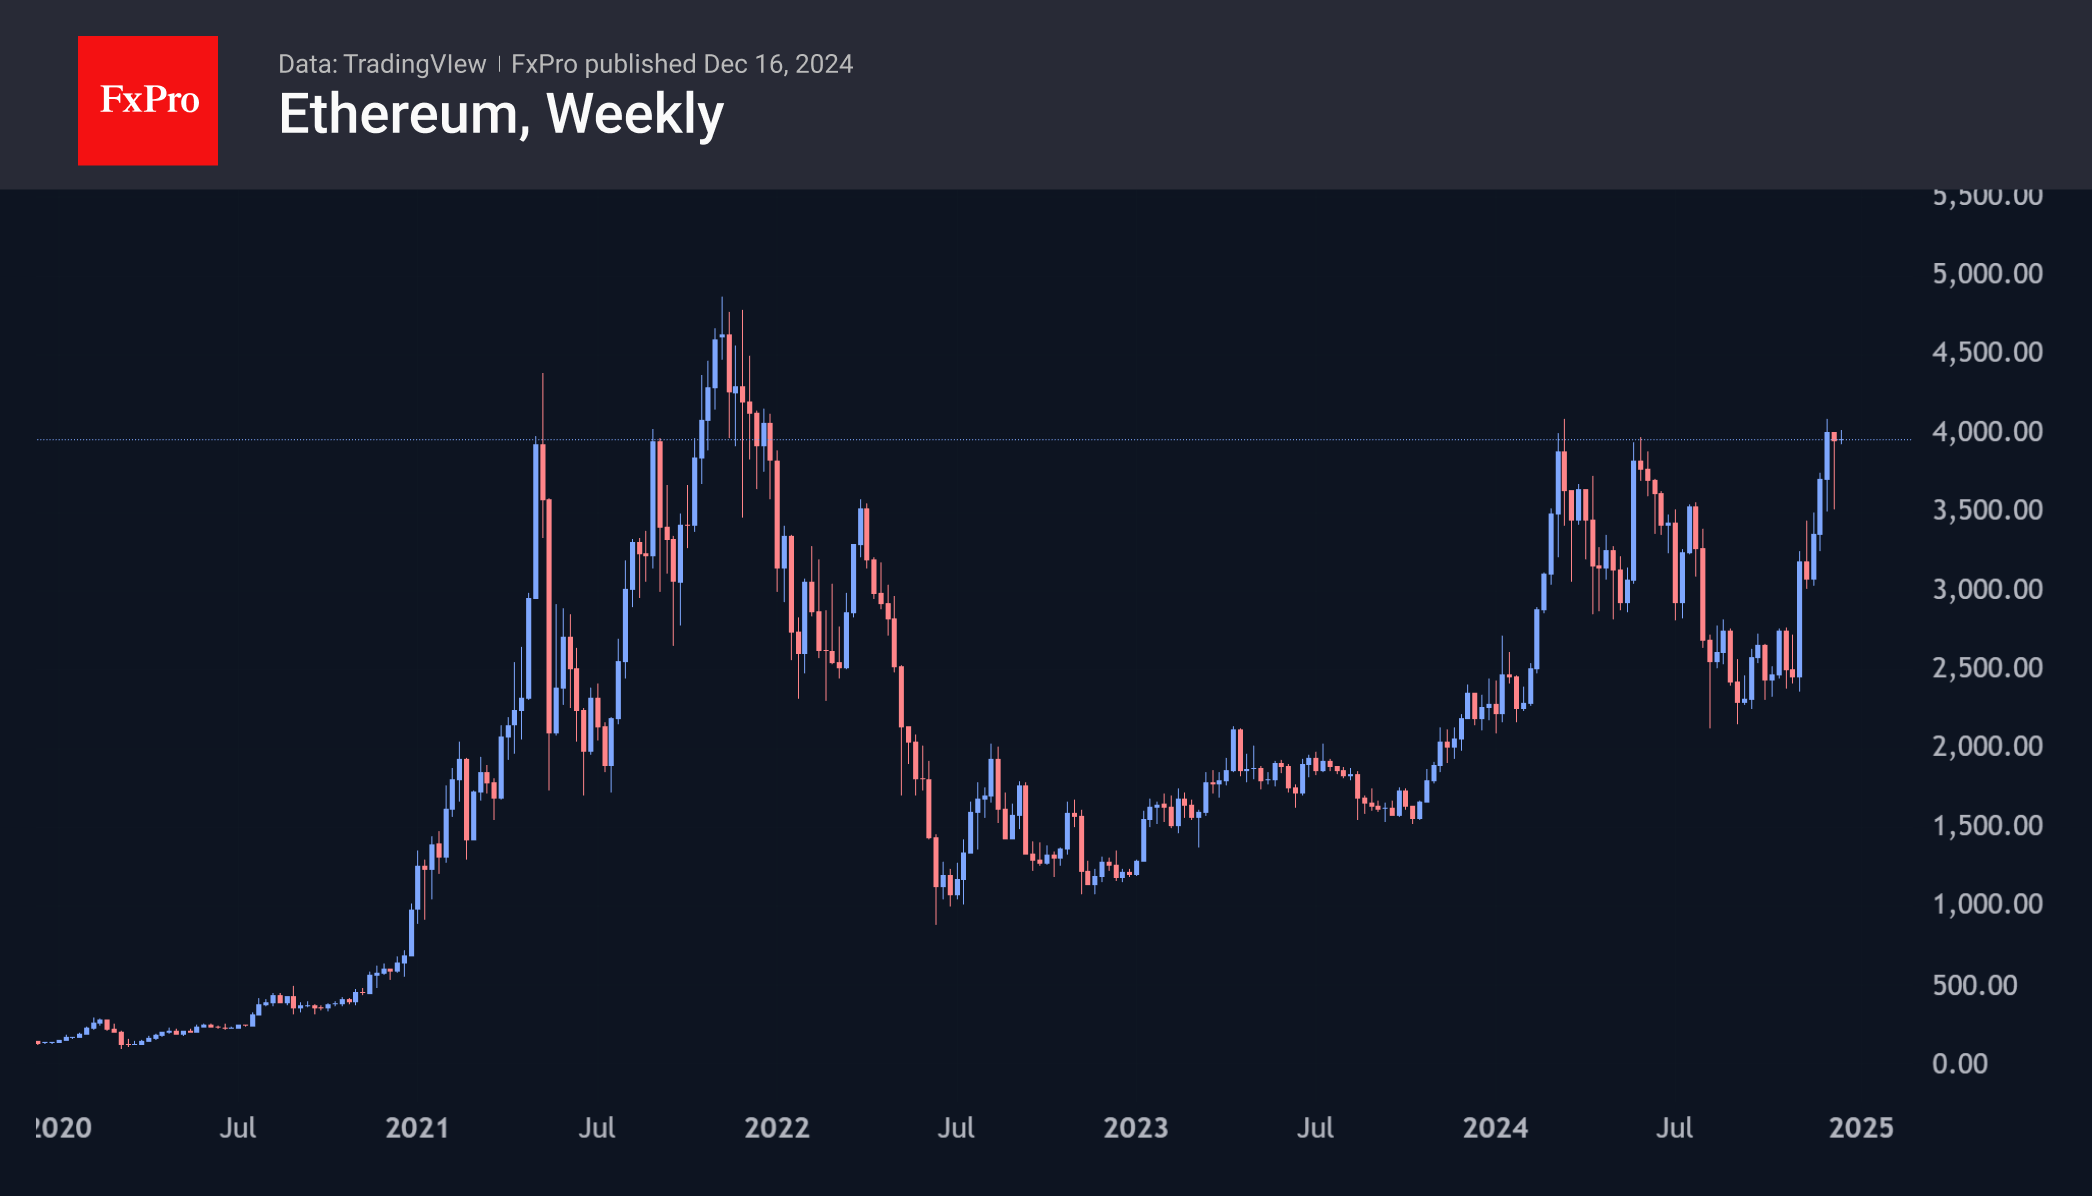
Ethereum is struggling at the $4000 level after quickly recovering from a 15% drop ten days ago. The second largest cryptocurrency has a high chance of overcoming resistance at the round level and coming close to updating all-time highs at $4800.
News Background
According to cryptocurrency bank Signum, every $1 billion inflow into the BTC ETF pushes Bitcoin up by 3-6%. Growing institutional interest in the asset sets the stage for a “demand shock” in 2025.
Texas has proposed creating a Bitcoin reserve, and other US states are working on similar proposals. According to the Satoshi Action Fund, at least ten states plan to introduce strategic Bitcoin reserve legislation.
According to a JPMorgan report, publicly traded mining companies have begun implementing a MicroStrategy-style strategy to acquire bitcoins for their balance sheets. The companies are issuing bonds and stocks to fund operating costs and forgoing the sale of mined coins.
MicroStrategy shares will be included in the Nasdaq 100 stock index starting 23 December. That means equity ETFs, including the popular $325 billion Invesco QQQ trust, will automatically start buying them.
Avalanche raised $250 million in a closed token sale ahead of the Avalanche9000 upgrade scheduled for 16 December.
According to a survey conducted by crypto exchange Kraken, 73% of respondents plan to continue investing in crypto assets in 2025. Only 8% of respondents agree that cryptocurrencies are like a financial pyramid scheme.
Japanese Yen Hits Three-Week Low as Bank of Japan Holds Rate Steady
The USD/JPY pair climbed to 153.77 on Monday, reaching a three-week high. This movement reflects growing investor sentiment that the Bank of Japan (BoJ) will maintain its current interest rate level and continue its pause on monetary policy tightening at this week's meeting. Recent statements from the BoJ have indicated a need for more evidence to substantiate wage increases before considering rate changes.
Expectations of a BoJ rate hike had previously supported the yen, mitigating external pressures. However, confidence in the BoJ's commitment to tightening seems to wane as time progresses.
Despite this, Japan's domestic economic indicators appear positive. October's primary machinery and equipment orders surpassed expectations, and recent reports have shown improvement in both manufacturing and service sector activity in December.
BoJ policymakers are increasingly unconcerned about the weakening yen's potential to accelerate inflation, which is already at desirable levels. However, further yen depreciation could push inflation higher, a scenario that remains on the central bank's radar.
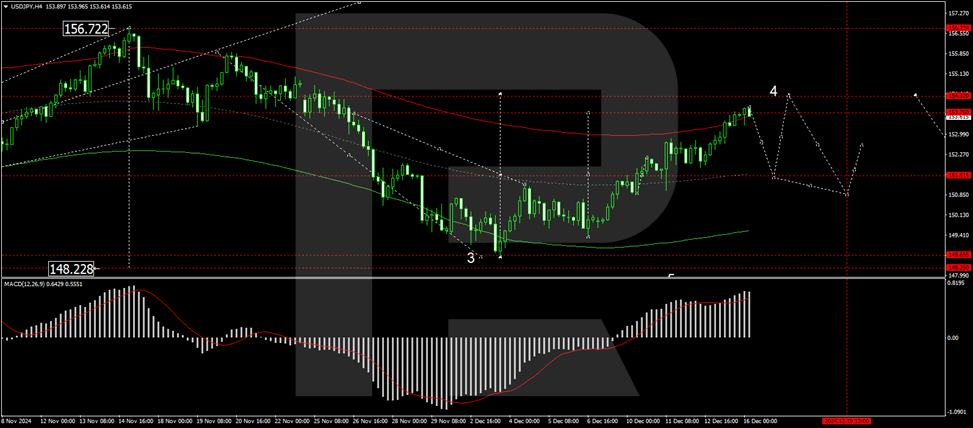
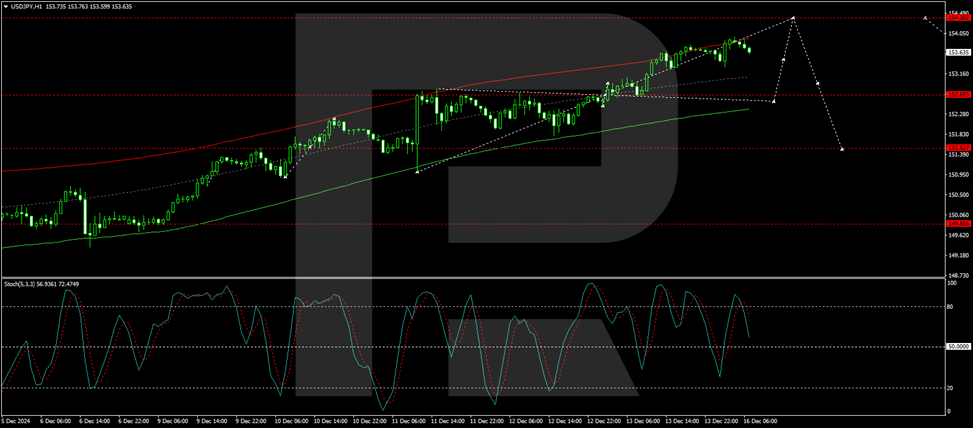
Technical analysis of USD/JPY
H4 chart: USD/JPY has established a consolidation range around the 151.51 level, from which it has continued its upward trajectory. The pair recently touched 153.93, and current technical setups suggest a potential consolidation below this peak. Should the price break downward, a corrective movement to retest 151.51 is possible, followed by another potential rise towards 154.40. The MACD indicator supports this view, with its signal line well above zero but indicating readiness for a downward correction.
H1 chart: The shorter-term H1 chart shows the USD/JPY forming a growth structure aimed at 154.40. After completing a consolidation around 152.70 and achieving a local high at 153.93, a correction back to at least 152.70 is anticipated. Following this correction, the market may initiate a new growth phase targeting 154.40. The Stochastic oscillator aligns with this analysis. It is currently positioned below 80 and poised to move down towards 20, suggesting an impending correction before further upward movement.
ECB’s Lagarde: Shifting focus to appropriate policy from prolonged monetary restriction
ECB President Christine Lagarde's speech today marked a departure from previous guidance shaped by high inflation and significant uncertainty.
Lagarde highlighted that the earlier approach, which aimed to maintain restrictive rates “for as long as necessary,” is no longer aligned with the ECB’s evolving outlook for inflation and risk balance.
However, with "disinflation process well on track" and growth risks becoming more pronounced, ECB now aims for an "appropriate" policy approach.
She reiterated that if data continues to confirm their expectations, ECB expects to lower rates further.
Bitcoin Hits a Record High, Surging Above $106,000
Analysing Bitcoin's price on 6th December, we:
→ noted that more likely Trump’s victory in the presidential election and his plans to create a strategic reserve dedicated to Bitcoin were the primary driver of BTC/USD’s growth in November.
→ Identified two ascending channels (highlighted in blue and orange) that mapped the fluctuations within the upward trend, which pushed Bitcoin’s price to $100,000.
Over the weekend, President-elect Trump confirmed his intention to establish a strategic reserve dedicated to Bitcoin, propelling Bitcoin’s price to a new all-time high above $106,000.
Meanwhile, a technical analysis of the BTC/USD 4-hour chart reveals:
→ The price reached the upper boundary of the orange channel, which acted as resistance. The candle’s upper wick suggests potential selling pressure, indicating that major market participants might be taking advantage of the price surge to lock in returns.
→ Narrow-range fluctuations (marked with a blue oval) may indicate the position of the blue channel’s median line, while the RSI indicator is in an overbought zone.
Given these observations, we could suggest that the market is in a vulnerable position for a pullback — possibly toward the blue median line, where Bitcoin’s price might be more balanced for both buyers and sellers.
FXOpen offers the world's most popular cryptocurrency CFDs*, including Bitcoin and Ethereum. Floating spreads, 1:2 leverage — at your service. Open your trading account now or learn more about crypto CFD trading with FXOpen.
*At FXOpen UK, Cryptocurrency CFDs are only available for trading by those clients categorised as Professional clients under FCA Rules. They are not available for trading by Retail clients.
This article represents the opinion of the Companies operating under the FXOpen brand only. It is not to be construed as an offer, solicitation, or recommendation with respect to products and services provided by the Companies operating under the FXOpen brand, nor is it to be considered financial advice.