
Sample Category Title
USDCAD Continues Its Bullish Surge, Eyes 1.4300 Area
- USDCAD unlocks new 4-year high, poised for further gains
- Caution required as overbought signals detected
- US retail sales, Canadian CPI due at 13:30 GMT
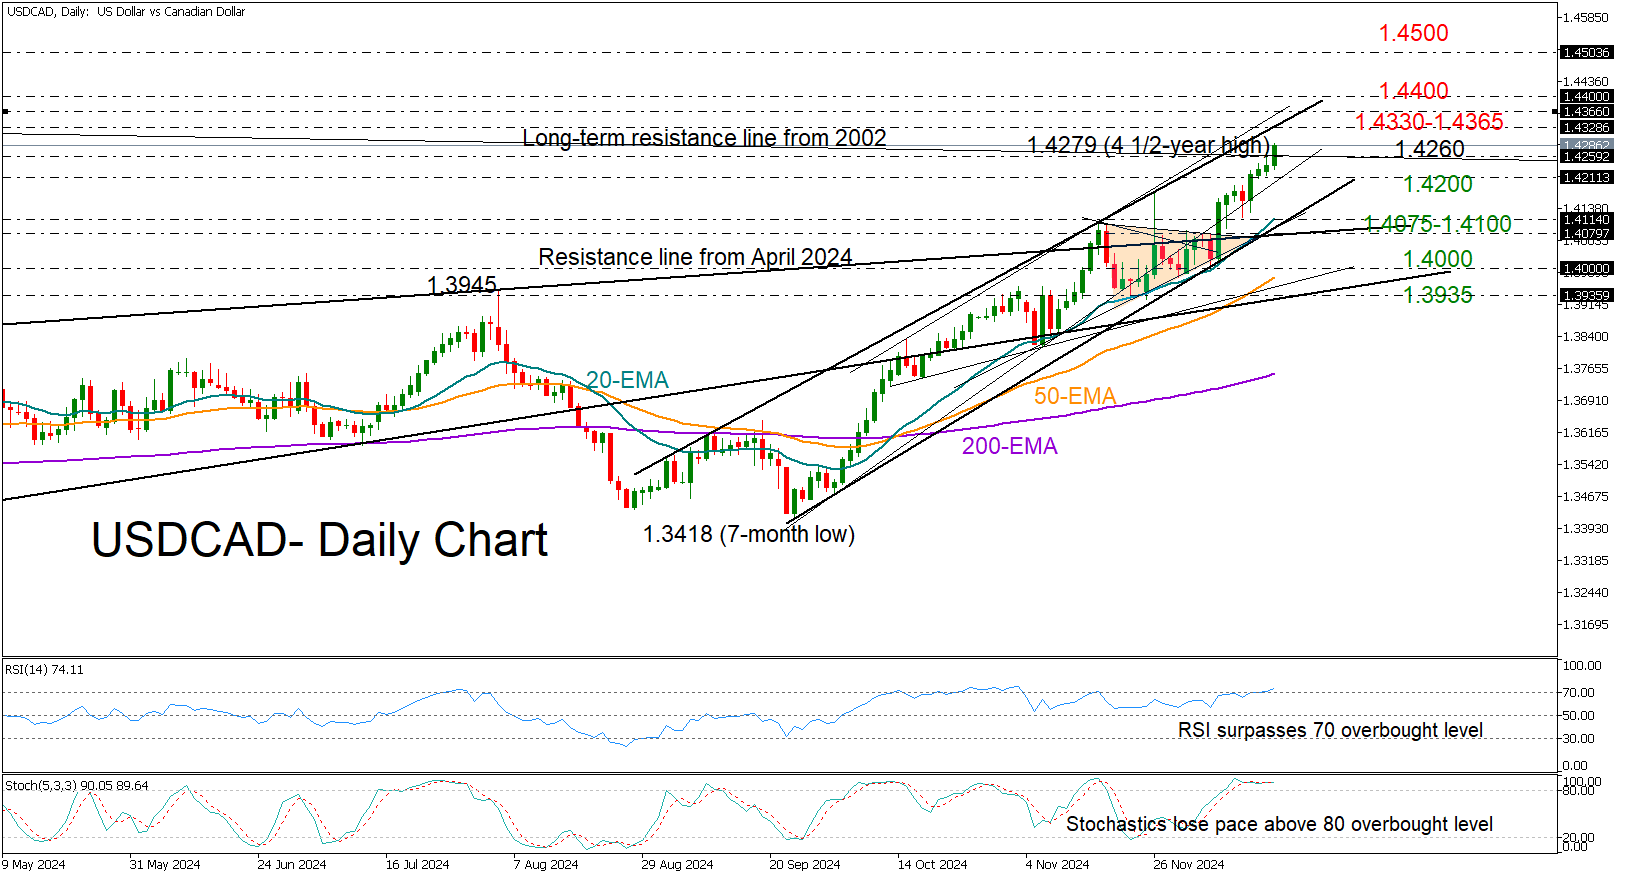
USDCAD has been performing exceptionally well after forcefully breaking a symmetrical triangle on the upside.
The pair unlocked a four-and-a-half year high of 1.4279 earlier today, continuing to press toward the upper band of a bullish channel. The 1.4330-1.4365 area is now in sight as the US and Canadian CPI inflation data loom in the calendar. A break higher could propel the price toward the 1.4500 level, last seen in March 2020, unless the 1.4400 psychological mark caps the bullish action beforehand.
According to the RSI and the stochastic oscillator, the market is treading in overbought waters, and a slowdown might be imminent. Perhaps if the 1.4260 blocks the way up, forcing a close below 1.4200, the price may seek shelter within the 1.4075-1.4100 territory, where the 20-day exponential moving average (EMA) and the lower band of the two-month-old bullish channel are sitting. Failure to pivot there could confirm additional losses toward the 1.4000 level and the 50-day EMA.
All in all, USDCAD is in a clear bullish trend and may have some extra room for improvement before it takes a breather. Key resistance is located in the 1.4330-1.4360 range, while the 1.4200 level could offer support in the event of a pullback.
EUR/USD Daily Outlook
Daily Pivots: (S1) 1.0483; (P) 1.0504; (R1) 1.0533; More...
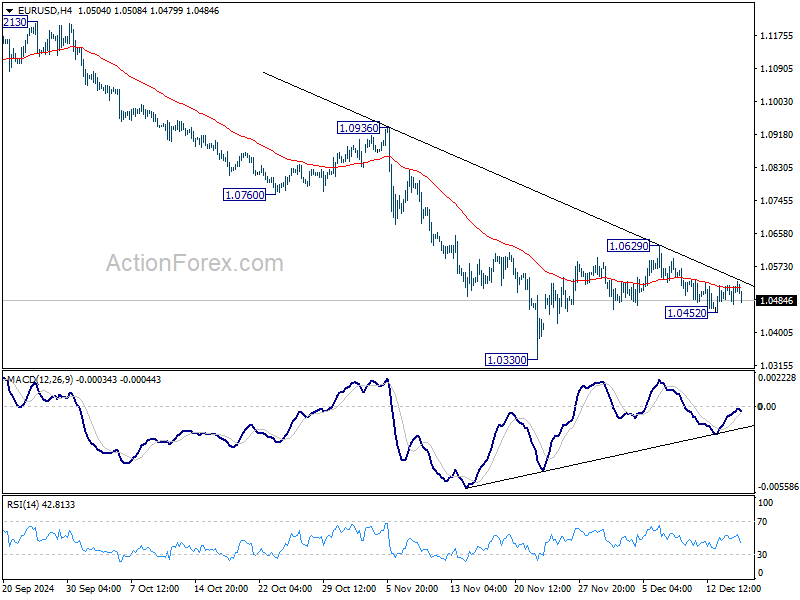
Intraday bias in EUR/USD stays neutral and outlook is unchanged. Corrective pattern from 1.0330 might extend further. But outlook will stay bearish as long as 55 D EMA (now at 1.0674) holds. On the downside, below 1.0452 will bring retest of 1.0330 low.
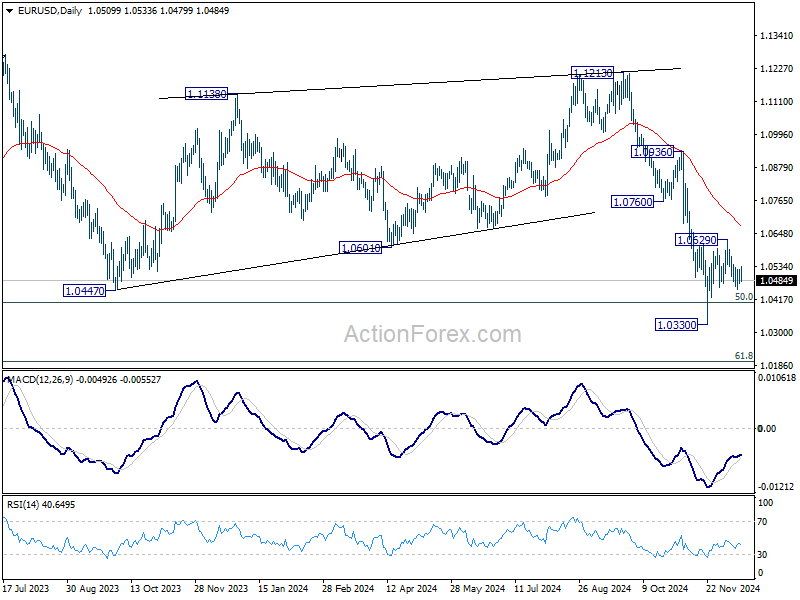
In the bigger picture, focus stays on 50% retracement of 0.9534 (2022 low) to 1.1274 at 1.0404. Strong rebound from this level will keep price actions from 1.1273 (2023 high) as a medium term consolidation pattern only. However, sustained break of 1.0404 will raise the chance that whole up trend from 0.9534 has reversed. That would pave the way to 61.8% retracement at 1.0199 first. Firm break there will target 0.9534 low again.
GBP/USD Daily Outlook
Daily Pivots: (S1) 1.2630; (P) 1.2664; (R1) 1.2719; More...
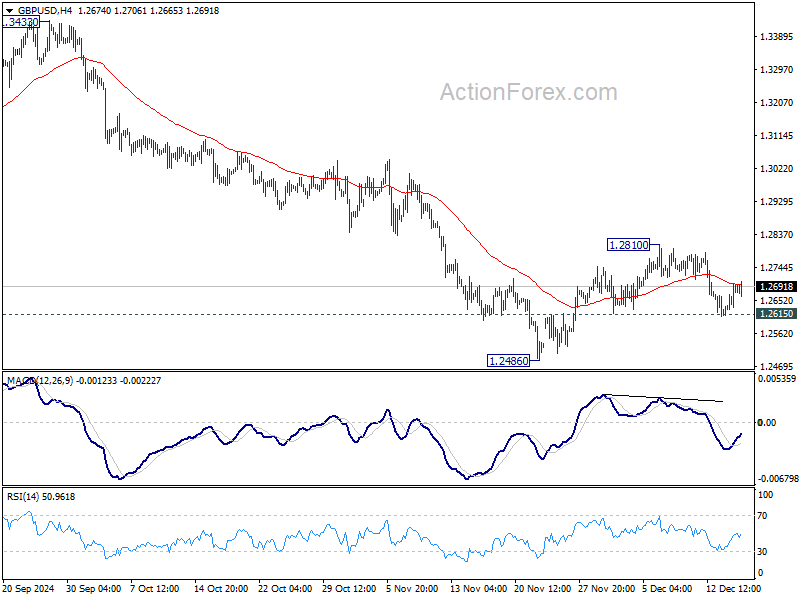
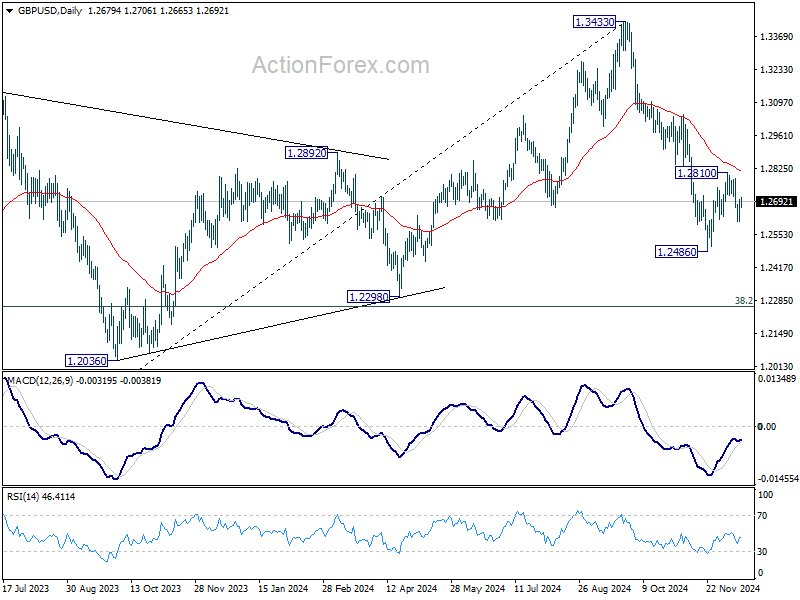
Range trading continues in GBP/USD and intraday bias remains neutral. On the downside, break of 1.2615 minor support will indicate that corrective recovery from 1.2486 has completed. Retest of this low should be seen next, and break will target 1.2298 cluster support zone. Nevertheless, break of 1.2810 will turn bias to upside for stronger rebound.
In the bigger picture, price actions from 1.3433 medium term are seen as correcting whole up trend from 1.0351 (2022 low). Deeper decline could be seen to 38.2% retracement of 1.0351 to 1.3433 at 1.2256, which is close to 1.2298 structural support. But strong support is expected there to bring rebound to extend the corrective pattern.
USD/CHF Daily Outlook
Daily Pivots: (S1) 0.8913; (P) 0.8931; (R1) 0.8964; More…
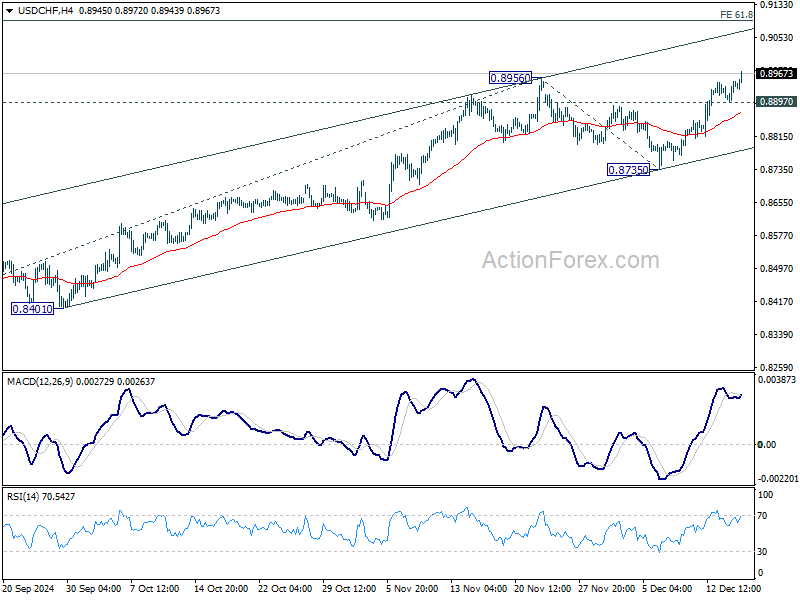
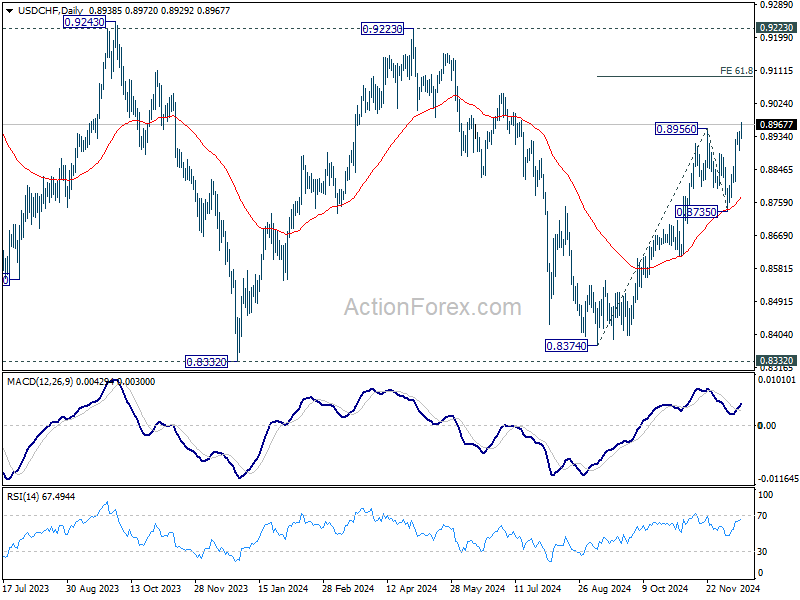
USD/CHF's break of 0.8956 resistance indicates resumption of rally from 0.8374. Intraday bias is back on the upside for 61.8% projection of 0.8374 to 0.8956 from 0.8735 at 0.9095. On the downside, below 0.8897 minor support will turn intraday bias neutral first. But near term outlook will stay bullish as long as 0.8735 support holds, in case of retreat.
In the bigger picture, price actions from 0.8332 (2023 low) are currently seen as a medium term corrective pattern, with rise from 0.8374 as the third leg. Overall outlook will continue to stay bearish as long as 0.9223 resistance holds. Break of 0.8332 low is in favor at a later stage when the consolidation completes.
USD/JPY Daily Outlook
Daily Pivots: (S1) 153.50; (P) 153.99; (R1) 154.65; More...
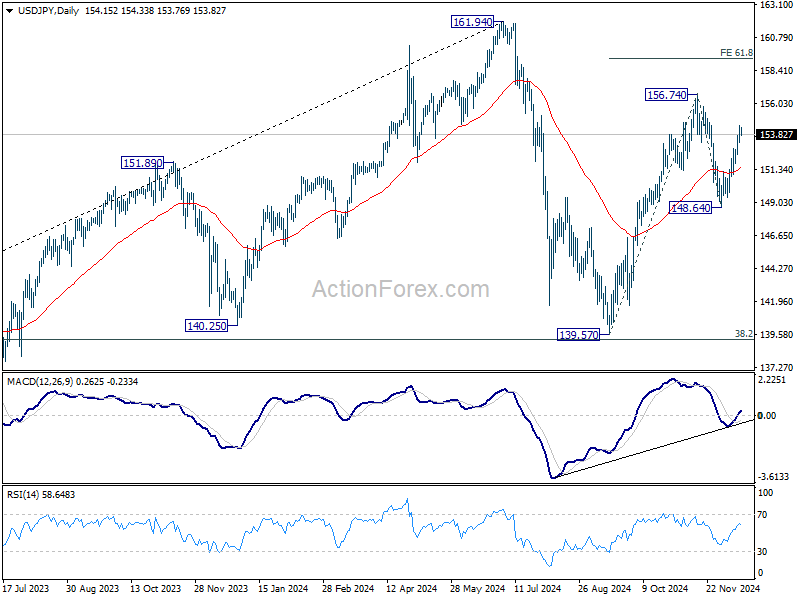
USD/JPY's rebound from 148.64 is still in progress and intraday bias stays on the upside for retesting 156.74 high. Firm break there will resume whole rally from 139.57, and target 61.8% projection of 139.57 to 156.74 from 148.64 at 159.25 next. On the downside, below 152.84 minor support will turn intraday bias neutral. But risk will stay on the upside as long as 148.64 support holds, in case of retreat.
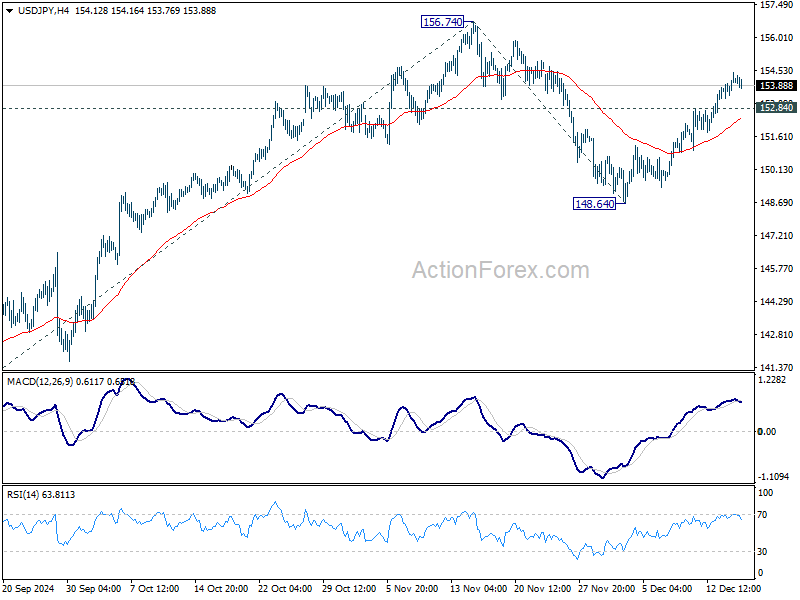
In the bigger picture, price actions from 161.94 are seen as a corrective pattern to rise from 102.58 (2021 low). The range of medium term consolidation should be set between 38.2% retracement of 102.58 to 161.94 at 139.26 and 161.94. Nevertheless, sustained break of 139.26 would open up deeper medium term decline to 61.8% retracement at 125.25.
AUD/USD Daily Report
Daily Pivots: (S1) 0.6350; (P) 0.6366; (R1) 0.6388; More...
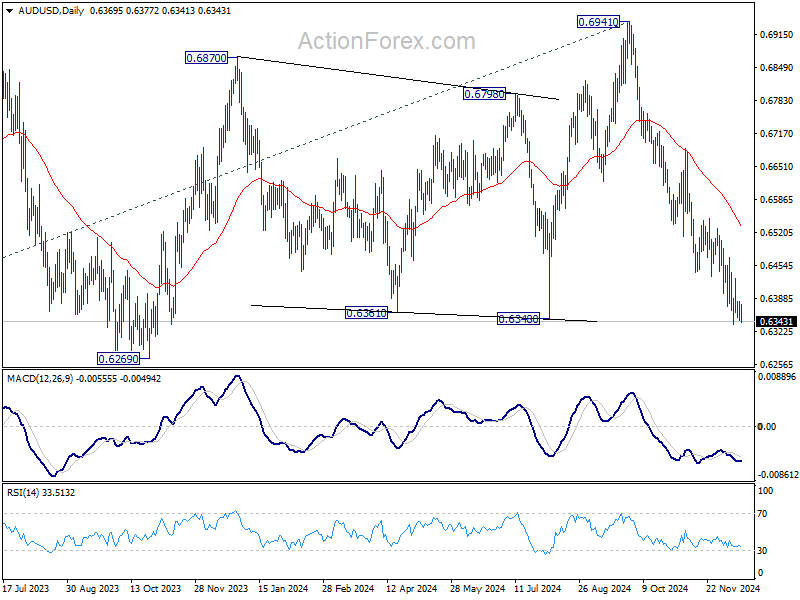
AUD/USD is staying in range above 0.6336 temporary low and intraday bias stays neutral. More consolidations would be seen and another recovery cannot be ruled out. But outlook will stay bearish as long as 55 D EMA (now at 0.6533) holds. Below 0.6336 will resume the fall from 0.6941 to 0.6269 support next.
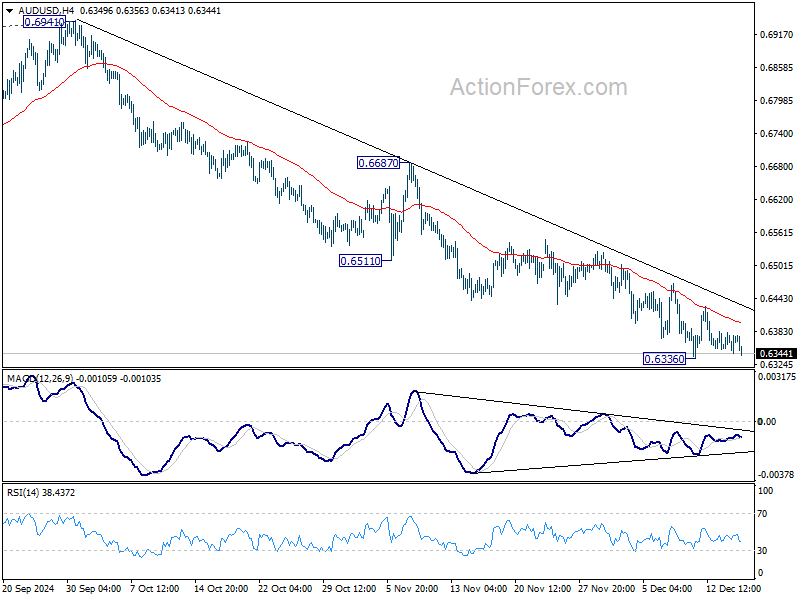
In the bigger picture, price actions from 0.6169 (2022 low) are seen as a medium term consolidation to the down trend from 0.8006. More sideway trading could be seen above 0.6169, but overall outlook will stay bearish as long as 0.6941 resistance holds. Firm break of 0.6169 will resume the down trend to 61.8% projection of 0.8006 to 0.6169 from 0.6941 at 0.5806 next.
EURGBP Elliott Wave Analysis: Decline Forecast from Equal Legs Area
Hello, fellow traders. In this technical article, we’ll take a quick look at the Elliott Wave charts for the EURGBP forex pair, published in the members’ area of the website.
As our members know, EURGBP is showing incomplete bearish sequences, suggesting further decline. The pair recently gave us a bounce in a 3-wave pattern, with sellers appearing right at the equal legs zone. Let’s break down our Elliott Wave forecast further in this article.
EURGBP H1 Asia Update 12.15.2024
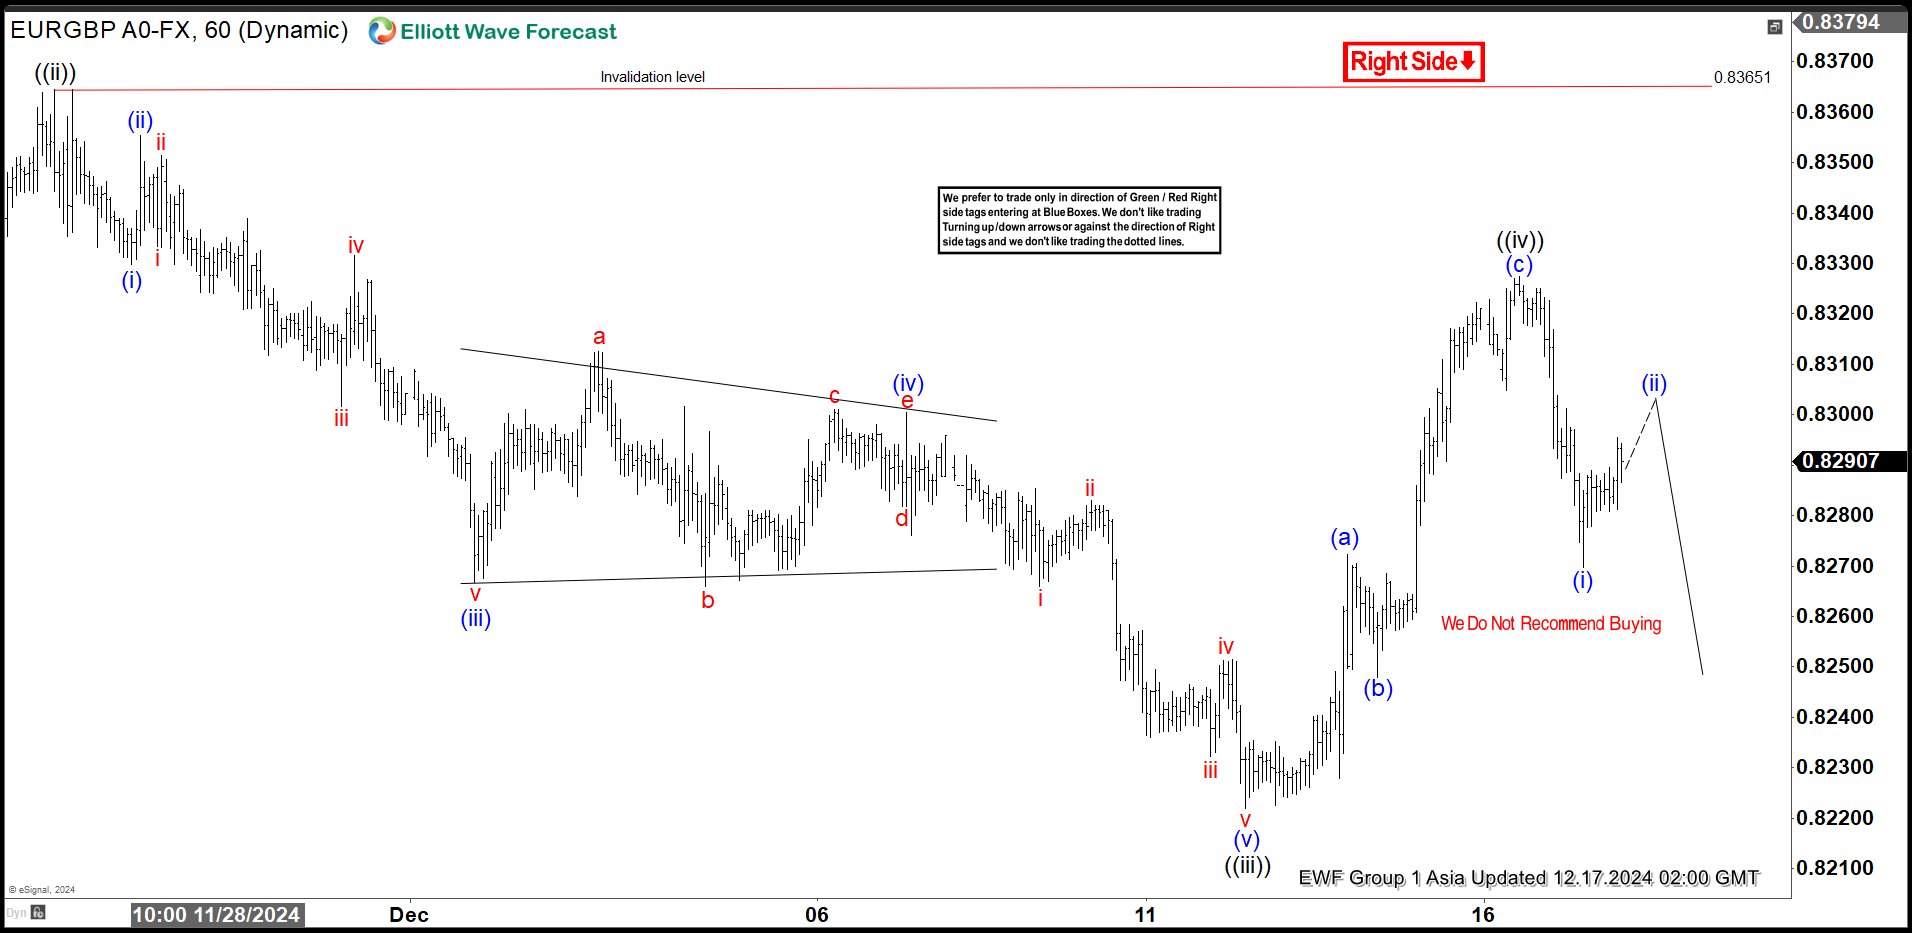
The current view suggests that EURGBP is doing a ((iv)) recovery, which is correcting the cycle from the 0.83651 peak. Proposed recovery can be unfolding as a Elliott Wave Zig Zag Pattern. The price has already reached important technical area at 0.82989- 0.83301. ( sellers zone). We expect potential sellers to appear in this area, which could lead to a further decline towards new lows or a three-wave pull back at least.
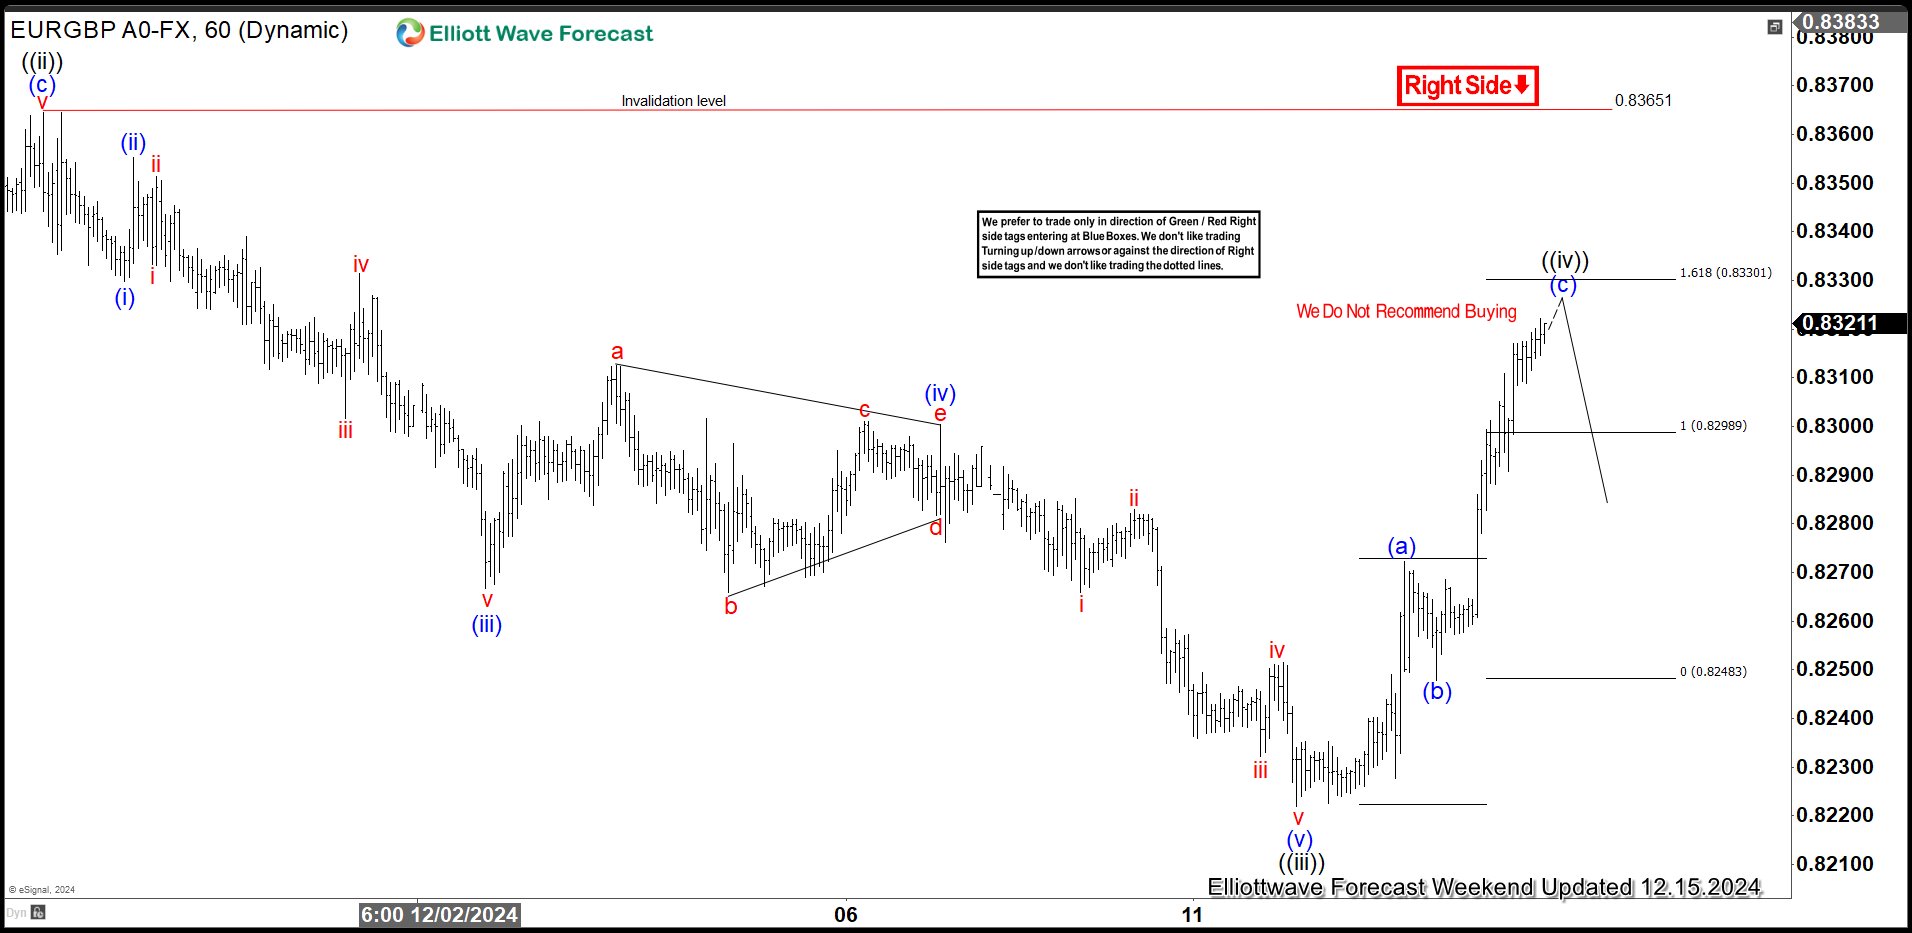
EURGBP H1 Asia Update 12.17.2024
EURGBP has found sellers as expected and made a nice decline from the Equal Legs zone. Current analysis suggests the wave ((iv)) correction has completed at the 0.83278 high. We are looking for a break of previous ((iii)) black low as confirmation wave ((v)) is in progress. We advise against buying EURGBP in during any suggested bounce and favor the short side.
Canada’s Minority Government on the Brink of Collapse
Markets
Yesterday’s PMI releases in Europe and the US confirmed the ongoing divergence in growth on both sides of the Atlantic, cementing market expectations on similar divergence in Fed and ECB policy. The S&P global US flash PMI showed output growth at the end of the year at a 33-month high (56.6 from 54.9) amid a service sector surge. Manufacturing remains in contraction territory (PMI at 48.3 from 49.7). US firms expectations’ of output in the coming year also reached the highest level in two-and-a-halve years, also driven by services. This translated in higher employment for the first time in five months. At the same time, price pressures cooled further, with prices charged rising at the slowest level since they started to rise in June 2020. This excellent report was no reason at all for markets to change expectations on Fed policy going forward. US yields changed less than 1 bp across the curve. Earlier yesterday, EMU PMI’s showed activity contracting for the second month in a row, but at a slower pace (49.5 from 48.3), with services retuning in positive territory. However, orders and employment continued to decline. Despite poor activity, EMU costs continue to rise mainly due to higher wages in the services sector. Despite this stagflationary context, ECB members including Chair Lagarde and board member Schnabel indicated the ECB will be able to cut interest rates further as confidence is growing that inflation is on track to reach the 2.0% goal. ECB’s Wunsch in an interview was reported that the ECB broadly feels comfortable with current market pricing. After last week’s ‘rebound’ German yields declined up to 2 bps at the short end of the curve. The dollar briefly spiked higher after the strong US PMI, but gains could not be sustained (DXY close 106.85 from 106.98, EUR/USD 1.0512 from 1.0495). Sterling regained part of Friday’s setback despite a mixed PMI report (EUR/GBP close 0.829 from 0.831).
Today’s US November retail sales are expected to confirm a decent momentum in spending (0.6% M/M headline 0.4% M/M control group). The report most likely is no game-charge but might confirm that the Fed has time to assess upcoming developments and shouldn’t be in a hurry to cut rates further after tomorrow’s expected 25 bps reduction. In EMU/Germany ZEW and IFO confidence are expected to confirm the lackluster picture from yesterday’s PMI’s. Both US and EMU short-term yields might have reached a short-term equilibrium. The US 2-y yield (4.25%) hovers in the middle of the ST 4.08%/4.38% trading range. The EMU 2-y swap (2.19%) end last week rebounded off the 2.05%/2.0% support area, but there is no reason for markets to already raise the bottom of the ECB rate cut cycle near 1.75% that is currently discounted. So further upside in EMU ST yields might be limited for now. The dollar recently showed no clear trend, but its downside probably remains well protected. At the time of finishing this report, higher than expected UK wage/earnings data (5.2% Y/Y) trigger some further GBP gains (EUR/GBP 0.827).
News & Views
Canada’s minority government is on the brink of collapse after deputy and Finance minister Freeland handed in her resignation, including some parting shots in her resignation letter. The Canadian government is struggling to find a common answer to US president-elect Trump’s 25% tariff threat on Canadian goods. Freeland argues in favour of keeping the fiscal powder dry today, so we have the reserves we may need for a coming tariff war. That means eschewing costly political gimmicks, which we can ill afford and which make Canadians doubt that we recognize the gravity of the moment.” The latter is a snap at Trudeau’s short-term spending on things like tax breaks to please voters. Freeland quits just as she was supposed to give an update on the nation’s fiscal and economic situation. The latter showed a C$62bn deficit in the last fiscal year, way above Freeland’s pledge to keep it below C$40bn. The Loonie weakened further against a stronger dollar with USD/CAD (1.4270) reaching its highest level since Q1 2020.
The French central bank (BdF) lowered its growth outlook for next year and for 2026 to 0.9%-1.3% from 1.2%-1.5% in September. The uncertain political context is dampening consumer and business confidence. The BdF thinks that household spending will only accelerate moderately after being lackluster in 2024 and that the contribution from investment will remain negative. A study by the central bank showed that relying on the emergency legislation currently being debated in parliament to continue to function with taxes remaining unchanged and minimal spending from Jan 1st would significantly increase next year’s budget deficit (from an estimated 6.1% of GDP this year).
USD/CAD Daily Outlook
Daily Pivots: (S1) 1.4217; (P) 1.4244; (R1) 1.4272; More...
USD/CAD's up trend continues today and intraday bias stays on the upside. Next target is 1.4391 projection level. On the downside, break of 1.4208 minor support will turn intraday bias neutral again first, and bring deeper pull back to channel support (now at 1.4114). Considering bearish divergence condition in 4H MACD, firm break of the channel support will indicate short term topping and bring deeper correction.

In the bigger picture, up trend from 1.2005 (2021) is in progress. Next target is 61.8% projection of 1.2401 to 1.3976 from 1.3418 at 1.4391. Medium term outlook will remain bullish as long as 55 W EMA (now at 1.3706) holds, even in case of deep pullback.

Sterling Holds Firm on Strong Wages Growth, GBP/CHF Upside Breakout
Sterling remains resilient, as supported by UK employment data indicating that wages remain robust. This development aligns with improved conditions in the UK’s services sector, as seen in yesterday’s PMI release, and suggests that underlying price pressures have not diminished despite growing pessimism tied to the Autumn Budget’s uncertainty. Markets maintain near-zero expectations for a BoE rate cut at this week’s meeting, keeping the outlook for monetary easing firmly anchored in the future. Current pricing indicates around a 75% probability of a rate reduction by February, followed by a base case of four 25bps cuts in 2025. The latest figures do not alter these expectations, leaving Sterling well-supported for now.
Elsewhere in currency markets, the Swiss franc is the weakest performer so far this week, extending its decline after last week’s surprise 50bps rate cut by SNB. With persistent deflationary pressures, SNB is likely to maintain its loosening bias into next year, with zero rates now a plausible scenario as the easing cycle progresses. The Franc’s weakness is accompanied by Yen, which remains under pressure from rising US and European benchmark yields, while Canadian Dollar trails as the third worst performer.
Meanwhile, New Zealand dollar emerges as the second strongest currency, following the Pound. Dollar takes third place, awaiting the upcoming FOMC decision, where a “hawkish cut” is anticipated. Such a move would imply a pause at the next Fed meeting and a more measured pace of easing through the coming year. Euro and Australian Dollar occupy the middle ground. Notably, Aussie shows little response to reports of China targeting around 5% economic growth next year, indicating market fatigue with repeated "verbal" commitments from Beijing.
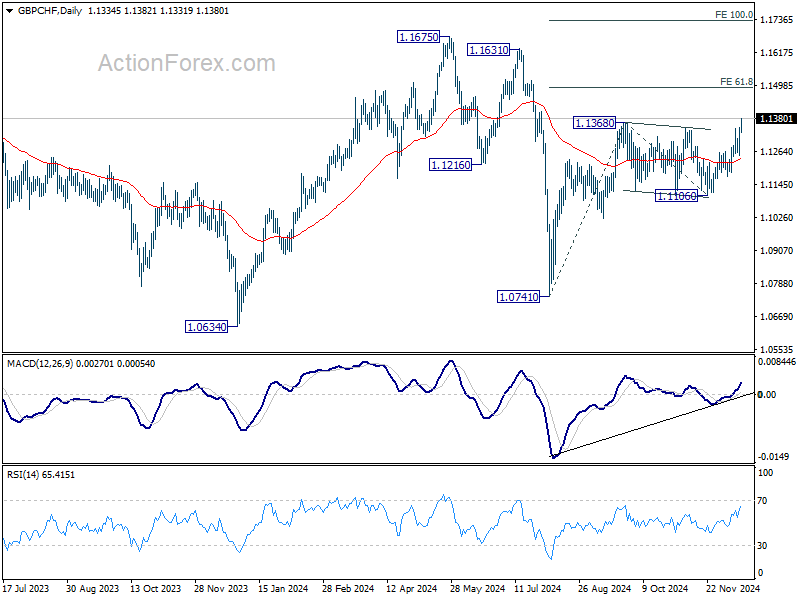
Technically, GBP/CHF finally breaks through 1.1368 resistance to resume the rally from 1.0741 (August low). Near term outlook will now stay bullish as long as 55 D EMA (now at 1.1233) holds. Next target is 61.8% projection of 1.0741 to 1.1368 from 1.1106 at 1.1493. Decisive break there could prompt upside acceleration through 1.1675 (2024 high) to 100% projection at 1.1733 in the medium term.
Looking ahead, the European session will feature the release of Germany’s Ifo Business Climate and ZEW Economic Sentiment data, as well as the Eurozone trade balance. Later in the North American session, attention will shift to Canada’s CPI data and US retail sales.
UK job numbers decline, but wage growth remains elevated
UK labor market showed signs of softening in November, with payrolled employment falling by -35k or -0.1% mom to 30.4m. Meanwhile, median monthly pay growth slowed to 6.3% yoy, down sharply from 7.9% yoy in the prior month.
In the three months to October, employment rate edged up by 0.1% to 74.9%, while the unemployment rate also increased slightly to 4.3%, up by 0.1%. Economic inactivity rate fell by -0.2% to 21.7%, suggesting some progress in bringing inactive workers back into the labor force.
Wage growth remained robust overall, with average earnings excluding bonuses rising 5.2% yoy in the three months to October, up from 4.9% yoy in the previous month. Including bonuses, average earnings also grew by 5.2% yoy, accelerating from 4.4% yoy. This uptick in earnings may keep pressure on BoE, as policymakers balance moderating inflation with still-elevated wage growth.
Australia Westpac consumer sentiment falls as economic outlook worsens
Australian Westpac Consumer Sentiment Index declined -2.0% mom to 92.8 in December. The drop was driven by a sharp deterioration in economic expectations. The economic outlook, next 12 months sub-index fell -9.6% mom to 91.2, while the economic outlook, next 5 years dropped -7.9% to 95.9 mom, erasing nearly half of the gains from the past two months.
Westpac noted that while RBA has expressed growing confidence in inflation returning to its 2-3% target range, the latest sentiment data highlights lingering consumer uncertainty. Concerns about labor market slack and weak productivity growth continue to complicate the inflation outlook.
Looking ahead, RBA is expected to maintain its current policy stance at its February meeting, absent a significant downside surprise in inflation. Westpac anticipates the easing cycle will begin in May 2025, once clearer evidence of slowing inflation and stable labor conditions emerges.
USD/CAD Daily Outlook
Daily Pivots: (S1) 1.4217; (P) 1.4244; (R1) 1.4272; More...
USD/CAD's up trend continues today and intraday bias stays on the upside. Next target is 1.4391 projection level. On the downside, break of 1.4208 minor support will turn intraday bias neutral again first, and bring deeper pull back to channel support (now at 1.4114). Considering bearish divergence condition in 4H MACD, firm break of the channel support will indicate short term topping and bring deeper correction.
In the bigger picture, up trend from 1.2005 (2021) is in progress. Next target is 61.8% projection of 1.2401 to 1.3976 from 1.3418 at 1.4391. Medium term outlook will remain bullish as long as 55 W EMA (now at 1.3706) holds, even in case of deep pullback.