Sample Category Title
USD/JPY Mid-Day Outlook
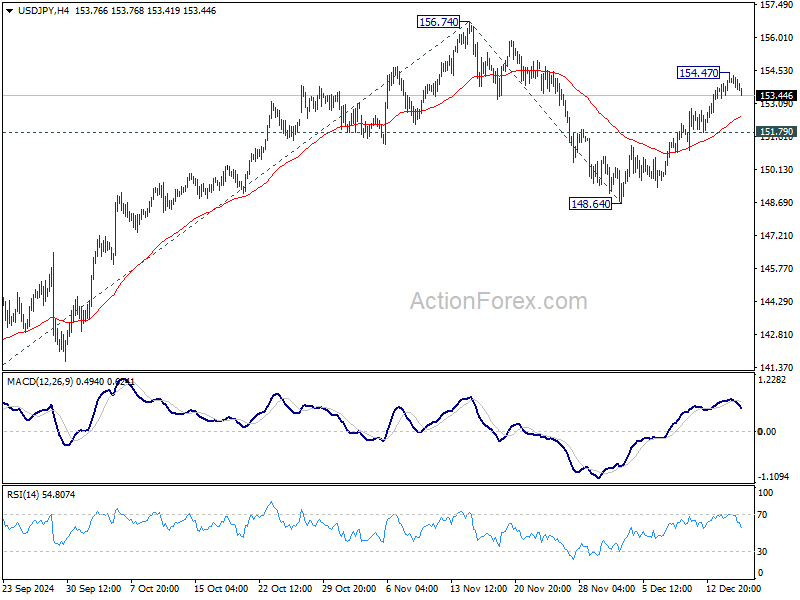
Daily Pivots: (S1) 153.50; (P) 153.99; (R1) 154.65; More...
Intraday bias in USD/JPY is turned neutral with current retreat and some consolidations would be seen below 154.47 temporary top. Further rally is expected as long as 151.79 minor support holds. Above 154.47 will target a retest on 156.74 high first. Firm break there will resume whole rally from 139.57, and target 61.8% projection of 139.57 to 156.74 from 148.64 at 159.25 next. However, break of 151.79 will turn bias back to the downside for 148.64 support next.
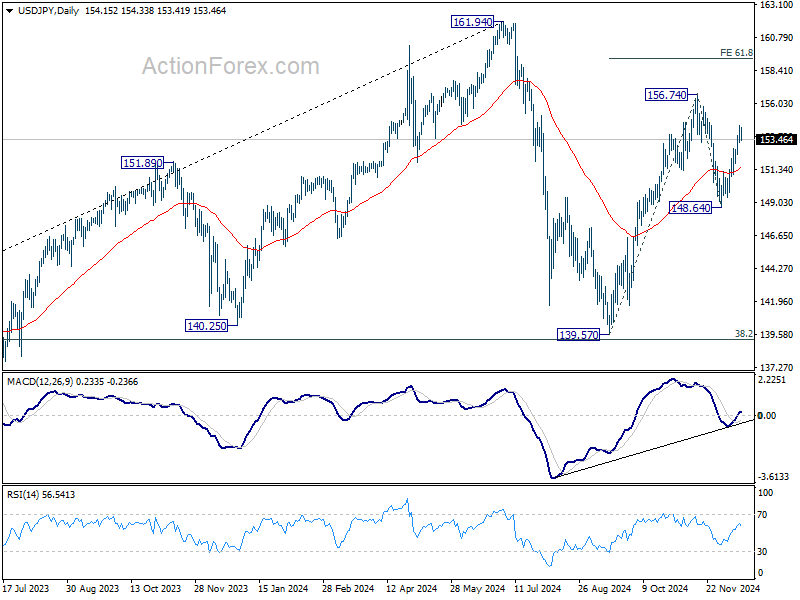
In the bigger picture, price actions from 161.94 are seen as a corrective pattern to rise from 102.58 (2021 low). The range of medium term consolidation should be set between 38.2% retracement of 102.58 to 161.94 at 139.26 and 161.94. Nevertheless, sustained break of 139.26 would open up deeper medium term decline to 61.8% retracement at 125.25.
USD/CAD Mid-Day Outlook
Daily Pivots: (S1) 1.4217; (P) 1.4244; (R1) 1.4272; More...
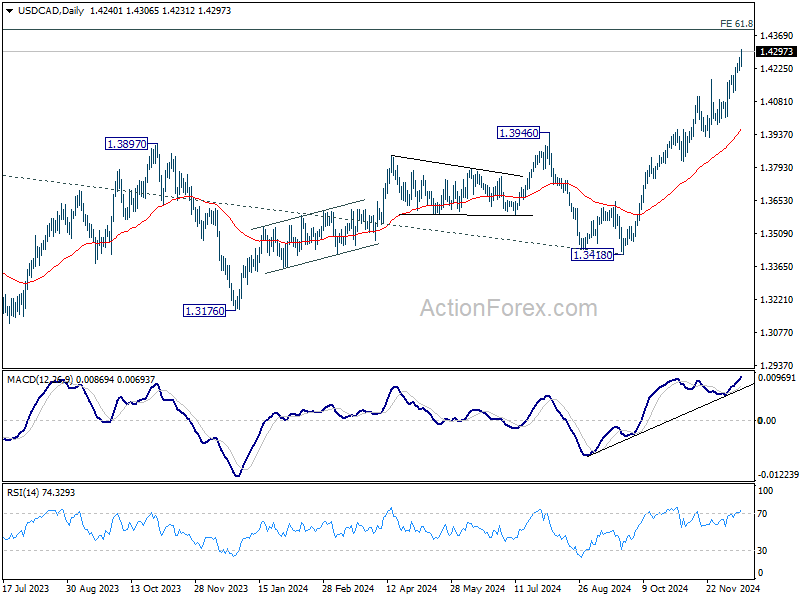
Canadian Dollar edged up slightly in early US session and intraday bias remains on the upside. Current up trend should target 1.4391 projection level. On the downside, break of 1.4208 minor support will turn intraday bias neutral again first, and bring deeper pull back to channel support (now at 1.4114). Considering bearish divergence conditio in 4H MACD, firm break of the channel support will indicate short term topping and bring deeper correction.
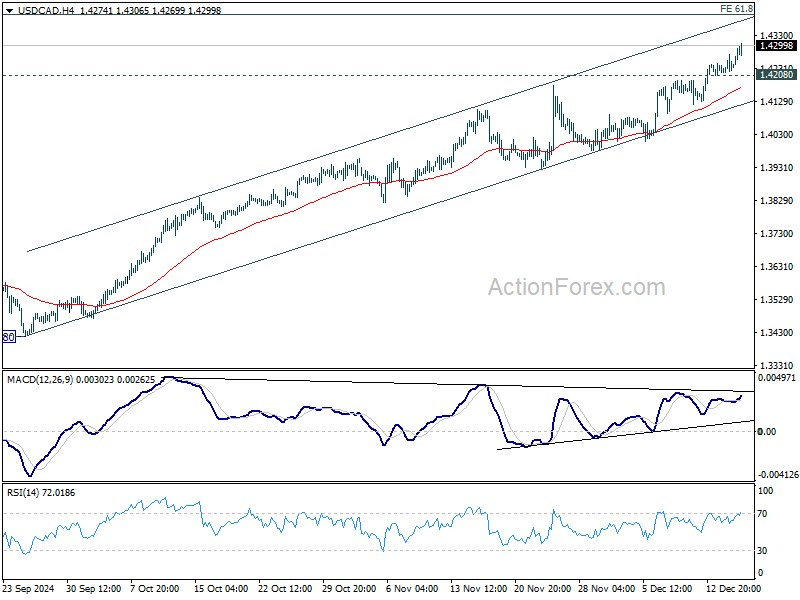
In the bigger picture, up trend from 1.2005 (2021) is in progress. Next target is 61.8% projection of 1.2401 to 1.3976 from 1.3418 at 1.4391. Medium term outlook will remain bullish as long as 55 W EMA (now at 1.3706) holds, even in case of deep pullback.
Canadian Dollar Weakens on CPI; Dollar Firm After Retail Sales
Canadian Dollar trades broadly lower today while commodity currencies are generally soft. Canada's CPI report reinforced the outlook of stable inflation hovering around target. BOC has likely completed its aggressive rate-cutting phase and pauses in policy easing are anticipated at some meetings next year. Nonetheless, the direction remains clear: further rate reductions are expected to move interest rates deeper into the neutral zone. Adding to the pressure, weaker Asian stock market performance overnight weighed on other commodity-linked currencies, Australian Dollar and New Zealand Dollar.
In contrast, Dollar is slightly firmer following stronger-than-expected US retail sales. The data underscores continued resilience in consumer spending, and together with a robust labor market, Fed is under no pressure to accelerate its rate-cutting cycle. Markets now widely expect tomorrow’s FOMC decision to reinforce a slower pace of easing for 2025, reflecting the central bank’s cautious stance.
Overall for the week so far, Sterling is currently strongest performer, supported by strong wage growth in today's UK job market report. The pound now turns its focus to tomorrow’s UK CPI release and Thursday’s BoE rate decision for further cues. Meanwhile, New Zealand Dollar holds second place, followed by Euro. At the bottom, Canadian Dollar continues to struggle, joined by Swiss Franc and Australian Dollar. Yen and the greenback are mixed in the middle.
In Europe, at the time of writing, FTSE is down -0.69%. DAX is down -0.20%. DAX is up 0.11%. UK 10-year yield is up 0.055 at 4.500. Germany 10-year yield is down -0.024 at 2.225. Earlier in Asia, Nikkei fell -0.24%. Hong Kong HSI fell -0.48%. China Shanghai SSE fell -0.73%. Singapore Strait Times fell -0.55%. Japan 10-year JGB yield rose 0.0055 at 1.077.
US retail sales rises 0.7% mom in Nov, ex-auto sales up 0.2% mom
US retail sales climbed 0.7% mom to USD 724.6B in November, surpassing market expectations of 0.5% and highlighting robust consumer activity as the holiday shopping season gained momentum. However, the details reveal a mixed picture.
Excluding autos, sales grew by 0.2% mom, which was in line with expectations, reaching USD 583.9B. Meanwhile, sales excluding gasoline rose 0.7% mom to USD 673.1B. When excluding both autos and gasoline, sales also increased modestly by 0.2% mom to USD 532.4B, indicating steady but tempered spending patterns in core retail categories.
On a broader scale, total sales for the September through November period rose 2.9% yoy.
Canada's CPI slows to 1.9% in Nov, with broad-based deceleration
Canada’s headline CPI slowed to 1.9% yoy in November, dipping below expectations of 2.0% yoy and down from 2.0% yoy in October. The deceleration was broad-based, with declines in travel tour prices and the mortgage interest cost index contributing significantly to the slower pace of inflation.
Excluding gasoline, the CPI rose 2.0% yoy, cooling from October’s 2.2% yoy. On a month-over-month basis, inflation was flat in November, following a 0.4% mom increase in the prior month.
While headline inflation eased, Canada’s core inflation measures sent mixed signals. CPI median increased slightly from 2.5% yoy to 2.6% yoy (above forecasts of 2.4% yoy). CPI trimmed climbed from 2.6% yoy to 2.7% yoy (also exceeding expectations of 2.5% yoy). However, CPI common, the measure often considered the most stable, declined from 2.2% yoy to 2.0% yoy, missing the anticipated 2.1% yoy.
ECB's Rehn: EU can bolster negotiation stance with prepared countermeasures on US tariffs
Finland's ECB Governing Council member Olli Rehn highlighted growing risks to Europe’s economic outlook with the uncertainty over trade policy as a key downside factor.
Rehn warned that Europe must be prepared to respond to potential trade conflicts with the US, emphasizing that while “negotiation is preferable,” EU’s position could be strengthened by demonstrating readiness to implement “countermeasures” against any US tariff threats.
Rehn also provided clarity on ECB’s monetary policy direction, stating it is now clearly leaning toward further easing. However, the “speed and scale of rate cuts” will remain data-dependent and decided at each meeting based on a thorough assessment of economic developments.
Eurozone goods exports rise 2.1% yoy in Oct, imports up 3.2% yoy
Eurozone goods exports rose 2.1% yoy to EUR 254.0B in October. Goods imports rose 3.2% yoy to EUR 247.2B. Trade balance stood at EUR 6.8B surplus. Intra-Eurozone trade rose 2.2% yoy to EUR 229.2B.
In seasonally adjusted term, exports fell -1.6% mom to EUR 232.5B. Imports rose 1.3% mom to EUR 226.5B. Trade surplus narrowed from EUR 12.6B in September to EUR 6.1B, versus expectation of EUR 11.9B. Intra-Eurozone trade fell -0.6% mom to EUR 213.5B.
ZEW sentiment surges on ECB rate cut optimism and German policy hope
The December ZEW Economic Sentiment survey delivered a notable improvement in outlook for both Germany and the Eurozone, driven by optimism surrounding interest rate cuts and policy shifts.
German ZEW Economic Sentiment index surged to 15.7 from 7.4, far exceeding expectations of 7.0. However, Current Situation Index continued to deteriorate, slipping further to -93.1 from -91.4, reflecting ongoing economic weakness in the near term.
Eurozone ZEW Economic Sentiment also showed a strong uptick, rising to 17.0 from 11.6. Yet, the Current Situation Index revealed a sharper decline, falling 11.2 points to -55.0.
ZEW President Achim Wambach attributed the improved sentiment to expectations of economic policies favoring private investment, particularly as Germany approaches snap elections.
Additionally, growing confidence in further ECB interest rate cuts next year has bolstered the outlook. Wambach noted that survey respondents remain unconcerned about inflation, suggesting the recent uptick is viewed as “a temporary phenomenon” and inflation rates are expected to stabilize or decline in 2025.
Germany Ifo business climate falls to 84.7, weakness becoming chronic
German Ifo Business Climate Index declined to 84.7 in December, missing expectations of 85.6 and falling from 85.7 in November. This drop highlights persistent economic challenges in Europe’s largest economy, with sentiment continuing to slide amid growing uncertainty. While Current Assessment Index surprised to the upside, rising to 85.1 (above forecasts of 84.0), Expectations Index fell sharply fro 87.0 to 84.4, undershooting the anticipated 87.5.
Sectoral data painted a concerning picture. Sentiment in manufacturing dropped further, from -22.0 to -24.8. Services sector weakened from -3.5 to -5.6. Trade saw a sharper decline from -26.6 to -29.5. Meanwhile, the only bright spot came from construction, where sentiment improved from -29.0 to -26.1, though it remains firmly in negative territory.
The Ifo Institute underscored the gravity of the situation, warning that “the weakness of the German economy has become chronic.”
UK job numbers decline, but wage growth remains elevated
UK labor market showed signs of softening in November, with payrolled employment falling by -35k or -0.1% mom to 30.4m. Meanwhile, median monthly pay growth slowed to 6.3% yoy, down sharply from 7.9% yoy in the prior month.
In the three months to October, employment rate edged up by 0.1% to 74.9%, while the unemployment rate also increased slightly to 4.3%, up by 0.1%. Economic inactivity rate fell by -0.2% to 21.7%, suggesting some progress in bringing inactive workers back into the labor force.
Wage growth remained robust overall, with average earnings excluding bonuses rising 5.2% yoy in the three months to October, up from 4.9% yoy in the previous month. Including bonuses, average earnings also grew by 5.2% yoy, accelerating from 4.4% yoy. This uptick in earnings may keep pressure on BoE, as policymakers balance moderating inflation with still-elevated wage growth.
Australia Westpac consumer sentiment falls as economic outlook worsens
Australian Westpac Consumer Sentiment Index declined -2.0% mom to 92.8 in December. The drop was driven by a sharp deterioration in economic expectations. The economic outlook, next 12 months sub-index fell -9.6% mom to 91.2, while the economic outlook, next 5 years dropped -7.9% to 95.9 mom, erasing nearly half of the gains from the past two months.
Westpac noted that while RBA has expressed growing confidence in inflation returning to its 2-3% target range, the latest sentiment data highlights lingering consumer uncertainty. Concerns about labor market slack and weak productivity growth continue to complicate the inflation outlook.
Looking ahead, RBA is expected to maintain its current policy stance at its February meeting, absent a significant downside surprise in inflation. Westpac anticipates the easing cycle will begin in May 2025, once clearer evidence of slowing inflation and stable labor conditions emerges.
USD/CAD Mid-Day Outlook
Daily Pivots: (S1) 1.4217; (P) 1.4244; (R1) 1.4272; More...
Canadian Dollar edged up slightly in early US session and intraday bias remains on the upside. Current up trend should target 1.4391 projection level. On the downside, break of 1.4208 minor support will turn intraday bias neutral again first, and bring deeper pull back to channel support (now at 1.4114). Considering bearish divergence conditio in 4H MACD, firm break of the channel support will indicate short term topping and bring deeper correction.
In the bigger picture, up trend from 1.2005 (2021) is in progress. Next target is 61.8% projection of 1.2401 to 1.3976 from 1.3418 at 1.4391. Medium term outlook will remain bullish as long as 55 W EMA (now at 1.3706) holds, even in case of deep pullback.
US: Retail Sales Remain Solid in November, Boosted by Strong Vehicle Sales
Retail sales rose 0.7% month-on-month (m/m) in November, an acceleration from the upwardly revised October's gain of 0.5%, and ahead of the consensus forecast calling for an increase of 0.6% m/m.
Much of the last month's growth in retail trade was due to a sizeable increase in sales of vehicles and parts, which rose by 2.6% m/m. Sales at gasoline stations edged up just 0.1%, weighed down by lower prices at the pump. Sales at the building materials and equipment stores increased for the sixth consecutive month (+0.4%).
Sales in the "control group", which excludes the volatile components above (i.e., gasoline, autos and building supplies) and is used in the estimate of personal consumption expenditures (PCE), rose 0.3% m/m, an acceleration relative to 0.1% gain in October.
Sales at non-store retailers increased by 1.8% and were up 9.7% on a year-over-year basis, making it the fastest growing category. Online sales continue to increase as a share of total sales, reaching 20% in November. In contrast, sales growth was soft at the general merchandize stores (-0.1%), with weakness concentrated in department store sales (-0.6%).
Food services & drinking places – the only services category in the retail sales report – declined by 0.4%. October's data was revised up to 0.9% (previously 0.7%).
Key Implications
U.S. consumers are finishing 2024 in strong financial shape. A rally in equity markets and gains in home prices have bolstered household wealth. While job growth has slowed, the labor market remains healthy and continues to generate jobs. Consumer confidence has also improved, especially following Trump's election victory, with the prospect of lower taxes lifting households' spirits. For this quarter, we expect inflation-adjusted consumer spending to increase by 3% (annualized), a small step down from 3.5% in Q3 but still strong growth.
Inflation, however, remains an issue. Nominal retail sales are up 3.8% from the year ago but the picture looks less upbeat after adjusting for inflation, with sales up just 1%. The latest uptick in inflation reaffirmed that progress in bringing inflation lower is stalling, and the coming year could bring more inflationary surprises, due to potential tax cuts, tariffs, and changes in immigration policy. These factors would likely prompt the Fed proceeding more cautiously next year, leading to higher interest rates for consumers than otherwise would be the case. Along with a slowing labor market, these are some of the reasons why we expect consumer spending to moderate to a trend-like pace of 2% next year (forecast).
Canadian Inflation Cools Slightly in November
Headline CPI inflation cooled to 1.9% year-on-year (y/y) in November, one tick softer than expected.
Slower price growth was broad based across the eight major components. The one exception was transportation costs which rose to 1.1% y/y, from 0.3% in October.
Shelter inflation has been a key challenge for Canadians for some time now and cooled in November to 4.6% y/y, from 4.8% y/y in October. Mortgage interest costs were a key factor, as the year-on-year increased slowed from 14.7% to 13.2% y/y in November. Unfortunately, rent inflation continues to heat up, rising 7.7% y/y in November, up from 7.3% y/y in October.
The Black Friday deals were particularly good this year, keeping goods inflation flat both on the month and versus a year ago. Deals were to be had on cellular services (-6.1% m/m), furniture, clothing, and particularly children's clothing.
The impact of Taylor Swift's Eras Tour in Toronto in November was seen in hotel prices, which had their largest November increase ever in Ontario. This drove higher prices for traveller accommodation at the national level (+8.7% y/y). Check out our recent report on the spending impact of the concerts here.
The Bank of Canada's preferred "core" inflation measures were steady at 2.7% y/y on average, matching October's pace.
Key Implications
November's inflation data came in line with the Bank of Canada's expectations for inflation to average close to 2% over the next couple of years. Headline was only a tenth cooler than expected, but this was mitigated by a lack of progress in the Bank of Canada's Core inflation measures.
Our forecast calls for headline inflation to rise somewhat above the Bank's 2% target next year as likely tariffs raise goods costs (see forecast). However, we don't expect that this is high enough to dissuade the BoC from cutting interest rates further. With an America-First agenda south of the border, Canada's economy faces a challenging backdrop, and lower interest rates are required for support. That said, at 3.25% on the overnight rate, we are now at the edge of "neutral" territory, further cuts are expected to come at a more measured pace next year.
US retail sales rises 0.7% mom in Nov, ex-auto sales up 0.2% mom
US retail sales climbed 0.7% mom to USD 724.6B in November, surpassing market expectations of 0.5% and highlighting robust consumer activity as the holiday shopping season gained momentum. However, the details reveal a mixed picture.
Excluding autos, sales grew by 0.2% mom, which was in line with expectations, reaching USD 583.9B. Meanwhile, sales excluding gasoline rose 0.7% mom to USD 673.1B. When excluding both autos and gasoline, sales also increased modestly by 0.2% mom to USD 532.4B, indicating steady but tempered spending patterns in core retail categories.
On a broader scale, total sales for the September through November period rose 2.9% yoy.
Canada’s CPI slows to 1.9% in Nov, with broad-based deceleration
Canada’s headline CPI slowed to 1.9% yoy in November, dipping below expectations of 2.0% yoy and down from 2.0% yoy in October. The deceleration was broad-based, with declines in travel tour prices and the mortgage interest cost index contributing significantly to the slower pace of inflation.
Excluding gasoline, the CPI rose 2.0% yoy, cooling from October’s 2.2% yoy. On a month-over-month basis, inflation was flat in November, following a 0.4% mom increase in the prior month.
While headline inflation eased, Canada’s core inflation measures sent mixed signals. CPI median increased slightly from 2.5% yoy to 2.6% yoy (above forecasts of 2.4% yoy). CPI trimmed climbed from 2.6% yoy to 2.7% yoy (also exceeding expectations of 2.5% yoy). However, CPI common, the measure often considered the most stable, declined from 2.2% yoy to 2.0% yoy, missing the anticipated 2.1% yoy.
Pound Steady After Hot UK Wage Growth, CPI Next
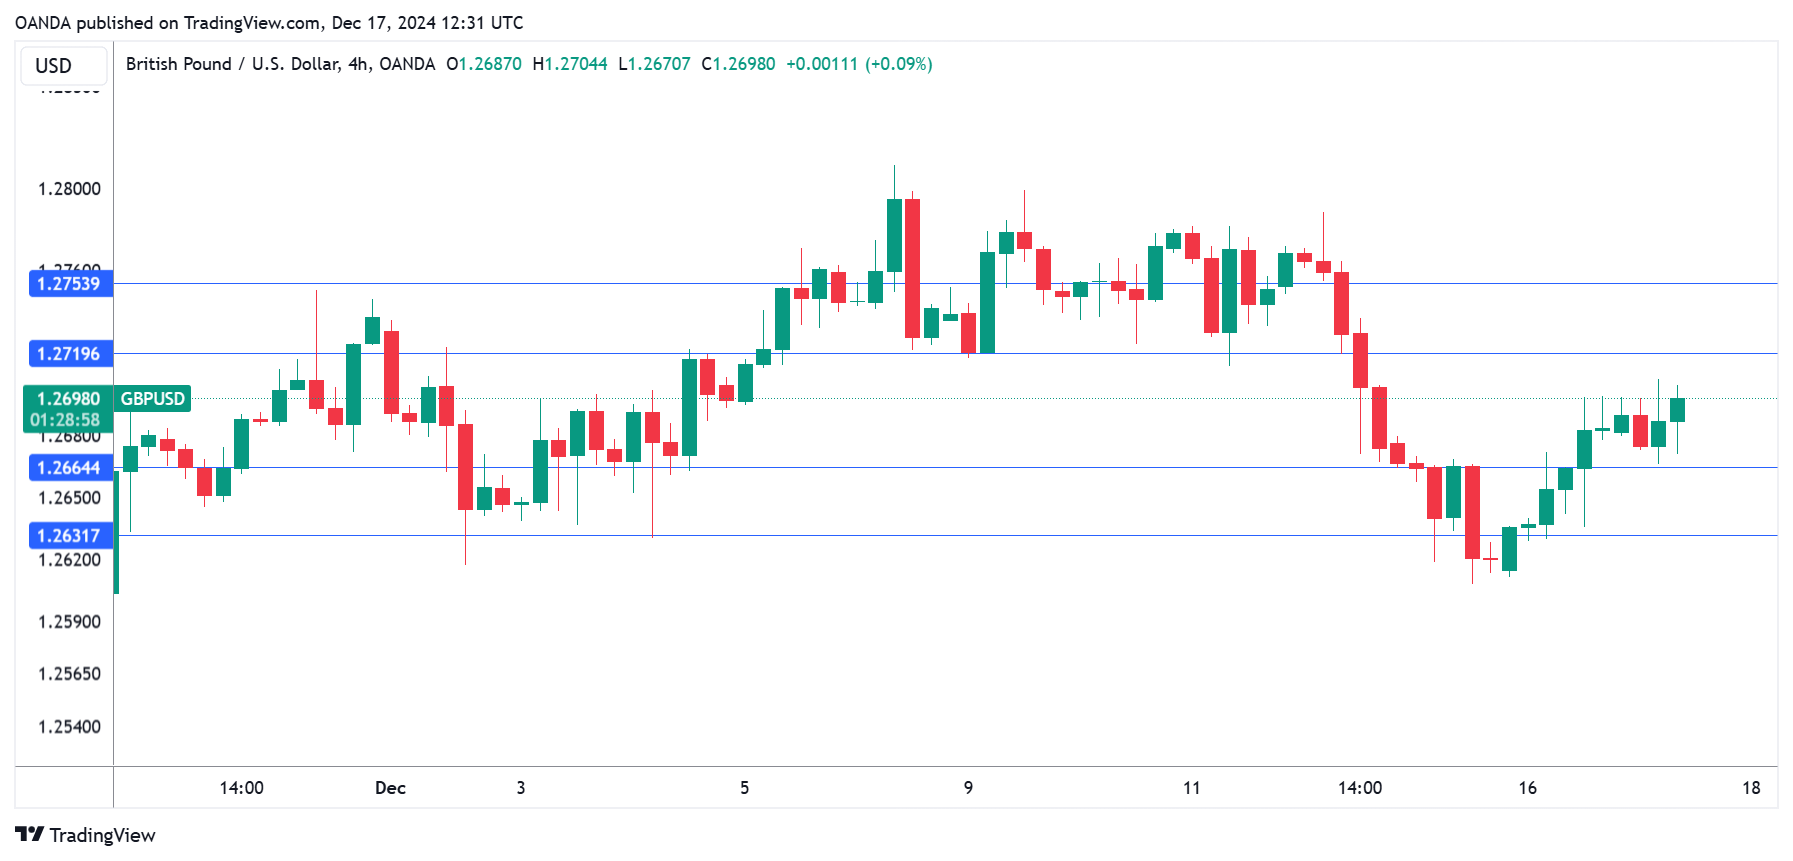
The British pound is showing little movement on Tuesday, after jumping 0.57% a day earlier. In the European session, GBP/USD is trading at 1.2698, up 0.13% on the day.
UK wage growth higher than expected
UK wage growth excluding bonuses climbed 5.2% y/y in the three months to October, up from an upwardly revised 4.4% in the previous period and well above the market estimate or 4.6%. Pay growth in the private sector hit 5.4%, up from 4.6%.
Wage growth has been accelerating and that is a concern for the Bank of England, which is worried about rising inflation. In October, CPI rose to 2.3% y/y, up from 1.7% a month earlier and hit its highest level in six months. November’s inflation report will be released on Wednesday and is expected to accelerate to 2.6%. BoE policymakers will be keenly focused on services inflation, which has been sticky at 5%, much too high for the BoE’s liking.
The BoE is widely expected to maintain the benchmark rate at 4.75% at Thursday’s rate meeting. The central bank lowered rates for a second time this year in November but will want to see inflation fall closer to the 2% target before resuming rate cuts.
November job growth was much better than expected with a gain of 173 thousand in the three months to October. This was lower than the 253 thousand gain in the previous period but blew past the market estimate of -12 thousand. The labor market is cooling but remains in decent shape, which means that the BoE can focus on inflation data for its rate decisions and not worry about the labor market.
In the US, it was a familiar story as services headed higher while manufacturing slipped lower. The Services PMI rose in December to 58.5 from 56.1 in November and above the forecast of 55.7. This was the highest level in over three years as the services economy is showing impressive expansion.
The manufacturing sector is in dreadful shape and weakened to 48.3, down from 49.7 in November and below the market estimate of 49.8. Output and new orders are down as the demand for exports remains weak.
GBP/USD Technical
- 1.2719 is a weak resistance line. Above, there is resistance at 1.2753
- 1.2664 and 1.2630 are the next support levels
ZEW sentiment surges on ECB rate cut optimism and German policy hope
The December ZEW Economic Sentiment survey delivered a notable improvement in outlook for both Germany and the Eurozone, driven by optimism surrounding interest rate cuts and policy shifts.
German ZEW Economic Sentiment index surged to 15.7 from 7.4, far exceeding expectations of 7.0. However, Current Situation Index continued to deteriorate, slipping further to -93.1 from -91.4, reflecting ongoing economic weakness in the near term.
Eurozone ZEW Economic Sentiment also showed a strong uptick, rising to 17.0 from 11.6. Yet, the Current Situation Index revealed a sharper decline, falling 11.2 points to -55.0.
ZEW President Achim Wambach attributed the improved sentiment to expectations of economic policies favoring private investment, particularly as Germany approaches snap elections.
Additionally, growing confidence in further ECB interest rate cuts next year has bolstered the outlook. Wambach noted that survey respondents remain unconcerned about inflation, suggesting the recent uptick is viewed as “a temporary phenomenon” and inflation rates are expected to stabilize or decline in 2025.
Dollar Index Outlook: Prolonged High Fed Rates Expected to Boost Dollar
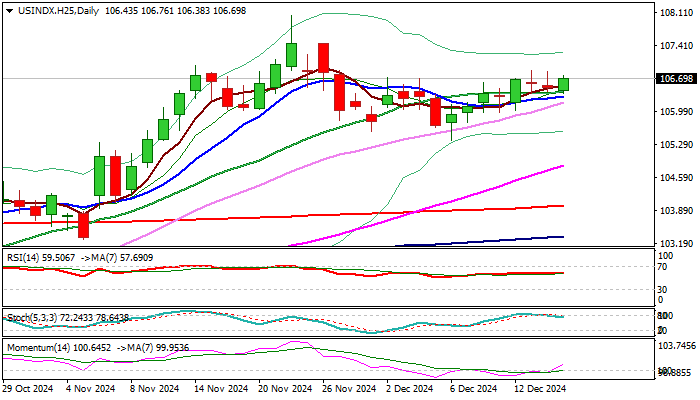
The dollar index firmed in early Tuesday trading and pressuring the peaks of recovery leg from 105.37 (Dec 6 low).
Although last Fri/Mon action was shaped in Doji candles and signaled indecision, this was likely a consolidation before recovery resumes.
Fresh bulls probe through cracked Fibo barrier at 106.71 (50% retracement of 108.04/105.37 pullback) with firm break here to generate fresh signal for continuation of recovery leg towards targets at 107.02 /41 (Fibo 61.8% and 76.4% respectively) guarding key barrier at 108.04 (2024 peak of Nov 22, also the highest since Nov 2022).
Near-term bullish bias is expected to remain intact while the price stays above 10DMA (106.32) and deeper dips stay above 106.00 handle
Technical picture on daily chart is overall bullish and contributes to brighter fundamental outlook, as markets anticipate that US interest rates will remain elevated.
Fed is widely expected to cut interest rates by 25 basis points on Wednesday but will remain very cautious in shaping the monetary policy in the near future, as inflation remains elevated and expected to rise further in anticipated economic boost by Trump’s administration, while US economy remains in good condition overall.
Res: 106.86; 107.02; 107.41; 108.00.
Sup: 106.32; 106.00; 105.75; 105.37.