Sample Category Title
Fed to Likely Cut Rates, But a Pause May Be Around the Corner
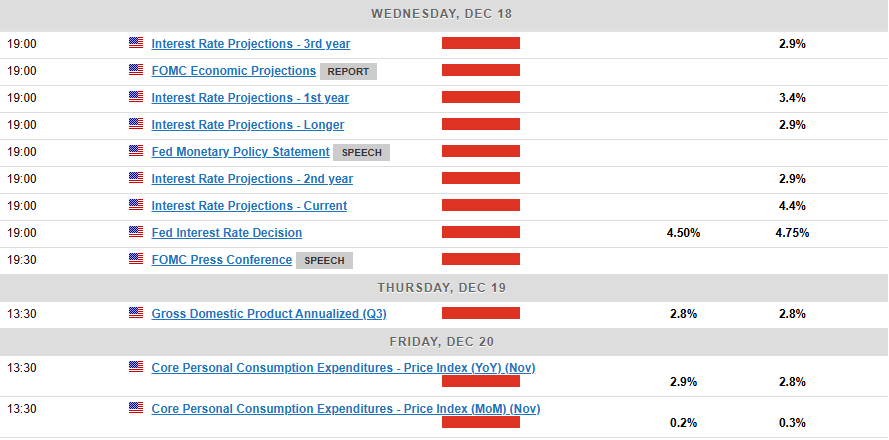
- Fed is widely expected to cut rates by 25 bps on Wednesday
- But updated dot plot may signal fewer cuts in 2025
- Can the dollar extend its rebound or is a correction due?
- Powell’s press conference at 19:30 GMT could hold the key
Rate cut bets have been pared back
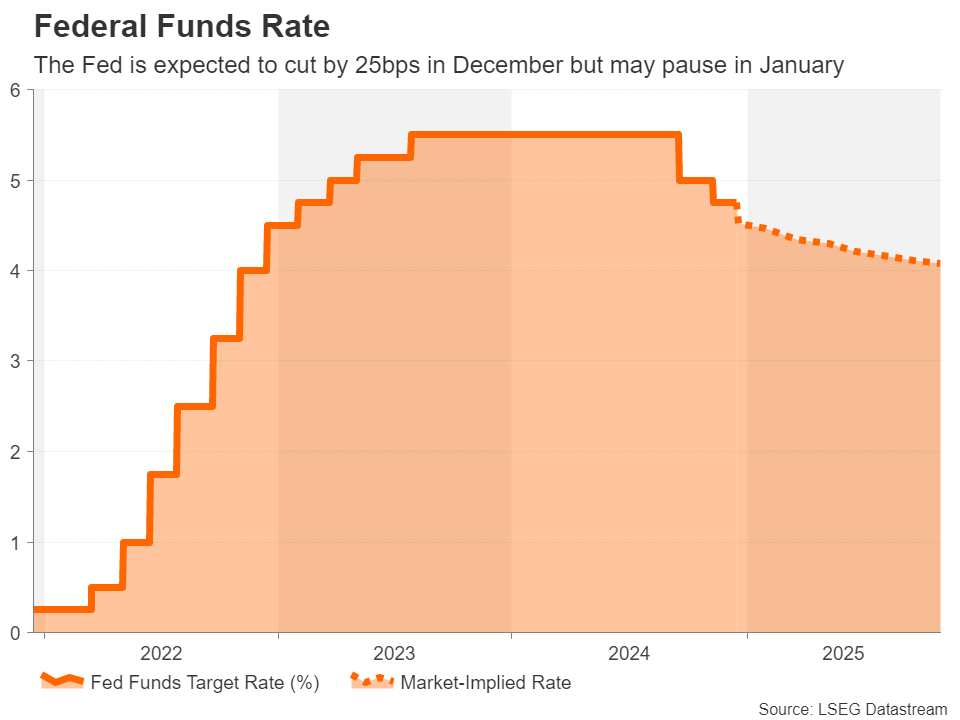
The US Federal Reserve meets this week for the last time in 2024 and it looks set to end the year with its third rate cut since September. However, it’s only in the past week or two that investors have become confident that the central bank will deliver a 25-basis-point reduction in the Fed funds rate when it announces its decision at 19:00 GMT on Wednesday.
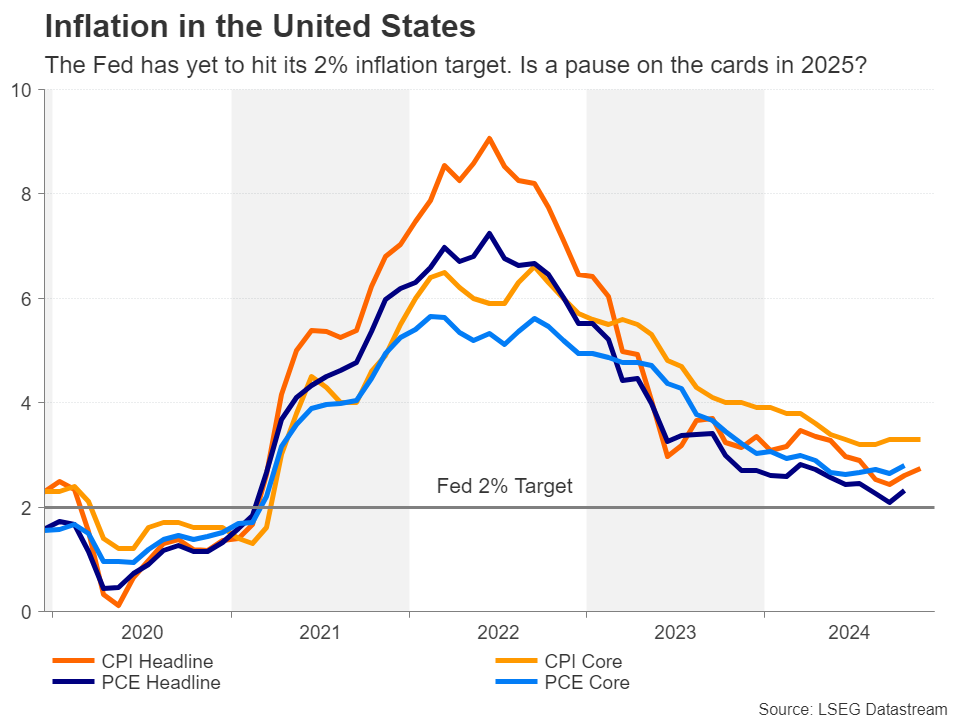
A string of upbeat economic indicators as well as inflation edging higher over the last couple of months, not to mention of course Trump’s election victory, have all led to a drastic repricing of the expected number of rate cuts next year. Donald Trump’s re-election and the implications his policies could have on growth and inflation have complicated the Fed’s interest rate path at a time when the US economy continues to defy fears of a slowdown and underlying price pressures remain sticky.
All eyes on new dot plot
If the Fed does trim rates as expected in December, markets currently foresee just two more 25-bps cuts in 2025. That would be about 50 bps less than what FOMC members predicted in the September dot plot. So, what’s the likelihood that the December dot plot will be revised accordingly?
Most Fed officials backed the case for further rate cuts heading into the blackout period but were split on the size of easing that would be warranted with the inflation picture as it is now. With markets having already done the heavy lifting, policymakers will probably pencil in a similar path as implied by traders.
Will the Fed signal several rate cuts or a pause?
In fact, the risk for the dot plot is tilted toward a dovish surprise as some FOMC members may still be optimistic about inflation coming down substantially in 2025 and therefore being able to cut rates by at least three times. Although, if it’s evident that policymakers based their projections on not making too many assumptions about how inflationary Trump’s policies will be, investors might not be very convinced about a more dovish path.
Hence, Jay Powell’s press conference will be as closely watched as ever for gauging the Fed chief’s and his colleagues’ views on inflation and the economy. Earlier in December, Powell said that the Fed can “afford to be a little more cautious”. He is likely to reiterate that there is no rush to take rates closer to the neutral level.
The question is how strongly he will signal a pause in January and is he going to open the door to a longer pause? The odds that the Fed will stand pat in January currently stand at around 87%.
Dollar could climb to a new 2024 high
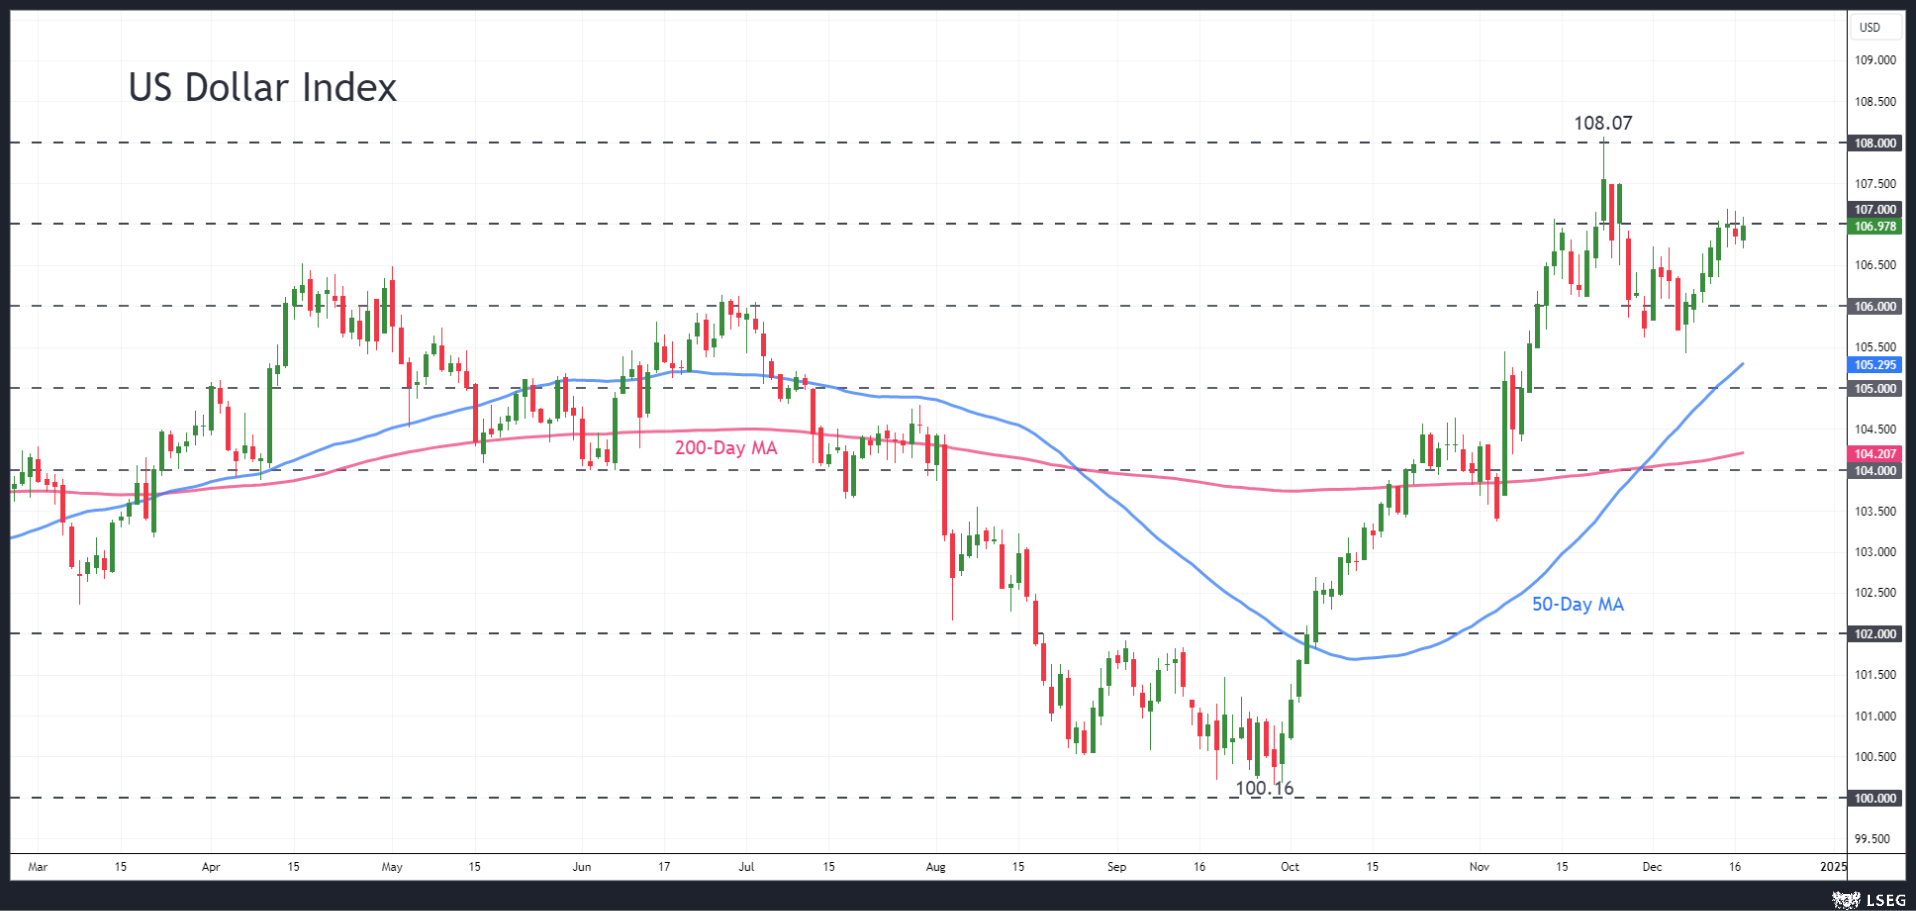
Should Powell remain worried about the prospect of inflation staying above the Fed’s 2% goal and the dot plot is predicting barely two rate cuts in 2025, the US dollar could stretch its recent bounce back. The greenback’s index against a basket of currencies could easily surpass the November 22 high of 108.07 if both Powell and the dot plot are more hawkish than anticipated.
Moreover, if any hawkish rhetoric is followed up with an uptick in the core PCE price index on Friday when the November readings are due, the dollar’s bullish streak could extend even still.
Such a move, though, would have to be backed by a similar rally in Treasury yields and this poses a downside risk for Wall Street.
If, however, Powell adopts a more balanced tone and is hopeful that there will be further progress in reducing inflation in 2025, the dollar index could pull back towards its 50-day moving average near 105.30 before attempting to breach the 105.00 level.
Clouded Outlook
On the whole, the Fed meeting may not change much about the monetary policy outlook, and this may stay the case until some of the cloud for 2025 has been lifted. Specifically, the Fed is unlikely to let its guard down on inflation until it sees that the incoming Trump administration’s policies on taxes and tariffs won’t pose a huge risk to re-igniting inflationary pressures. This means that the dollar’s downside is limited for now.
This could change, however, if the labour market starts to deteriorate unexpectedly over the coming months, in which case, the Fed won’t hesitate to lower borrowing costs even if inflation remains problematic.
BoJ to Hold Rates Amid Uncertainty About Policy Path
- BoJ may leave rates unchanged in December's meeting
- Next rate hike may not come until March
- Policy decision is due on Thursday at 03:00 GMT
- Yen weakness continues
Market consensus overwhelmingly for steady rates
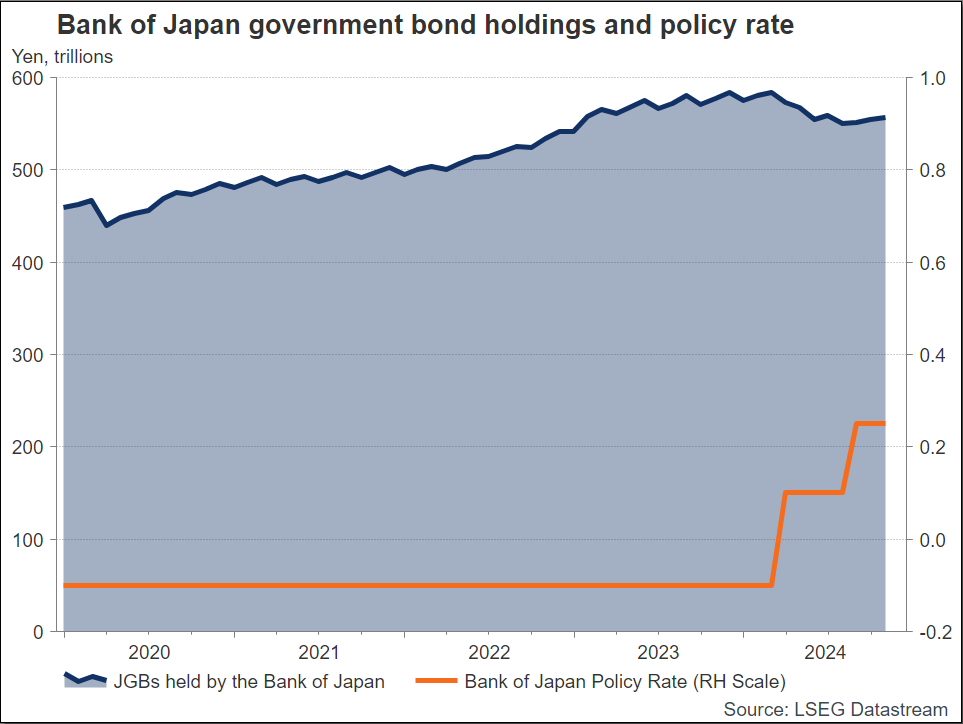
The Bank of Japan (BOJ) is anticipated to keep its interest rate steady at 0.25% during its upcoming two-day meeting on December 18-19, the last one for 2024. This decision aligns with the central bank's cautious approach as it seeks more clarity on domestic wage and spending trends, as well as potential policy changes from the incoming US administration under President-elect Donald Trump.
Low rates and yen weakness
Japan's interest rates remain the lowest among developed nations due to the BoJ's long-standing policy to support the country's sluggish economy. Economists see wage growth propelling Japan's economy towards the BoJ's 2% inflation target. However, they suggest the BoJ might wait another month to assess wage-driven inflation dynamics, focusing on the positive momentum from next year's spring wage negotiations and the possible impact from Trump's trade policies.
Timing of rate hikes in question
The BoJ ended its negative interest rate policy in March and raised its short-term policy target to 0.25% in July. It has signaled its readiness to hike again if wages and prices move as projected and strengthen the conviction that Japan will durably hit 2% inflation. However, the central bank has been cautious about the timing of the next rate hike, leading to fluctuations in market expectations between November and December. Traders are almost entirely anticipating a quarter-point increase by March, as Governor Ueda and his colleagues have reiterated that they are ready to raise rates again in response to a strengthening economy, increasing earnings, and inflation exceeding the target.
Currency risks: Yen's influence on BoJ decisions
Currency risks also play a significant role in the BoJ's decision-making process. Analysts pointed out that the yen's value against the dollar could influence the central bank's actions. A stronger US dollar could weigh on the yen and accelerate the BoJ's policy normalization, while a weaker yen supports Japan's reflation efforts.
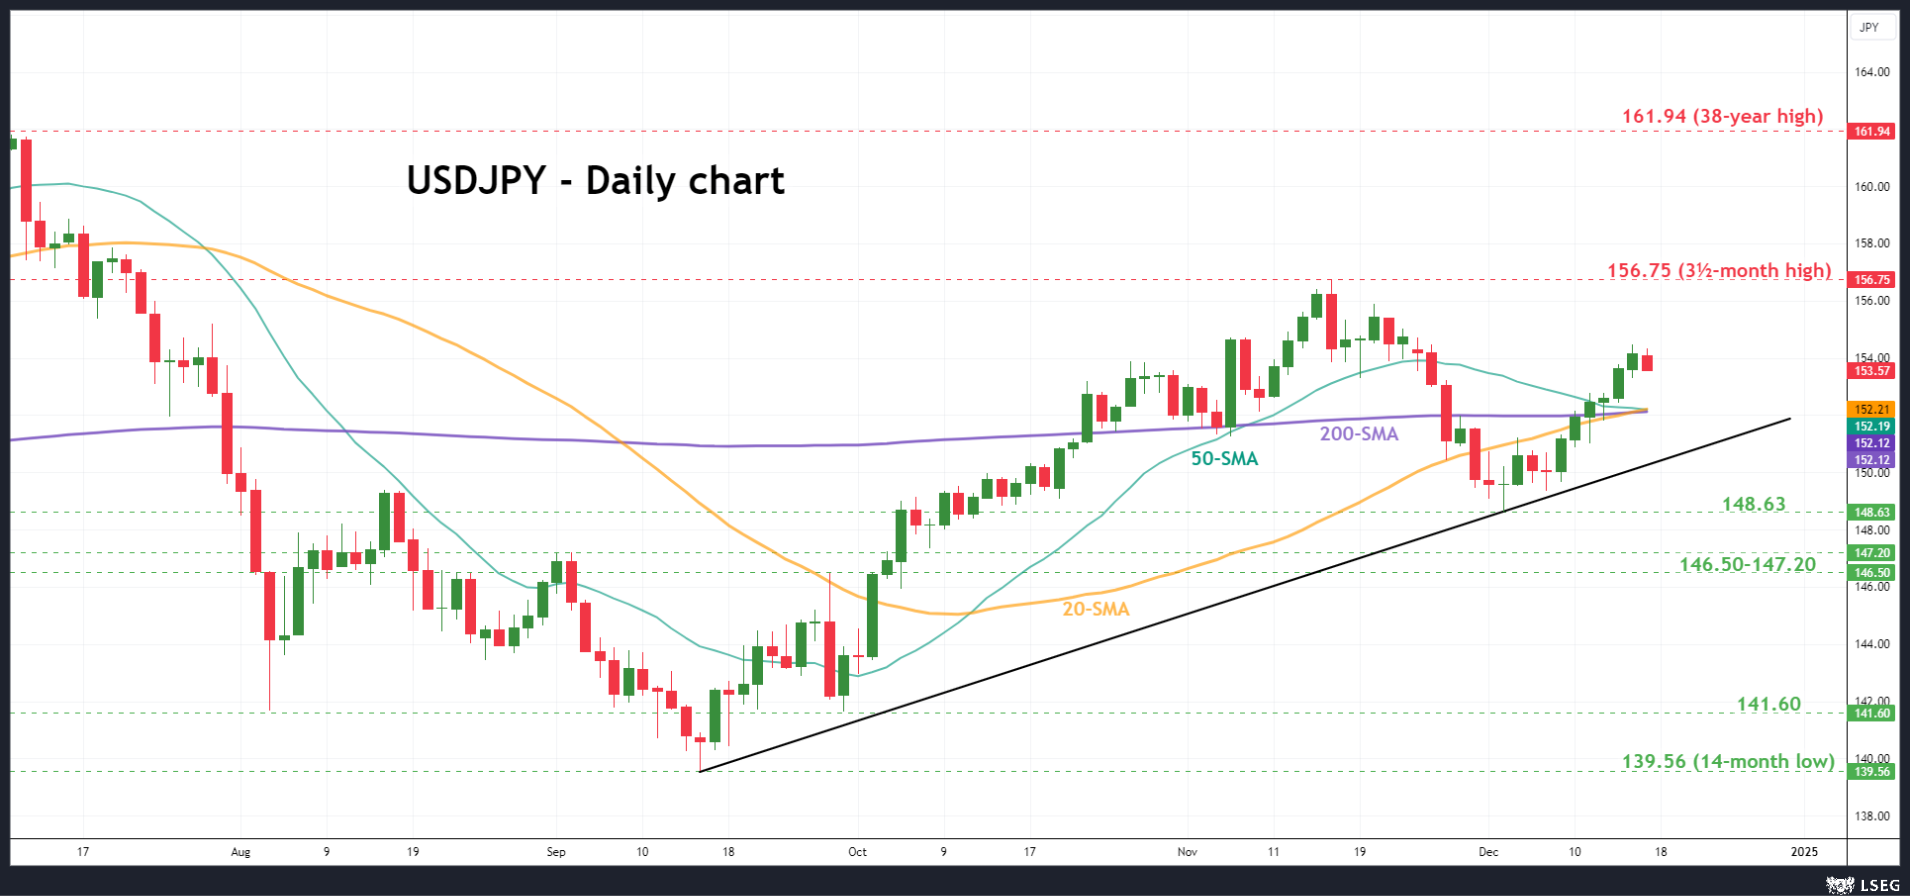
Currently, dollar/yen is easing after six consecutive green days but is standing above the 200-day simple moving average (SMA) at 152.10, which is acting as a strong support level. Any upside pressure may send the market to the three-and-a-half-month high of 156.75. However, a descending move below the 151.10 support and the short-term uptrend line may increase the chances for a bearish retracement.
Gold (XAU/USD) Traders Await Fed Meeting: Will Prices Rally or Fall?
- Gold prices have dropped due to increased US Treasury yields, profit-taking, and the anticipation of a less dovish Fed outlook for 2025.
- The upcoming Fed meeting and its economic projections, especially regarding rate cuts, will significantly impact gold prices.
- India’s gold imports are expected to decline in December due to a lack of festivals and rising gold prices.
- Analysts are optimistic about gold’s prospects in 2025, with a target of $3000/oz, driven by potential Chinese stimulus and increased demand during the Lunar New Year.
Gold has struggled this week continuing its selloff from the back end of last week. An increase in US Treasury yields coupled with profit taking and the potential for a less dovish Fed outlook for 2025, have all played a role.
The selloff has brought the precious metal back to the range (2624-2650) it hovered in ahead of the rally which began on December 9. The Fed meeting tomorrow could be the deciding factor in what Gold prices do heading toward the end of the year.
Gold Traders Face Fed Conundrum
Market participants are heading into this week’s Fed meeting with mixed feelings. The decision at the meeting seems to be a foregone conclusion, why then are market participants adopting a cautious approach?
The decision at this week’s meeting may not hold much sway in the minds of market participants and rightly so in my opinion. I do think that a lot of this has already been priced into the Gold price leaving the updated economic projections and commentary from Fed Chair Powell. This is where I believe all eyes will be focused on in tomorrow’s meeting.
There has been growing consensus over the past month that 2025 may not bring as many rate cuts from the Fed as previously hoped. This stems from a variety of factors, the most pertinent being the return of US President Donald Trump.
The Fed have thus far said they will wait to see the impact of Trump policies on the economy but one cannot wonder whether this is already at play in the back of their minds. Will it influence discussions and the updated economic projections?
These are the more pressing questions that could drive the next move in Gold prices. As things stand markets are only pricing in around 73bps of rate cuts through December 2025. This means only around 50bps of cuts next year. Any changes to the probabilities here are likely to have a major impact on the US Dollar and Gold prices and could drive prices in the coming weeks.
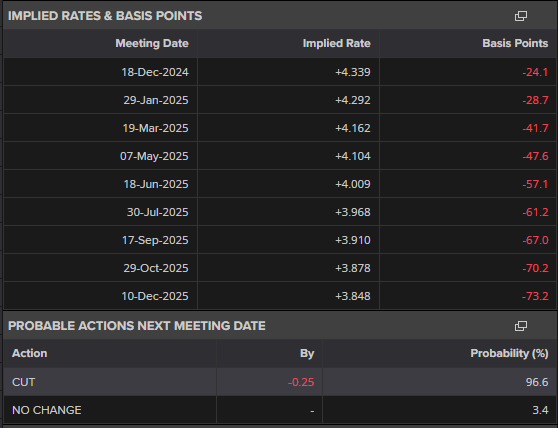
Source: LSEG (click to enlarge)
India’s Gold Imports Plunge in December
India’s gold imports are expected to drop sharply in December after reaching record highs in November. This slowdown is due to a lack of big festivals and rising gold prices, which are making buyers delay their purchases, according to trade and government officials.
India remains the world’s second largest consumer of the precious metal and this could also be a contributing factor to the recent price decline. Gold imports more than doubled in November compared to the previous month, reaching a record $14.8 billion.
China Stimulus and Lunar New Year
Looking ahead, analysts seem upbeat about the prospects for Gold in 2025. Many have placed a target around the $3000/oz mark. Chinese authorities are looking at increasing stimulus as demand remains weak in the world’s second largest economy.
This week’s retail sales data proved as much, dropping down to 3% YoY from a previous print of 4.8%. Stimulus measures could help push demand in China and thus help gold prices move higher, especially with the Lunar New Year coming up.
During the Lunar New Year period, jewelry demand usually increases because of gift-giving traditions. The hope is that the next round of stimulus by Chinese authorities will finally lead to an improvement in demand as China prepares for an intriguing 2025.
Economic Calendar
Technical Analysis – Gold (XAU/USD)
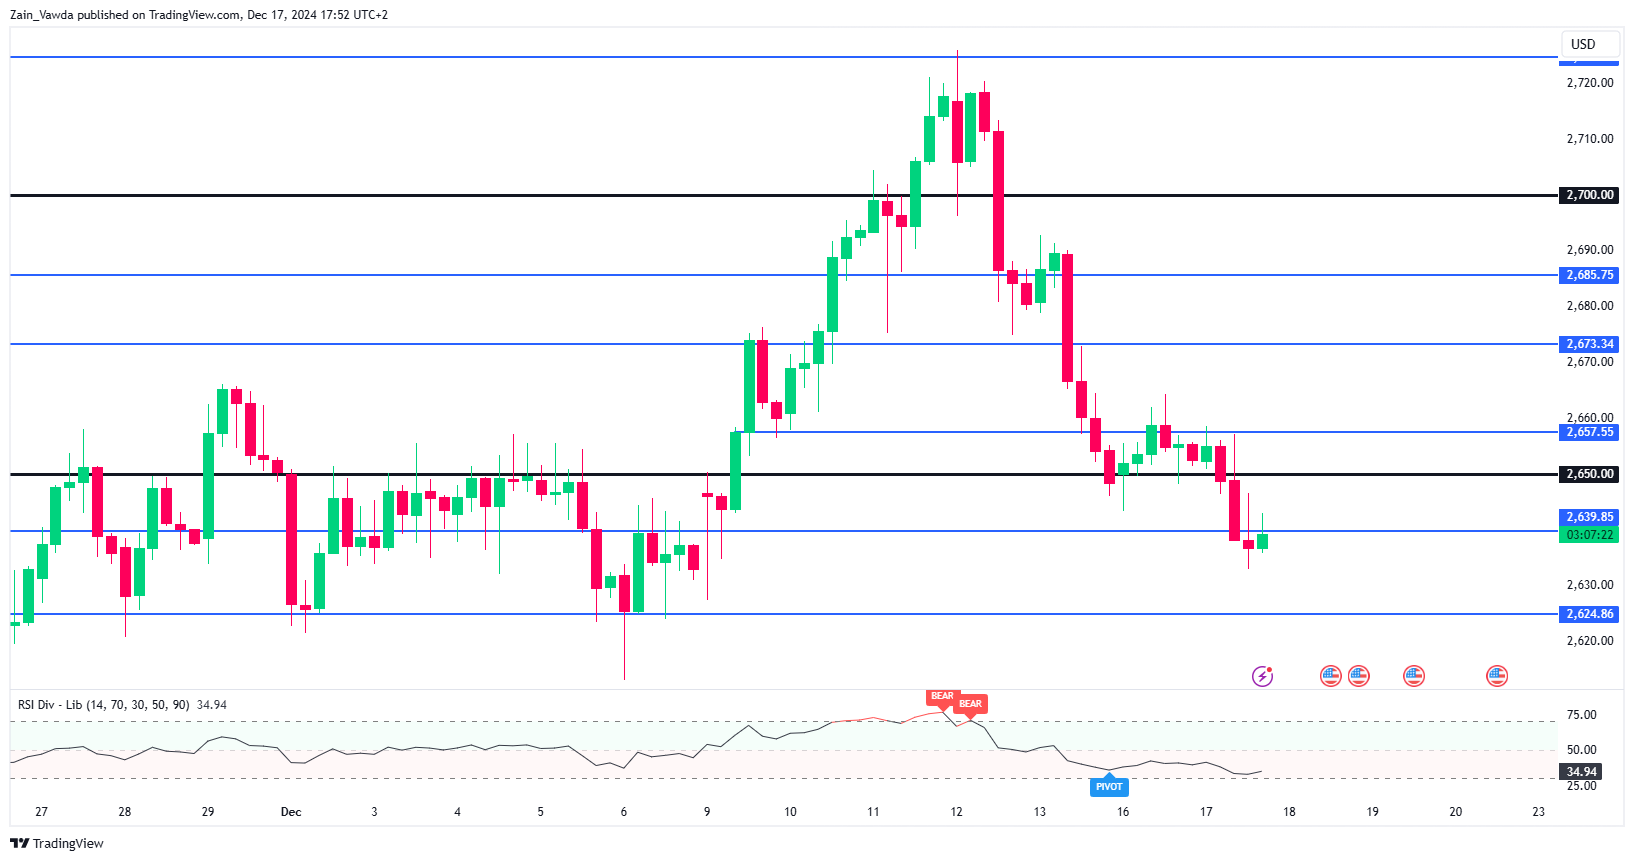
From a technical analysis standpoint, Gold is already in a bearish trend on the four-hour timeframe with lower highs and lower lows. The selloff has been quite abrupt with no significant pullback materializing. Instead we have had some shallow recoveries like yesterday which have failed to push beyond the 2660 handle.
As things stand a four-hour candle close above the 2660 handle is needed for a change in structure to take place which could embolden bulls. This could lead to a sustained recovery but given the recent selling pressure buyers may remain on edge and not ready to commit.
Market participants will likely derive confidence depending on the rhetoric from the Fed at tomorrows meeting. A dovish outlook for 2025 could lead to a renewed push to 2700 while a more hawkish take on the rate cut path could send Gold below the 2600 handle.
Immediate resistance at 2660 with a break above leading to resistance at the 2675 and 2685 handles.
Immediate support rests 2624 before the 2610 and 2600 handles become the areas of focus.
Gold (XAU/USD) Four-Hour (H4) Chart, December 17, 2024
Source: TradingView (click to enlarge)
Support
- 2624
- 2610
- 2600
Resistance
- 2660
- 2675
- 2685
EURGBP Wave Analysis
- EURGBP reversed from resistance level 0.8300
- Likely to fall to support level 0.8225
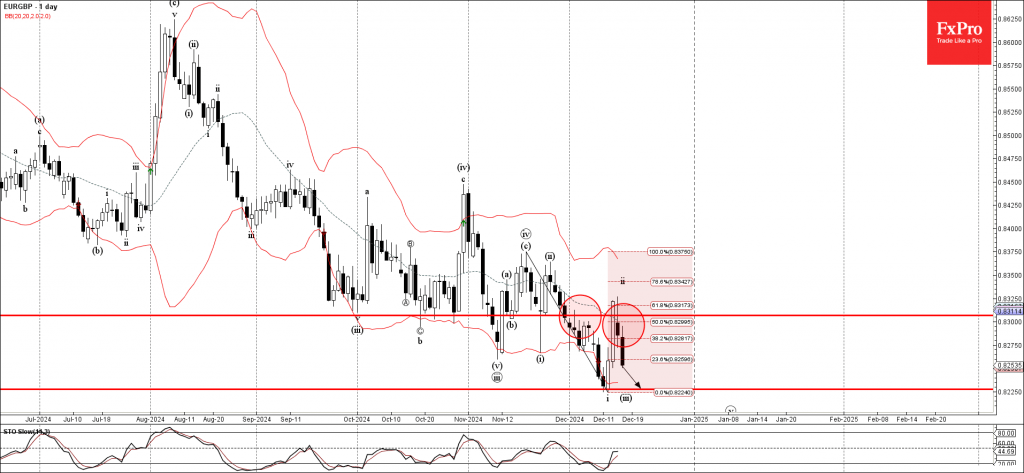
EURGBP currency pair recently reversed down from the key resistance level 0.8300 (former strong support from October) intersecting with the 61.8% Fibonacci correction of the downward impulse from November.
The downward reversal from the resistance level 0.8300 continues the active short-term impulse wave (v) from the middle of November.
Given the strong daily downtrend and bullish sterling sentiment seen today, EURGBP currency pair can be expected to fall further to the next support level 0.8225 (low of the previous impulse wave i).
EURJPY Tumbles After Meeting 38.2% Fibo
- EURJPY erases some gains
- Stochastic and RSI head down
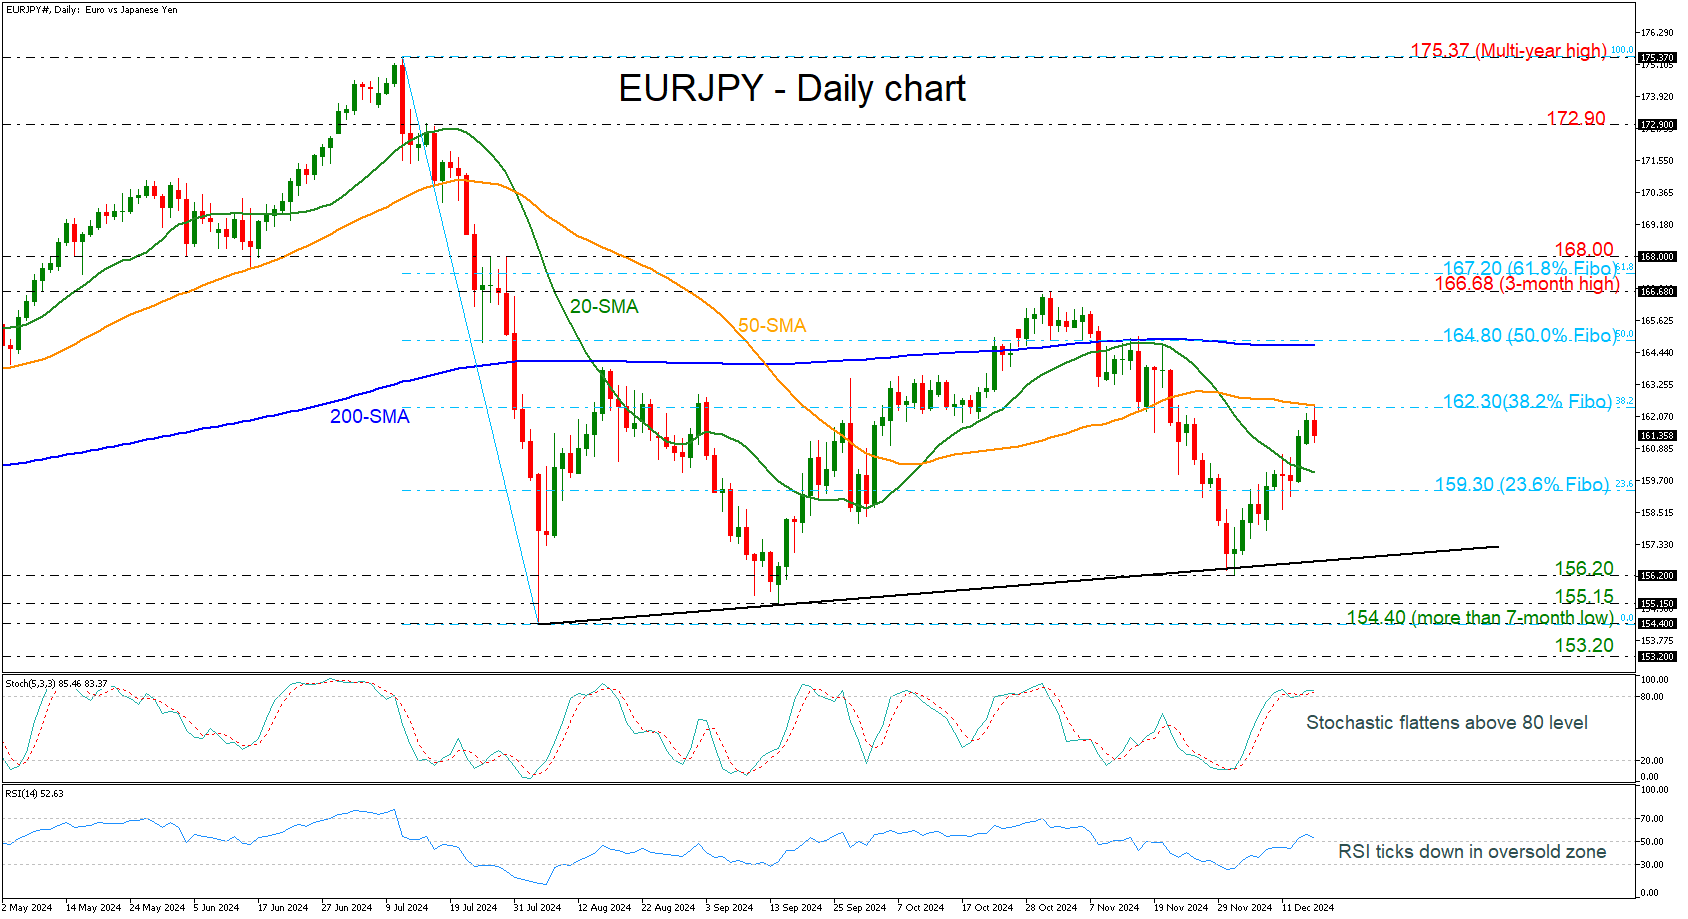
EURJPY has found strong resistance near the 38.2% Fibonacci retracement level of the down leg from 175.37 to 154.40 at 162.30, which overlaps with the 50-day simple moving average (SMA). A downside movement may drive traders towards the 20-day SMA at 159.90 ahead of the 23.6% Fibonacci of 159.30. Steeper decreases could potentially pave the way for the medium-term uptrend line at 156.80.
On the other hand, if the market rises above the critical area of 162.30, it may open the way for the bulls to test the 200-day SMA, which lies near the 50.0% Fibonacci of 164.80. A successful rally beyond this area could send the pair to the three-month high of 166.68.
From a technical standpoint, the stochastic oscillators are flattening in the overbought area, and the RSI is pointing south above the neutral threshold of 50. Both suggest an overstretched market.
All in all, EURJPY has been in a bullish tendency since August but needs a boost to confirm the upside structure.
Sunset Market Commentary
Markets
Relative market calm this morning was already disturbed sooner than expected by the publication of the UK labour market data. The unemployment rate remained unchanged at 4.3% and November payrolls declined a bigger than expected 35k. However, it was wage growth data catching the eye just two days before the final BoE policy meeting of the year. Average weekly earnings growth (ex-bonus 3M/YoY) unexpectedly accelerated from (an upwardly revised 4.9%) to 5.2%. Aside from the impact of the upward revision this also suggests persistent underlying wage growth. Private sector wage growth even accelerated from 4.9% to 5.4%. Markets didn’t expect a BoE rate cut at Thursday’s meeting anyway, but the wage data also raise ever more uncertainty whether there will be room for follow-up action at the February meeting (about 60% discounted). UK gilts strongly underperformed German Bunds and US Treasuries with yields rising about 7.5 bps across the curve except for the very long end (30-y +5.0 bps). The rise in yields also helps sterling to further reverse a part of Friday’s correction. Still the gain could have been bigger given the sharp rise in the interest rate differential, especially against the euro. EUR/GBP trades near 0.827 compared to 0.829 at the open this morning. Tomorrow’s UK November CPI data for sure won’t go unnoticed, especially not in case of a upward surprise.
Moves on European and US interest rate markets are much more limited today. German yields are trading between unchanged (2-y) and minus 2.0 bps (30-y). German IFO business confidence unexpectedly declined further (84.7 from 85.6). Even more worrisome, it was due to a further deterioration in the expectations index (84.4 from 87.0). On the other hand, expectations among investors in the ZEW survey improved from 7.4 to 15.7, more than expected. At least for now, there is no reason for markets to already further scale back expected ECB policy easing with the trough seen near 1.75%. In the US, November retail sales were the final important data release before tomorrow’s Fed policy decision. Headline sales printed at a strong 0.7% M/M, amongst others supported by strong motor vehicle sales. Control group sales (less food services, auto dealers, building materials and gas stations) also rose a solid 0.4%. The retail sales report confirms other recent data evidence that especially domestic demand remains solid and that the Fed shouldn’t feel in a hurry to aggressively normalize policy further after gradually reducing restriction with a 25 bps cut tomorrow. US yields are changing less than 1 bp. Despite strong activity data of late, the dollar for now also maintains a ST holding pattern (DXY 106.85, EUR/USD 1.0505). US equities are ceding marginal ground (+/- 0.5%) but the Nasdaq and the S&P 500 still are within reach of the all-time record levels.
News & Views
Minutes of last week’s Brazilian central meeting provided more insight in the decision to accelerate the tightening cycle to 100 bps (to 12.25%) and putting forward similar action in February and March. Central bankers said that upside inflation risks, such as the resilience of services inflation, the deanchoring of expectations and FX depreciation, have materialized. Economic growth remains stronger as well with a tight labour market and higher government spending both boosting consumption. This less uncertain and more adverse scenario required a more timely policy action to maintain the firm commitment to converging inflation to the target (3% +-1.5ppt tolerance band). Central bankers also raised their estimate of a neutral rate to 5%. In the meantime, the Brazilian real keeps setting new all-time lows (USD/BRL 6.15) despite FX interventions by the BCB (today 3rd time in a week). It doesn’t help that the Brazilian government is pushing through its expansive fiscal plans before the year-end without watering stimulus efforts down to soothe markets.
The German debt agency released its issuance outlook of the Federal government for 2025. They intend to sell around €380bn, down from €438.5bn this year and near €500bn in 2023. A total of €240bn is to be raised on the capital market and a further €126bn on the money market. The Finanzagentur targets €70.5bn in 2-yr Notes, an issue volume of €62.5bn for the 5-yr segment, €64bn of 10-yr Federal bonds, €17bn in the 15-yr bucket and finally a total amount of €26bn of 30-yr Federal bonds. The debt-issuance plan includes Green Federal securities of between €13bn and €15bn. An update/confirmation of the issuance plan for the second quarter will be published in March 2025 and subject to change given February parliamentary elections.
EUR/USD Mid-Day Outlook
Daily Pivots: (S1) 1.0483; (P) 1.0504; (R1) 1.0533; More...
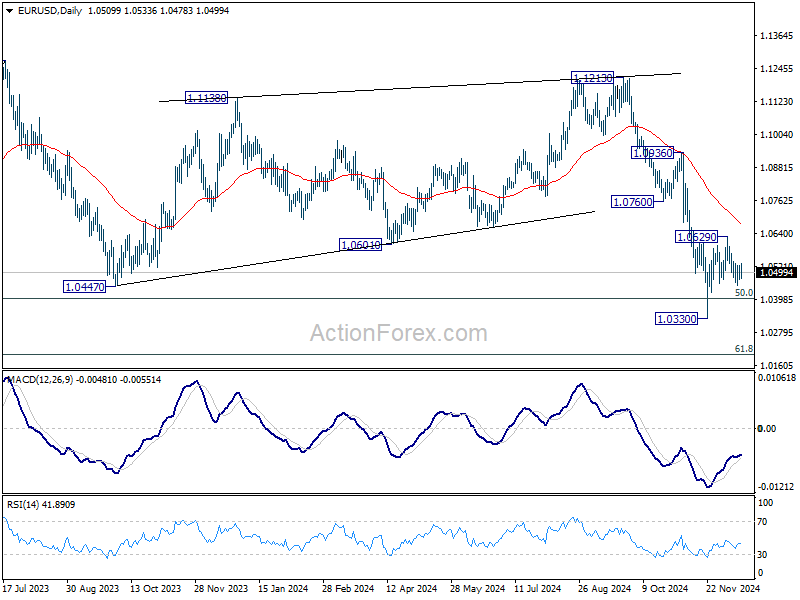
Sideway trading continues in EUR/USD and intraday bias stays neutral. Corrective pattern from 1.0330 might extend further. But outlook will stay bearish as long as 55 D EMA (now at 1.0674) holds. On the downside, below 1.0452 will bring retest of 1.0330 low.
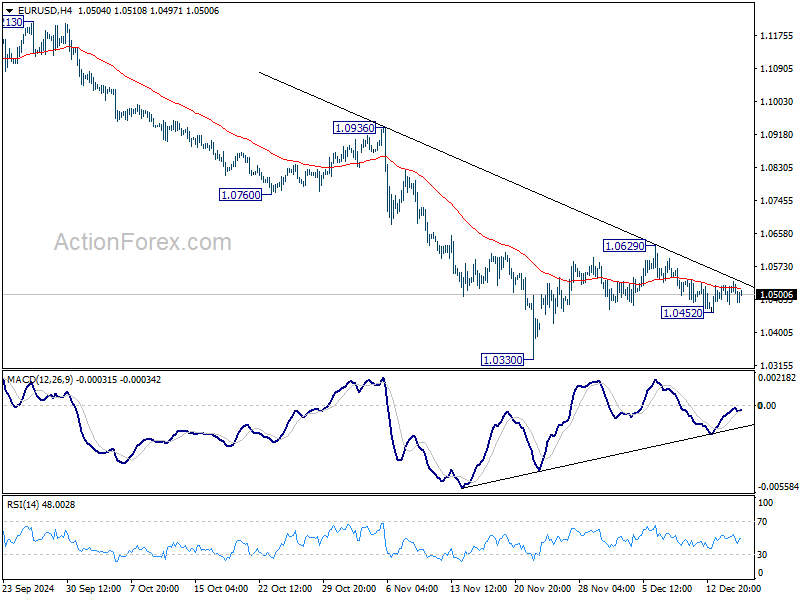
In the bigger picture, focus stays on 50% retracement of 0.9534 (2022 low) to 1.1274 at 1.0404. Strong rebound from this level will keep price actions from 1.1273 (2023 high) as a medium term consolidation pattern only. However, sustained break of 1.0404 will raise the chance that whole up trend from 0.9534 has reversed. That would pave the way to 61.8% retracement at 1.0199 first. Firm break there will target 0.9534 low again.
GBP/USD Mid-Day Outlook
Daily Pivots: (S1) 1.2630; (P) 1.2664; (R1) 1.2719; More...
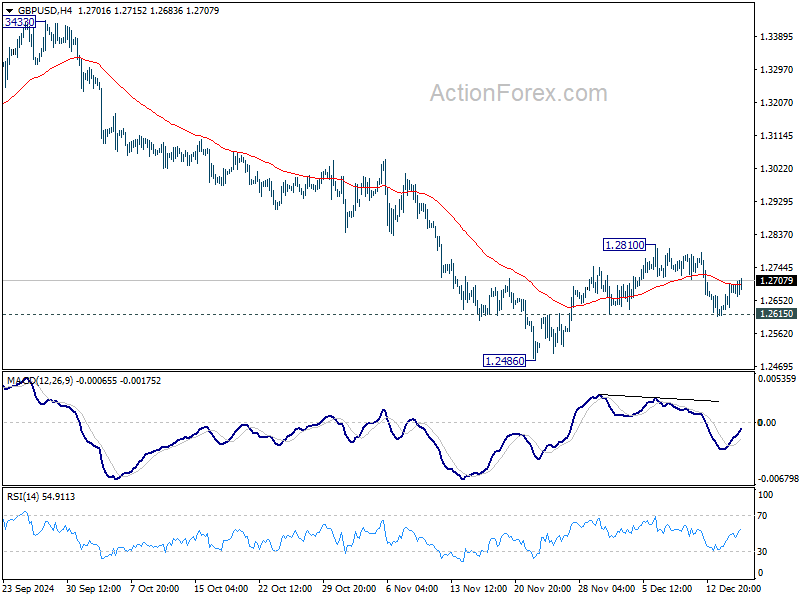
Intraday bias in GBP/USD remains neutral for the moment, as range trading continues. On the downside, break of 1.2615 minor support will indicate that corrective recovery from 1.2486 has completed. Retest of this low should be seen next, and break will target 1.2298 cluster support zone. Nevertheless, break of 1.2810 will turn bias to upside for stronger rebound.
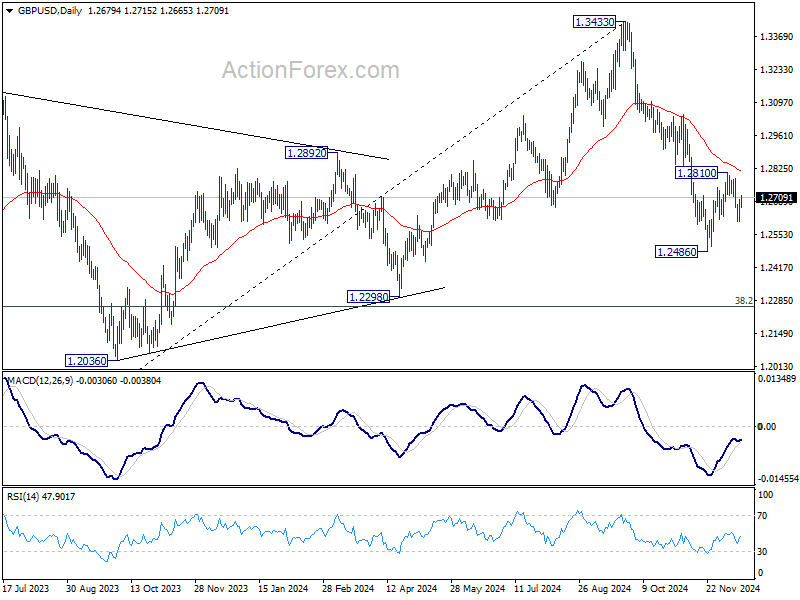
In the bigger picture, price actions from 1.3433 medium term are seen as correcting whole up trend from 1.0351 (2022 low). Deeper decline could be seen to 38.2% retracement of 1.0351 to 1.3433 at 1.2256, which is close to 1.2298 structural support. But strong support is expected there to bring rebound to extend the corrective pattern.
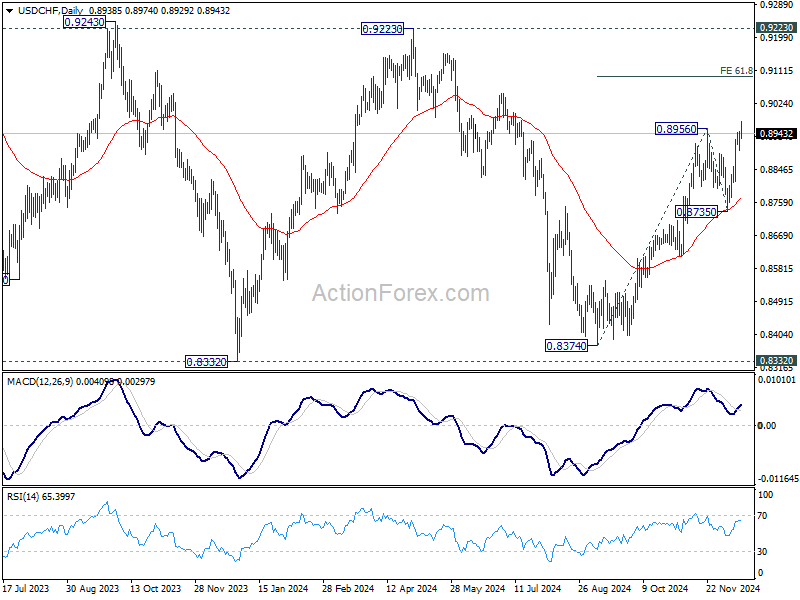
USD/CHF Mid-Day Outlook
Daily Pivots: (S1) 0.8913; (P) 0.8931; (R1) 0.8964; More…
Intraday bias in USD/CHF remains on the upside at this point. Current rise from 0.8374 is in progress for 61.8% projection of 0.8374 to 0.8956 from 0.8735 at 0.9095. On the downside, below 0.8897 minor support will turn intraday bias neutral first. But near term outlook will stay bullish as long as 0.8735 support holds, in case of retreat.
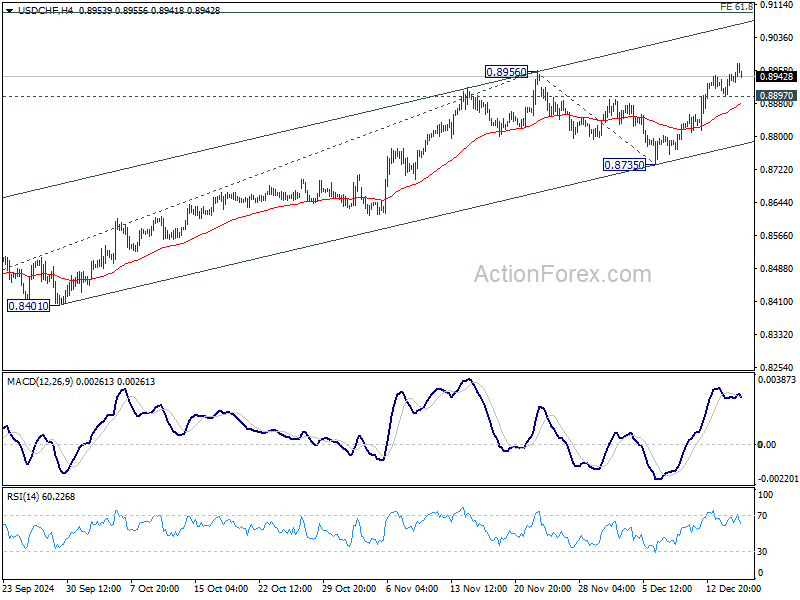
In the bigger picture, price actions from 0.8332 (2023 low) are currently seen as a medium term corrective pattern, with rise from 0.8374 as the third leg. Overall outlook will continue to stay bearish as long as 0.9223 resistance holds. Break of 0.8332 low is in favor at a later stage when the consolidation completes.