
Sample Category Title
AUD/USD Daily Report
Daily Pivots: (S1) 0.6319; (P) 0.6349; (R1) 0.6365; More...
AUD/USD's decline resumed by breaking through 0.6336 temporary low and intraday bias is back on the downside. Current fall from 0.6941 should target 0.6269 support next. On the upside, above 0.6382 minor resistance will turn intraday bias neutral and bring consolidations again, before staging another fall.
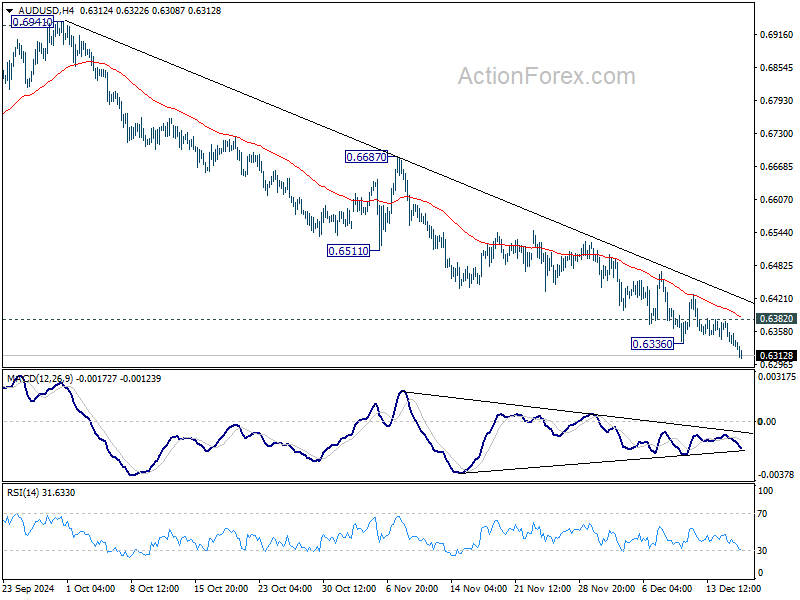
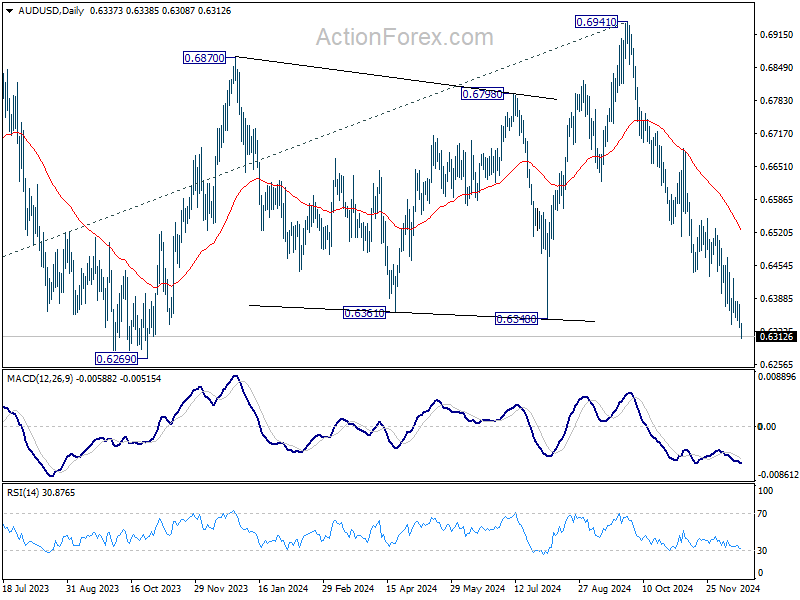
In the bigger picture, price actions from 0.6169 (2022 low) are seen as a medium term consolidation to the down trend from 0.8006. More sideway trading could be seen above 0.6169, but overall outlook will stay bearish as long as 0.6941 resistance holds. Firm break of 0.6169 will resume the down trend to 61.8% projection of 0.8006 to 0.6169 from 0.6941 at 0.5806 next.
Dollar Awaits Fed Clarity on Easing, Sterling Shrugs Strong Inflation Data
Dollar has strengthened against commodity currencies this week but remains range-bound against Euro and Pound, as markets await Fed’s rate decision to gauge the next move. While a 25bps rate cut is fully expected in with no chance of deviation, the focus is on how hawkish Fed's messaging will be. Key questions include the likelihood of a pause in January, the projected pace of easing in 2025, and any adjustments to the neutral rate. The answers to these will shape the direction of Dollar, yields, and broader markets, at least for the near term.
British Pound showed little reaction to today’s UK CPI data, which confirmed persistent inflationary pressure. Services inflation remains elevated at 5%, with no clear signs of easing materially. Coupled with yesterday’s wage growth data, this is more than enough for BoE to hold rates steady this week. Markets maintain a base case of four rate cuts in 2025, with little expectation for a shift unless BoE delivers unexpectedly drastic signals during its upcoming meeting.
For the week so far, the Pound leads as the strongest performer, followed by Yen and then Dollar. Australian Dollar is the weakest, trailed by Canadian Dollar and New Zealand Dollar, while Euro and Swiss Franc are mixed in the middle.
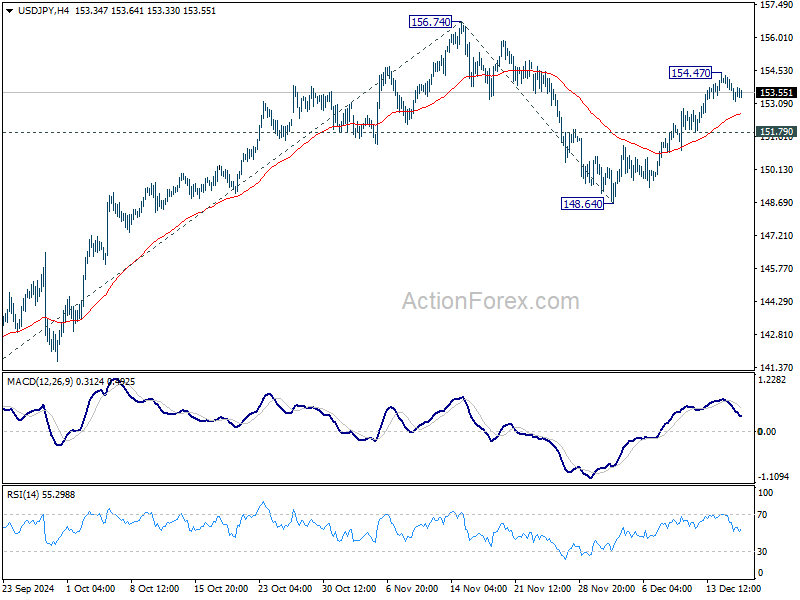
Technically, USD/JPY's rally from 148.64 is losing some momentum as see in 4H MACD. Another rise is in favor for now. But real near term hurdle lies in 156.74 resistance. Break of 4.5% handle in 10-year yield is probably needed to push USD/JPY through 156.74 to resume the rally from 139.57. Otherwise, the pair could engage in range trading between 148.64/156.74 for longer, with risk of another fall before completing the corrective pattern from 156.74.
Looking ahead, Eurozone CPI final will be released in European session. US will release building permits and housing starts, current account later in the day. But main focuses will be on FOMC rate decisions.
Key FOMC Questions: Pause in January, Easing Path in 2025, and Neutral Rate
FOMC rate decision takes center stage today, with a 25bps rate cut widely anticipated, lowering the federal funds rate to 4.25–4.50%. Markets see virtually no chance of a different outcome, making the focus squarely on Fed Chair Jerome Powell’s statement and the updated economic projections. Expectations are for Fed to signal a slower pace of easing in 2025, aligning with signs of a resilient economy and sticky inflation.
Three key questions arise from today’s new projections.
First, the possibility of a pause in January is in focus. With markets pricing an 84% probability of no rate change at the next meeting, the voting split within the FOMC could hint at how close policymakers are to a pause in the easing cycle.
Second, attention will shift to the pace of easing in 2025. Fed’s prior projections and dot plot suggested a median rate of 3.4% by the end of next year. Markets are currently pricing in a 33% chance of rates falling to 3.75–4.00% by December 2025. A significant upward revision in Fed’s median forecast would signal caution about inflation persistence and align with tighter-than-expected monetary policy.
Third, the neutral rate will be scrutinized. The previous projection of a longer-run rate was 2.9%, slightly higher than 2.8% in June. A move toward or above 3% could be psychologically significant, signaling higher baseline expectations for economic growth and inflation stability in the post-tightening environment.
In terms of market reactions, Fed’s "hawkish cut" could lift both the 10-year Yield and Dollar Index. However, breaking out of current ranges will require more than today’s decision.
For the DXY, resistance at 108.07 must be cleared to confirm underlying bullish momentum, which would likely need support from a 10-year yield break above 4.505%. These breakouts would likely hinge on clarity around fiscal and trade policies from the incoming administration.
UK CPI accelerates to 2.6% in Nov, core CPI up to 3.5%
UK CPI accelerated from 2.3% yoy to 2.6% yoy in November, matched expectations. Core CPI, (excluding energy, food, alcohol and tobacco), accelerated from 3.3% yoy to 3.5% yoy, below expectation of 3.6% yoy. CPI goods annual rate rose from -0.3% yoy to 0.4% yoy , while CPI services annual rate was unchanged at 5.0% yoy.
Japan's export rises 3.8% yoy in Nov, while import falls -3.8% yoy
Japan’s exports rose 3.8% yoy in November to JPY 9.152T, supported by increased shipments of chip-making equipment to Taiwan and nonferrous metals to China, marking the second consecutive month of export growth. Imports, however, fell -3.8% yoy to JPY 9.270T, marking their first decline in eight months due to reduced demand for crude oil from Saudi Arabia and electronics parts from Taiwan.
The overall trade deficit stood at JPY -117.6B, extending its red streak to five months. On a seasonally adjusted basis, the deficit widened to JPY -384B from JPY -229B in October, as imports increased 1.9% mom, outpacing the 0.2% mom rise in exports.
Trade with key partners highlighted persistent imbalances. Japan recorded a JPY 664.03B trade surplus with the US, despite exports falling -8.0% yoy, while imports dipped slightly by -0.6% yoy.
Conversely, its trade deficit with China expanded to JPY 682B, as exports grew 4.1% yoy, and imports rose 4.2% yoy.
The trade gap with the EUR remained significant at JPY 210.19B, with exports plunging -12.5% yoy, while imports decreased -5.4% yoy.
AUD/USD Daily Report
Daily Pivots: (S1) 0.6319; (P) 0.6349; (R1) 0.6365; More...
AUD/USD's decline resumed by breaking through 0.6336 temporary low and intraday bias is back on the downside. Current fall from 0.6941 should target 0.6269 support next. On the upside, above 0.6382 minor resistance will turn intraday bias neutral and bring consolidations again, before staging another fall.
In the bigger picture, price actions from 0.6169 (2022 low) are seen as a medium term consolidation to the down trend from 0.8006. More sideway trading could be seen above 0.6169, but overall outlook will stay bearish as long as 0.6941 resistance holds. Firm break of 0.6169 will resume the down trend to 61.8% projection of 0.8006 to 0.6169 from 0.6941 at 0.5806 next.
We May See Kneejerk Downleg in US (front-end) Yields and Dollar After Dot Plot Release
Markets
Retail sales for November were solid on face value though the details offered a more balanced picture. That was enough to cap the intraday rise in US yields. Net daily changes varied in a tight range between -1 bps and +0.7 bps in an otherwise uneventful session. German rates eased up to 1.7 bps (10-yr) but finished off the intraday lows set following a disappointing IFO indicator. UK gilts hugely underperformed with yields adding almost 10 bps at the front end of the curve. That came after yesterday’s labour market report which showed a sharper-than-expected increase in wage growth. The Bank of England’s room to cut rates is shrinking rapidly and that’s not changing with this morning’s November CPI release. While falling below expectations, accelerating headline CPI of 2.6%, core CPI of 3.5% and services inflation of 5% should not comfort the central bank in any way. UK money markets expect less than three rate cuts next year. Due to the slight CPI miss, sterling does give back some of yesterday’s gains. EUR/GBP is trading around 0.827. The pair remains in the technical danger zone.
Today’s going to be a drawn out countdown to the Fed decision. A rate cut from 4.5-4.75% to 4.25-4.5% is all but certain. Markets have more or less fully discounted such a scenario since the lack of an upward CPI surprise last week. After three consecutive rate cuts (50-25-25) we expect the Fed to steer the market to a pause in January. Chair Powell last month referring the strong economy said there’s no hurry in lowering the policy rates. It also offers the Fed a moment to assess president-elect Trump’s first policy announcements when entering the office on January 20. The updated dot plot will show fewer rate cuts for 2025 with three reductions instead of the current four the most plausible scenario. We think that the long-term estimate, a proxy for the neutral rate, will have shifted further north from 2.875% to 3%. It was already a close call in September. Since US money markets price in only 50 bps of cuts in 2025, we may see a kneejerk downleg in US (front-end) yields and the dollar after the dot plot release. It won’t stretch very far though if Powell strikes a generally hawkish tone in the presser afterwards by keeping the onus on the solid state of the economy. That should offer solid support to both yields and the dollar, the latter especially against an ongoing ailing euro. First meaningful support in EUR/USD is at 1.0335 (November correction low).
News & Views
The National Bank of Hungary (MNB) kept its policy rate unchanged at 6.5% yesterday, citing inflationary risks coming from volatile global investor sentiment and ongoing political tensions. Looking ahead, a careful and patient approach to monetary policy is warranted with the central bank referring to a further pause in cutting interest rates. Restrictive monetary policy contributes to the maintenance of financial market stability and the achievement of the inflation target in a sustainable manner by ensuring positive real interest rates. Updated inflation forecasts show that the 3% inflation target will now only be sustainably met in 2026 instead of 2025 as suggested in September. The MNB plots an inflation path of 3.65%-3.7%-3% for the 2024-2026 policy horizon, coming from 3.7%-3.15%-3% in September. The in-depth analysis will be published in tomorrow’s inflation report. The new growth path faced a downward revision for this year, but was broadly stable afterwards: 0.4%-3.1%-4% from 1.4%-3.2%-4%. The volatility around the MNB-verdict was limited for once. EUR/HUF was broadly unmoved around 409.
The International Energy Agency’s annual coal report shows that the global use of coal is poised to rise to 8.77bn tonnes in 2024, a record. Moreover, demand is set to stay close to this level (even slightly higher) through 2027. While coal use has plummeted in Europe and the US, rising demand in India and China is more than enough to offset that. The new forecast breaks with last year’s view that we would be heading for a decade of lower coal demand as renewable energy sources play a greater role in generating power and as coal consumption levels off in China. The speed at which electricity demand grows will be very important over the medium term, the IEA added.
Key FOMC Questions: Pause in January, Easing Path in 2025, and Neutral Rate
FOMC rate decision takes center stage today, with a 25bps rate cut widely anticipated, lowering the federal funds rate to 4.25–4.50%. Markets see virtually no chance of a different outcome, making the focus squarely on Fed Chair Jerome Powell’s statement and the updated economic projections. Expectations are for Fed to signal a slower pace of easing in 2025, aligning with signs of a resilient economy and sticky inflation.
Three key questions arise from today’s new projections.
First, the possibility of a pause in January is in focus. With markets pricing an 84% probability of no rate change at the next meeting, the voting split within the FOMC could hint at how close policymakers are to a pause in the easing cycle.
Second, attention will shift to the pace of easing in 2025. Fed’s prior projections and dot plot suggested a median rate of 3.4% by the end of next year. Markets are currently pricing in a 33% chance of rates falling to 3.75–4.00% by December 2025. A significant upward revision in Fed’s median forecast would signal caution about inflation persistence and align with tighter-than-expected monetary policy.
Third, the neutral rate will be scrutinized. The previous projection of a longer-run rate was 2.9%, slightly higher than 2.8% in June. A move toward or above 3% could be psychologically significant, signaling higher baseline expectations for economic growth and inflation stability in the post-tightening environment.
In terms of market reactions, Fed’s "hawkish cut" could lift both the 10-year Yield and Dollar Index. However, breaking out of current ranges will require more than today’s decision.
For the DXY, resistance at 108.07 must be cleared to confirm underlying bullish momentum, which would likely need support from a 10-year yield break above 4.505%. These breakouts would likely hinge on clarity around fiscal and trade policies from the incoming administration.
Who Pays the Bill?
Canada joined the global political gloom. The sudden resignation of the finance minister on Monday started raising questions about Trudeau’s leadership as politicians there try to find ways to deal with economic slowdown topped by Trump’s tariff threats. Happily for the Bank of Canada (BoC), inflation dropped below the 2% target for the second time in three months hinting that the central bank could at least remain supportive when politicians are not. The USDCAD spiked to the highest levels since the pandemic. The Loonie is now oversold versus the US dollar and retreats very rapidly against the euro since the November peak. Oil prices aren’t adding to the selloff these days, but they are not helping either. As such, the political problems pave the way for further Loonie weakness, price pullbacks in the USDCAD and EURCAD could be interesting opportunities to jump on the trend.
A bit lower on the map, Brazil intervened to stop the bleeding of the real after the currency tanked more than 20% against the greenback to an all-time-low this year. Ballooning debt and deficit are taking a toll on the country’s finances as – remember – not everyone can balloon debt infinitely and make the rest of the world pay for it. This is the major differences between what we call developed countries and their emerging market peers.
Because look, the French National Assembly just adopted a stopgap budget bill to avoid a government shutdown from January as the French politicians took down a government that tempted to control, and to narrow the budget deficit. And yet, the French 10-year yield – though higher on the latest shenanigans - is not alarmingly higher. The outlook for France is not brilliant, however.
Investors in the US have a different problem: the retail sales, there, has again been higher than expected by analysts, again pointed at resilient consumer spending and again highlighted the needlessness of another rate cut from the Federal Reserve (Fed) today. But the Fed will announce a 25bp cut no matter what.
The more the Fed’s rate cuts diverge from economic fundamentals, the stronger the hawkish expectations for the future become. Some expect that the Fed could cut only twice next year while others think that the Fed’s premature and rapid cuts will require a rate hike next year. But I would be surprised to see a meaningful reversal in the Fed’s rate cutting plans at today’s announcement. In the worst-case scenario, Fed officials might signal one fewer rate cut on average for next year. I expect them to stick to the familiar ‘inflation is moving toward target’ rhetoric at this pre-Xmas meeting, paving the way for the Santa rally to unfold.
The S&P500 and Nasdaq eased yesterday as the US 2-year yield shortly spiked to 4.30%, Broadcom retreated nearly 4% but after a 38% rally in the previous two sessions, while Nvidia extended gains in the correction territory. If you are asking when is it a good time to buy a dip in Nvidia, I would say near $120 per share, that matches the 23.6% retracement on the AI rally. It’s still a 7.5% away from yesterday’s close near $130 per share.
In Europe, the Stoxx 600 remains downbeat and is about to test the 500 to the downside, as the Xmas magic is really not operating in Europe this year. The EURUSD hovers between gains and losses around 30 pips around the 1.05 psychological mark. The Fed’s decision will probably give a fresh direction to the pair. A sufficiently accommodative Fed statement and dot plot could give support to the EURUSD and help it to recover above the 1.05 mark – that’s my base case scenario. But if the Fed turns realistically less dovish – both of which is not their thing – we could see the US dollar extend gains and pave the way for a further downside correction in the EURUSD. If that’s the case, the parity bets will rapidly come back to the headlines.
Across the Channel, the figures come in but they are not easy to interpret. Yesterday’s jobs data looked strong with strong employment, low claims and nice earnings growth figures. And along with today’s inflation print dashed the likelihood of another rate cut this week from the Bank of England (BoE). But the private sector shed nearly 200’000 jobs this year – perfectly in contrast with the public sector. It’s obviously not good news for the economy and demands some support from the BoE – a support that the BoE won’t provide easily to balance out the government’s spending plans unless the economy weakens due to tax hikes before it improves thanks to spending. Looking at the chart, we are about to see a death cross formation on the daily chart – where the 50-DMA is about to dive below the 200-DMA – hinting that the selloff could accelerate and send Cable toward the 1.25 on worries that the UK economy will weaken before it rebounds.
Fed Cut Coming Up
In focus today
Focus today will be on tonight's FOMC meeting. We expect a 25bp cut, which is also fully discounted by markets. Apart from the rate decision, market attention will be on the updated rate projections, and especially on the FOMC's latest view on the terminal rate level. We think Chair Powell will aim for a neutral tone in his remarks, but he is still likely to verbally open the door for slowing the pace of cuts. See Fed preview: Gauging for neutral, 13 December for more details.
The UK November inflation out at 8:00 CET will be the data release to watch. Focus is on service inflation, which is expected to continue to show signs of stickiness around the 5% mark. Combined with the hawkish data surprises this week, this will support our call for a BoE pause tomorrow.
Today's calendar also features the final euro area inflation figures for November, which will provide details on the drivers behind the drop in the services component. Additionally, ECB's Lane and Muller are on the wire before noon.
Economic and market news
In the US, retail sales figures landed close to expectations at 0.4% y/y in November when measured by the control group (which strips out the most volatile components). Car sales and online sales contributed positively, while other more discretionary categories (furniture, electronics, restaurants) saw weaker or negative sales growth. This could be a signal of a tad more cautious consumer, but of course the monthly data is volatile as always.
In Germany, the IFO indicator for December declined more than expected from 85.7 to 84.7, which can mainly be attributed to lower expectations for the economy. The assessment of the current situation picked up slightly, which was in line with what the comparable PMI survey signalled earlier this week. Overall, soft indicators for the German economy continue to indicate that activity contracted in Q4.
In France, several major banks were downgraded by Moody's yesterday, following last week's sovereign rating cut due to the government collapse and the rejection of the 2025 budget. The 10-year French-German government yield spread is currently trading at 80bp, but we see a high likelihood that the spread will go to 100bp early next year.
In the UK, wage growth (excluding bonuses) picked up more than expected from 5.0% to 5.2% y/y in the three months to October. Moreover, payrolls decreased by 35,000 in November, vacancies declined, and the unemployment rate held steady at 4.3% in October. Combined with the stronger than expected PMIs, this week's UK data releases have so far highlighted why the BoE is set to continue lagging European peers in the easing cycle.
Equities: Global equities were lower yesterday, with a somewhat unusual sector rotation in which consumer discretionary outperformed alongside healthcare. However, the more interesting aspect is the very narrow leadership we have observed recently. To provide a few more examples: the Dow is now down for nine consecutive days, which has not happened in 45 years. At the same time the Nasdaq achieved a record high closing yesterday. Additionally, Tesla has risen in nine of the last ten sessions, significantly contributing to the superior performance of the consumer discretionary sector. The point here is that we have not had any macroeconomic, microeconomic, or monetary policy news that can explain or justify this rotation. However, there is a unique political and CEO situation in the US, coupled with an exuberant market where investors are hunting for winners. In the US yesterday, the Dow declined by 0.6%, the S&P 500 by 0.4%, the Nasdaq by 0.3%, and the Russell 2000 by 1.2%. Asian markets are mixed this morning. European futures are marginally lower, while US futures, including the Dow, are marginally higher.
FI: It was a quiet Tuesday in European rates markets with most of the action in the UK market. The higher-than-expected UK wage figures pushed 10Y GILT yields up by 8bp, while the implied change in the BoE bank rate until end-2025 moved up from -70bp to -55bp. Our forecast is -150bp, leaving substantial downside risk to UK rates for the coming 12 months. EGB yields were close to unchanged across tenors yesterday in line with the UST curve. The 5y5y EUR inflation swap rate moved back to 2%, dropping 3bp throughout the session.
FX: EUR/USD continues to trade close to 1.05 and USD/JPY within 153-154 ahead of tonight's Fed. Sterling has firmed and cable is back at 1.27, while the antipodeans continue to slide vs the USD. Cable is back at 1.27. USD/CAD has breached 1.43 and takes out new multi-year highs. EUR/SEK has erased some of yesterday's losses amid poor risk appetite and trades at 11.50, while EUR/NOK has sidelined around 11.75.
UK CPI accelerates to 2.6% in Nov, core CPI up to 3.5%
UK CPI accelerated from 2.3% yoy to 2.6% yoy in November, matched expectations.Core CPI, (excluding energy, food, alcohol and tobacco), accelerated from 3.3% yoy to 3.5% yoy, below expectation of 3.6% yoy. CPI goods annual rate rose from -0.3% yoy to 0.4% yoy , while CPI services annual rate was unchanged at 5.0% yoy.
Japan’s export rises 3.8% yoy in Nov, while import falls -3.8% yoy
Japan’s exports rose 3.8% yoy in November to JPY 9.152T, supported by increased shipments of chip-making equipment to Taiwan and nonferrous metals to China, marking the second consecutive month of export growth. Imports, however, fell -3.8% yoy to JPY 9.270T, marking their first decline in eight months due to reduced demand for crude oil from Saudi Arabia and electronics parts from Taiwan.
The overall trade deficit stood at JPY -117.6B, extending its red streak to five months. On a seasonally adjusted basis, the deficit widened to JPY -384B from JPY -229B in October, as imports increased 1.9% mom, outpacing the 0.2% mom rise in exports.
Trade with key partners highlighted persistent imbalances. Japan recorded a JPY 664.03B trade surplus with the US, despite exports falling -8.0% yoy, while imports dipped slightly by -0.6% yoy.
Conversely, its trade deficit with China expanded to JPY 682B, as exports grew 4.1% yoy, and imports rose 4.2% yoy.
The trade gap with the EUR remained significant at JPY 210.19B, with exports plunging -12.5% yoy, while imports decreased -5.4% yoy.
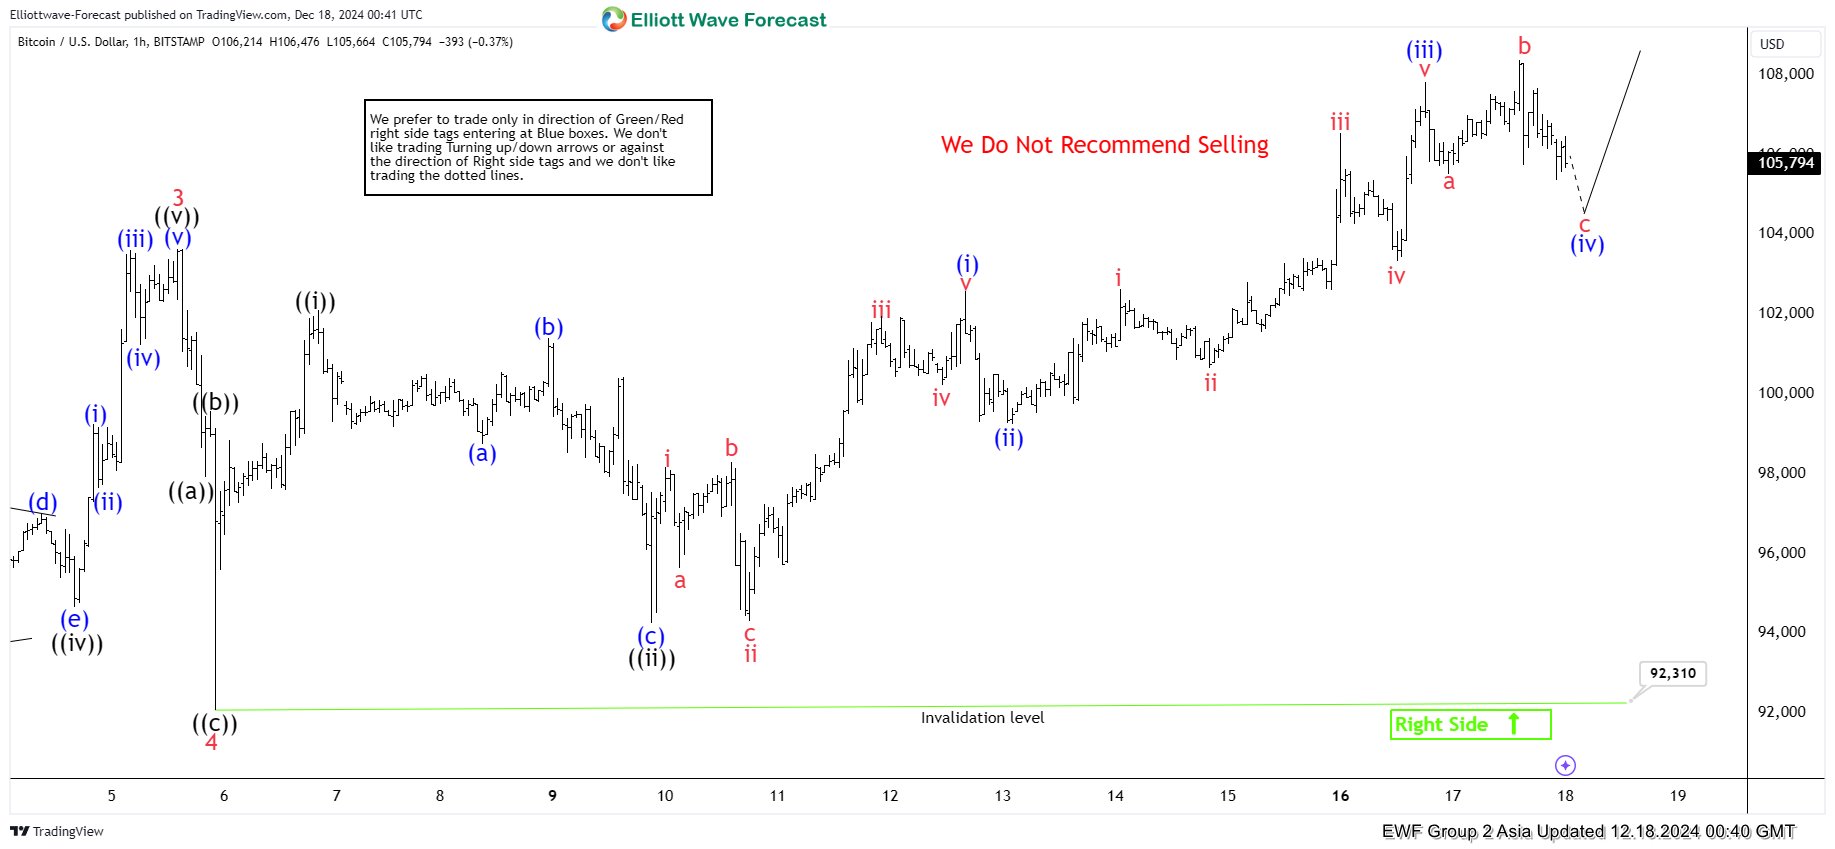
Elliott Wave View: Bitcoin (BTCUSD) Has Reached Inflection Area
Short Term Elliott Wave View in Bitcoin (BTCUSD) suggests rally from 6 September 2024 low is in progress as a 5 waves impulse. Up from 6 September, wave 1 ended at 66508 and dips in wave 2 ended at 58867. The crypto-currency has extended higher in wave 3 towards 103647 as the 1 hour chart below. Pullback in wave 4 unfolded as a zigzag Elliott Wave structure. Down from wave 3, wave ((a)) ended at 97917 and wave ((b)) ended at 99577. Wave ((c)) lower ended at 92310 which completed wave 4 in higher degree.
Bitcoin has resumed higher in wave 5. Up from wave 4, wave ((i)) ended at 101251 and wave ((ii)) pullback ended at 94249 as a zigzag structure. Down from wave ((i)), wave (a) ended at 98752 and wave (b) ended at 101407. Wave (c) lower ended at 94249 which completed wave ((ii)) in higher degree. The crypto-currency has extended higher in wave ((iii)). Up from wave ((ii)), wave (i) ended at 102582 and pullback in wave (ii) ended at 99250. Wave (iii) higher ended at 107821. Pullback in wave (iv) is in progress as an expanded flat before it turns higher again. Near term, as far as pivot at 92310 low stays intact, expect dips to find support in 3, 7, or 11 swing and the crypto-currency to extend higher.
Bitcoin (BTCUSD 60 Minutes Elliott Wave Chart
BTCUSD Elliott Wave Video
https://www.youtube.com/watch?v=hkDiQVf9Hiw
Gold Signals Caution: A Shift in Trend Ahead?
Key Highlights
- Gold failed to clear the $2,725 resistance and corrected gains.
- A connecting bullish trend line is forming with support at $2,630 on the 4-hour chart.
- Oil prices are struggling to clear the $71.50 resistance.
- EUR/USD could decline if it breaks the 1.0450 support level.
Gold Price Technical Analysis
Gold prices remained well-bid near the $2,615 zone against the US Dollar. The price formed a base and started a fresh increase above $2,640 and $2,680.
The 4-hour chart of XAU/USD indicates that the price even climbed above $2,700 but struggled to clear the $2,725 level. As a result, there was a bearish reaction below the $2,700 and $2,680 levels. The price dipped below the 50% Fib retracement level of the upward move from the $2,613 swing low to the $2,726 high.
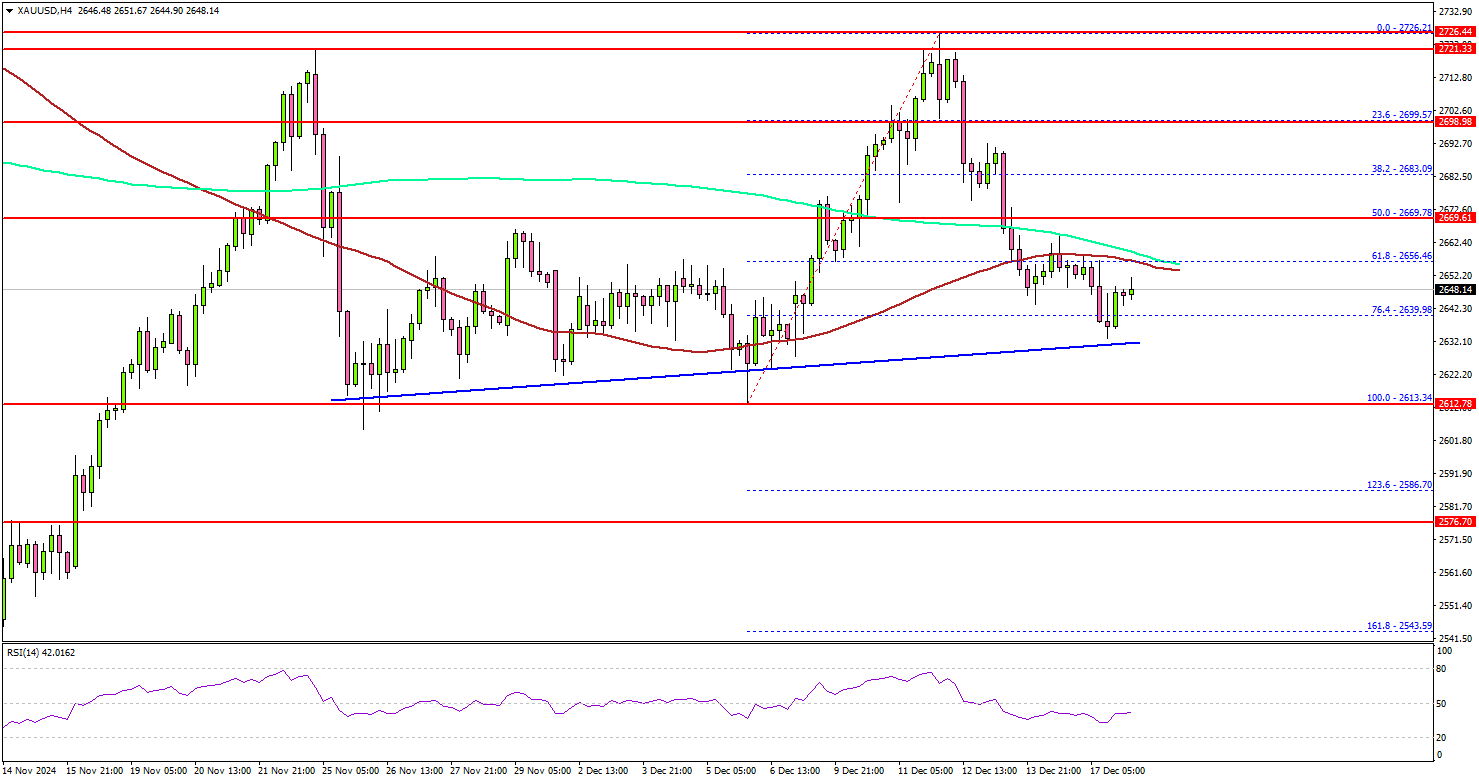
It even settled below the 100 Simple Moving Average (red, 4 hours) and the 200 Simple Moving Average (green, 4 hours). On the downside, initial support is near the $2,630.
There is also a connecting bullish trend line forming with support at $2,630 on the same chart. The first major support is near the $2,610 level. The main support is now $2,600. A downside break below the $2,600 support might call for more downsides.
The next major support is near the $2,575 level. On the upside, immediate resistance is near the $2,665 level. The first major resistance sits near the $2,670 level.
A clear move above the $2,670 resistance could open the doors for more upsides. The next major resistance could be $2,700, above which the price could rally toward the $2,720 level.
Looking at Oil, there was a decent increase, but the bulls seem to be facing hurdles near the $71.50 level.
Economic Releases to Watch Today
- Euro Zone CPI for Nov 2024 (YoY) - Forecast +2.3%, versus +2.3% previous.
- Euro Zone CPI for Nov 2024 (MoM) - Forecast -0.3%, versus -0.3% previous.
- US Housing Starts for Nov 2024 (MoM) – Forecast 1.340M, versus 1.311M previous.
- US Building Permits for Nov 2024 (MoM) – Forecast 1.430M, versus 1.419M previous.