Sample Category Title
Elliott Wave View: US OIL
A break below the small best fit channel on the daily chart indicated a trend change for US Oil.
Members were then advised to enter a short position. Short positions are now positive.
Summary: Use the small best fit channel on the daily Elliott wave count. If price breaks below the lower edge, then expect Oil has changed trend. The target would be at least a new low below 47.06; it should be comfortably below that point. Expect price may continue higher while it remains within the channel.
New updates to this analysis are in bold.
MONTHLY ELLIOTT WAVE COUNT
Within the bear market, cycle wave b is seen as ending in May 2011. Therea!er, a five wave structure downwards for cycle wave c begins.
Within cycle wave c, at this stage it does not look like primary wave 5 could be complete. That would only be possible if primary wave 4 was over too quickly.
Primary wave 1 is a short impulse lasting five months.
Primary wave 2 is a very deep 0.94 zigzag lasting 22 months. Primary wave 3 is a complete impulse with no Fibonacci ratio to primary wave 1. It lasted 30 months. Primary wave 4 is likely to exhibit alternation with primary wave 2. Primary wave 4 is most likely to be a flat, combination or triangle. Within all of these types of structures, the first movement subdivides as a three. The least likely structure for primary wave 4 is a zigzag.
Primary wave 4 is likely to end within the price territory of the fourth wave of one lesser degree; intermediate wave (4) has its range from 42.03 to 62.58.
If primary wave 4 is incomplete, then it looks like it may not remain contained within the channel. Sometimes fourth waves overshoot channels and this is why Elliott developed a second technique to redraw the channel when it does not contain a fourth wave.
Primary wave 4 is most likely to be shallow to exhibit alternation in depth with primary wave 2. So far it has passed the 0.382 Fibonacci ratio at 45.52. It may now continue to move mostly sideways in a large range.
Primary wave 4 may not move into primary wave 1 price territory above 74.96.
At this stage, primary wave 4 has completed intermediate wave (A) only. Intermediate wave (B) is incomplete.
WEEKLY ELLIOTT WAVE COUNT
Minor wave C downwards must subdivide as a five wave structure.
Within minor wave C, minute waves i and ii should be complete and minute wave iii must be incomplete. Upwards movement, which is labelled minuette wave (ii), cannot be minute wave iv as it overlaps back into minute wave i price territory.
Within minute wave iii, minuette wave (i) is complete and minuette wave (ii) now looks most likely to be over.
small best fit channel is drawn about the zigzag of minuette wave (ii). This channel is now breached providing trend channel confirmation of a trend change. This wave count would now expect an increase in downwards momentum.
Minuette wave (iii) must make a new low below the end of minuette wave (i) at 47.06. It must move far enough below that point to allow for subsequent upwards movement for minuette wave (iv) to unfold and remain below minuette wave (i) price territory.
Within minuette wave (iii), no second wave correction may move beyond the start of its first wave above 53.76.
The cyan trend line is drawn from the high labelled minor wave B to the next swing high labelled minute wave ii. This is a Magee trend line for a bear market. Expect that US Oil is most likely in a downwards trend as long as price remains below this cyan trend line.
TECHNICAL ANALYSIS
DAILY CHART
The candlestick of the 12th of April completes a Bearish Engulfing Candlestick reversal pattern. The important condition for this pattern (where the close of the second candlestick is below the open of the first) is met. This is one of the most reliable reversal patterns. It works more o!en than not, but not always. An example of it not working is shown on the 3rd of April.
The reversal pattern of the 12th of April has support from volume whereas the 3rd of April did not. This increases the probability that price may reverse here.
The long lower wick on the last daily candlestick for the 18th of April is bullish, as is stronger volume to support upwards movement of price during the session (indicated by On Balance Volume moving higher for this session). This bounce may move a little higher.
New trend lines are drawn on On Balance Volume. These do not yet have good technical significance, so a breach here would be only a weak signal.
VOLATILITY INDEX
For the last session, here dated the 18th of April, volatility has declined below the 11th of April but price has not made a new high. This divergence is bearish and supports the idea of a trend change here for Oil.
Trade Idea : GBP/USD – Buy at 1.2650
GBP/USD - 1.2818
Most recent candlesticks pattern : N/A
Trend : Near term up
Tenkan-Sen level : 1.2833
Kijun-Sen level : 1.2711
Ichimoku cloud top : 1.2566
Ichimoku cloud bottom : 1.2550
Original strategy :
Buy at 1.2650, Target: 1.2750, Stop: 1.2615
Position : -
Target : -
Stop : -
New strategy :
Buy at 1.2720, Target: 1.2850, Stop: 1.2685
Position : -
Target : -
Stop : -
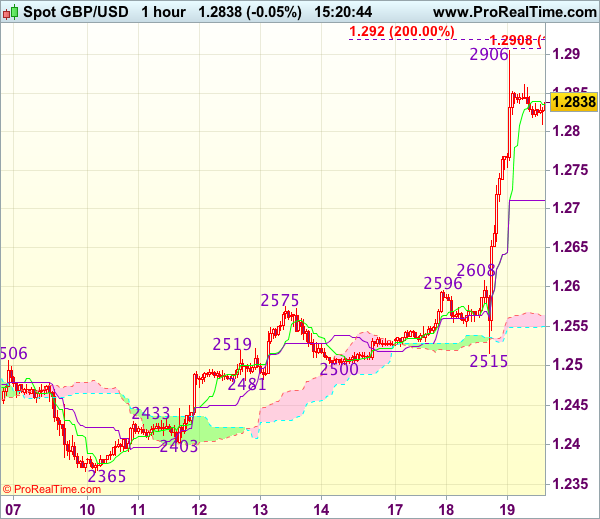
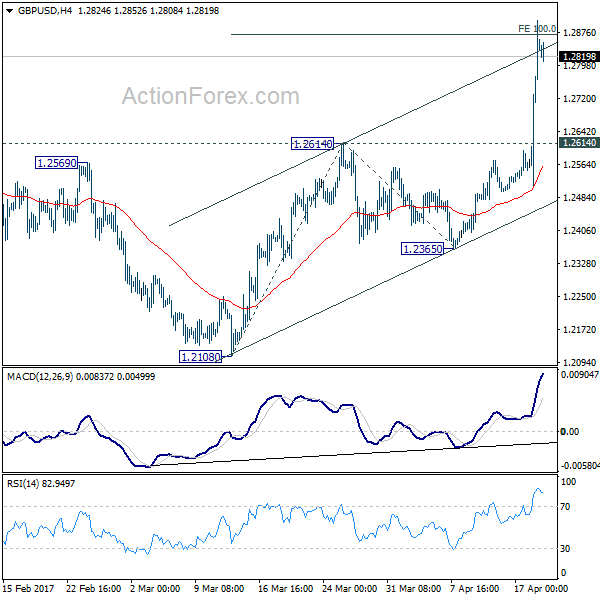
Yesterday’s rally from 1.2515 to 1.2906 signals recent upmove from 1.1986 low is still in progress and although price has eased from 1.2906 reckon downside would be limited to 1.2750 and the Kijun-Sen (now at 1.2711) should hold, bring another rise later, above said resistance at 1.2906 would extend recent rise to 1.2920-30 (2 times extension of 1.2365-1.2575 measuring from 1.2500), then 1.2950 but loss of near term upward momentum should prevent sharp move beyond 1.2990-00 (1.236 times projection of 1.2109-1.2616 measuring from 1.2365 and psychological resistance), risk from there is seen for a retreat to take place later.
In view of this, would not chase this rise here and would be prudent to buy cable on subsequent pullback as price should stay above the Kijun-Sen (now at 1.2711), bring another rise later. Below 1.2690-00 would defer and risk correction to 1.2660 but price should stay well above 1.2608-16 (previous resistance now support), bring another upmove.
US Homebuilding Activity And Manufacturing Production Raise Concerns Over Q1 GDP Growth
'The economy seems to have hit a soft patch in the first quarter and Fed officials are likely to wait to see the rebound before raising rates again. The clouds from the outlook skies may not lift until late this summer.' - Chris Rupkey, MUFG Union Bank
US homebuilding activity dropped more than expected last month amid the unusually warm weather and weaker manufacturing activity, official figures revealed on Tuesday. The US Department of Commerce reported that housing starts fell 6.8% to a seasonally adjusted rate of 1.22M, as construction of single-family homes in the Midwest posted the largest decline since 2014. Meanwhile, market analysts anticipated a slighter drop to a 1.25M unit rate in March, following the preceding month's upwardly revised 1.30M unit rate. On an annual basis, housing starts were up 9.2%. Data also showed that building permits climbed to a 1.26M unit rate in March, compared to the previous month's upwardly revised 1.22M unit rate, whereas analysts expected a rise to 1.25M unit rate. Separately, the Federal Reserve reported that manufacturing output plunged 0.4% in March, driven by a 3.0% decrease in the motor vehicle and part sector. On a yearly basis, manufacturing output advanced 2.7% in the Q1 of 2017. Both reports raised concerns over the Fed postponing its second rate hike this year. Moreover, the data suggested that the US economy performed weaker than expected in the Q1. Following Tuesday's releases, the US Dollar hit its three week low against a basket of major currencies.
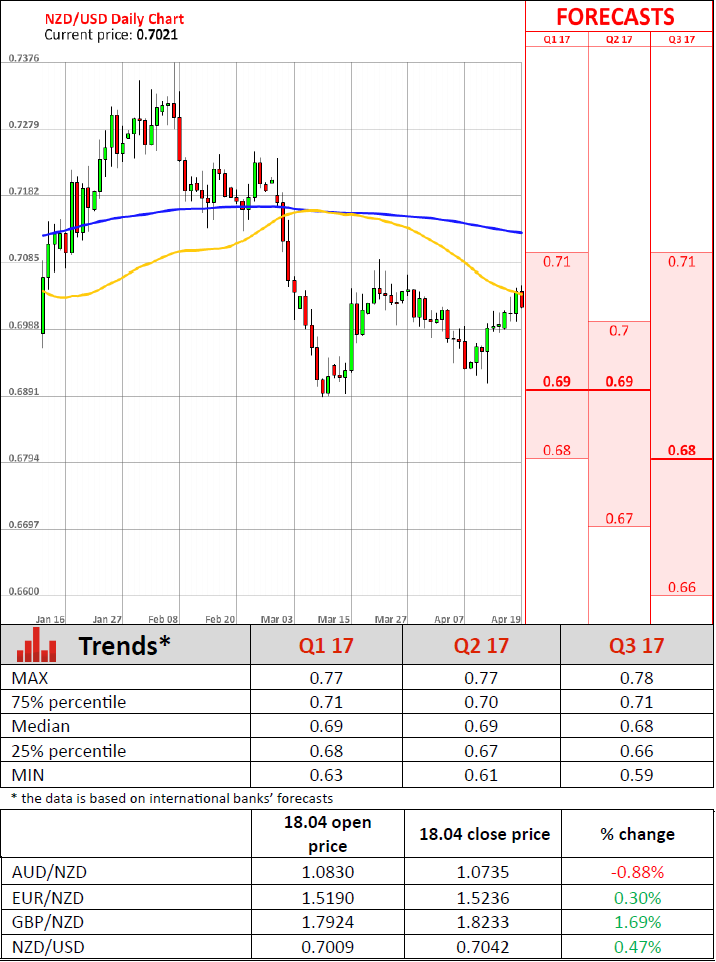
Dairy Product Prices Rise For Third Straight GDT Auction
'The recent very poor weather has raised concerns about production in the near term, and this is likely to have given prices a lift. Although prices remain lower than the levels that we saw in early 2017, they appear to have found a floor.' - Satish Ranchhod, Westpac Bank
Dairy product prices rose for the third consecutive time at the latest Global Dairy Trade auction held on Wednesday in New Zealand, surprising both analysts and farmers. The GDT Price Index advanced 3.1%, with an average selling price of $3,139 per tonne, after rising 1.6% at the prior auction. As analysts expected, a 50% rebound since mid-2016 was temporary but, however, prices managed to find a strong footing. Moreover, recent flooding events in New Zealand pointed to possible supply shortages. Therefore, dairy product prices are set to rise further. The whole milk price rose 3.5% to $2,998 per tonne, while the skim milk price climbed 7.1% to $2,044 per tonne. The butter price jumped 2.9% to $4,892 per tonne, whereas prices of cheddar surged 6.0% to $3,462 per tonne. The lactose price increased 1.2% to $935. On the negative side, the price of anhydrous milk fat dropped 0.5% to $5,930 per tonne, while the price of rennet casein fell 3.8% to $6,020. A total of 22,927 tonnes was sold at the Wednesday auction, up 1.3% from the preceding auction. Since the dairy sector accounts for about 7% of New Zealand's Gross Domestic Product, the Kiwi is expected to trade higher during today's session. The GDT auction ias owned by New Zealand's dairy processor Fonterra.
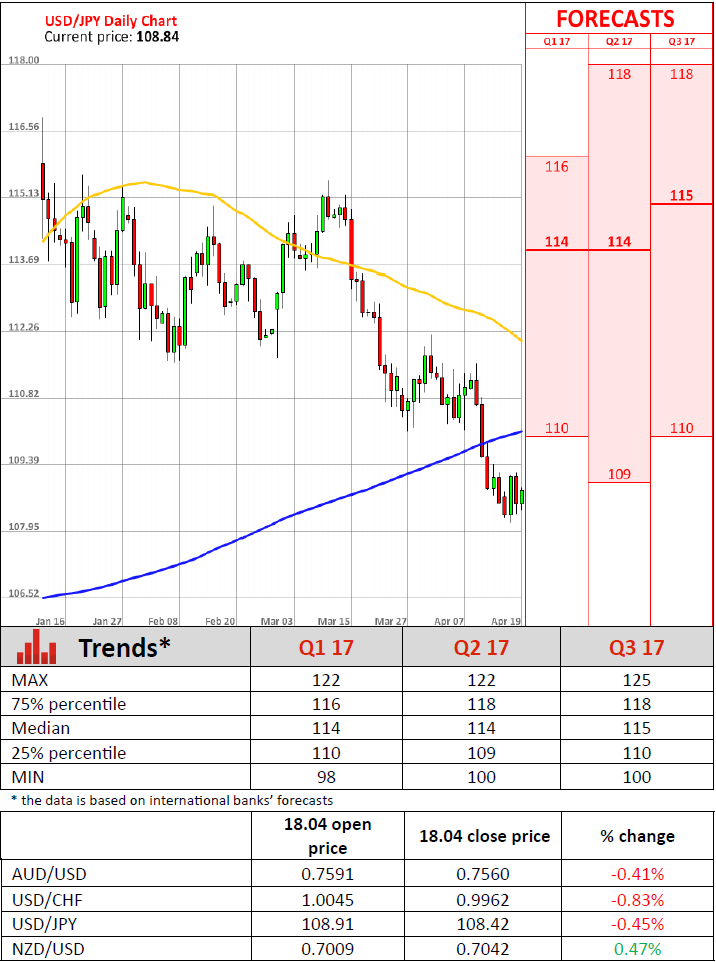
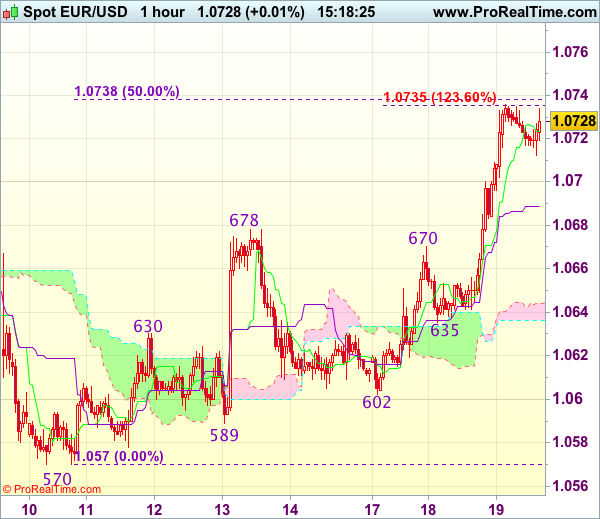
Trade Idea : EUR/USD – Buy at 1.0690
EUR/USD - 1.0733
Most recent candlesticks pattern : N/A
Trend : Near term down
Tenkan-Sen level : 1.0725
Kijun-Sen level : 1.0689
Ichimoku cloud top : 1.0644
Ichimoku cloud bottom : 1.0636
Original strategy :
Buy at 1.0675, Target: 1.0775, Stop: 1.0640
Position : -
Target : -
Stop : -
New strategy :
Buy at 1.0675, Target: 1.0775, Stop: 1.0640
Position : -
Target : -
Stop : -
The single currency has maintained a firm undertone after yesterday’s rally, adding credence to our view that the erratic rise from 1.0570 low is still in progress and upside risk remains for further gain to 1.0738-40 (50% Fibonacci retracement of 1.0906-1.0570) and possibly towards 1.0775-80 (61.8% Fibonacci retracement) but reckon 1.0800-10 would hold from here, bring retreat later.
In view of this, would not chase this rise here and would be prudent to buy euro on pullback as the Kijun-Sen (now at 1.0689) should limit downside. Only below support at 1.0635 would abort and signal top is formed instead, risk weakness towards 1.0602 support.
Technical Outlook: GBPUSD May Extend Gains Beyond 1.3000 On Strong Bullish Sentimen
Cable eased to 1.2800 handle on Wednesday, after strong rally on Tuesday that peaked at 1.2904, the highest since early Oct 2016. Strong rally that eventually broke above the top of consolidation of post-UK referendum fall has generated strong bullish signal for further upside, as the base has formed at 1.2000 zone. Firm bullish sentiment that was established on Tuesday's call for an early election in UK, is expected to drive the price above psychological 1.3000 barrier for possible attack at 1.3113/43 pivots (weekly cloud base/Fibo 38.2% of post-referendum 1.5015/1.1986 fall). Meantime, the pair is trading within narrow consolidation which is so far holding above 1.2800 handle (approx Fibo 23.6% of Tuesday's 1.2513/1.2904 rally), with extended dips expected not to exceed supports at 1.2755 (Fibo 38.2%) and 1.2705 (former high of 02 Feb / 50% retracement).
Res: 1.2859, 1.2904, 1.2950, 1.3000
Sup: 1.2800, 1.2755, 1.2704, 1.2662
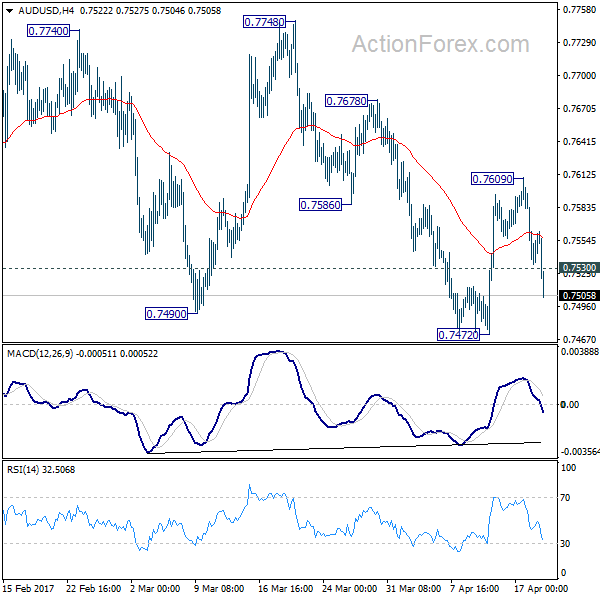
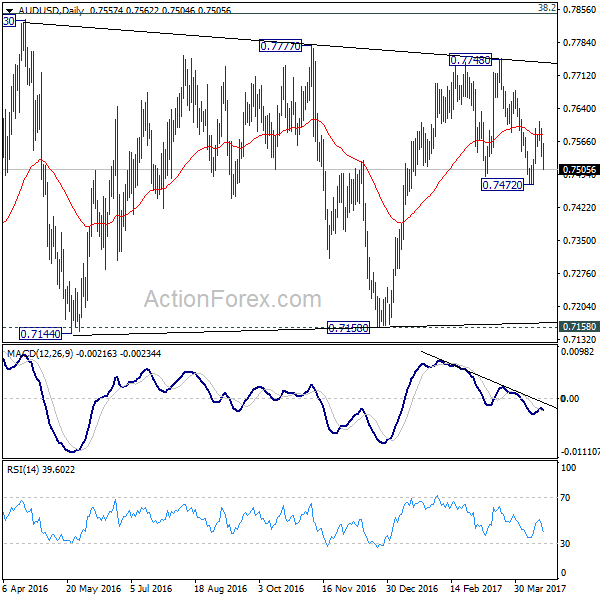
AUD/USD Daily Outlook
Daily Pivots: (S1) 0.7529; (P) 0.7563; (R1) 0.7592; More...
The break of 0.7530 minor support suggests that rebound from 0.7472 has completed at 0.7609 already. Intraday bias in AUD/USD is turned back to the downside for 0.7472 first. Firm break there will revive the case that whole rise from 0.7158 is completed at 0.7740. In that case, AUD/USD will target a test on 0.7158 key support level next. Meanwhile, above 0.7609 will turn bias back to the upside for 0.7748.
In the bigger picture, we're still treating price actions from 0.6826 low as a correction. And, as long as 38.2% retracement of 0.9504 to 0.6826 at 0.7849 holds, long term down trend from 1.1079 is expected to resume sooner or later. Break of 0.6826 low will target 0.6008 key support level. However, firm break of 0.7849 will indicate that rise from 0.6826 is developing into a medium term rebound, rather than a sideway pattern. In such case, stronger rise should be seen to 55 month EMA (now at 0.8144) and above.
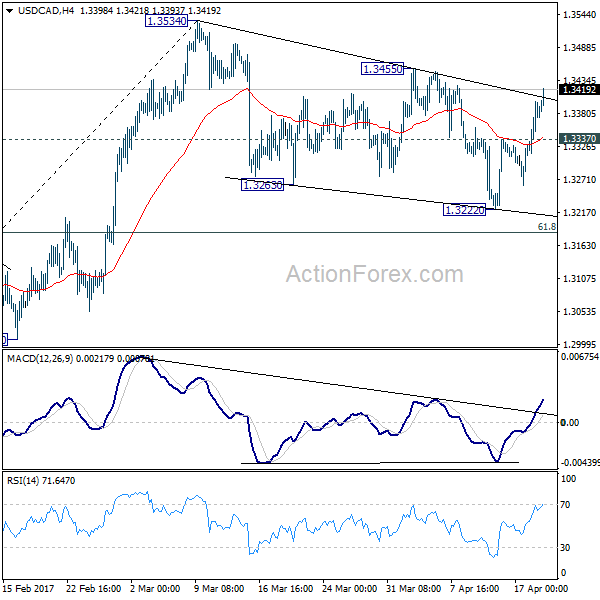
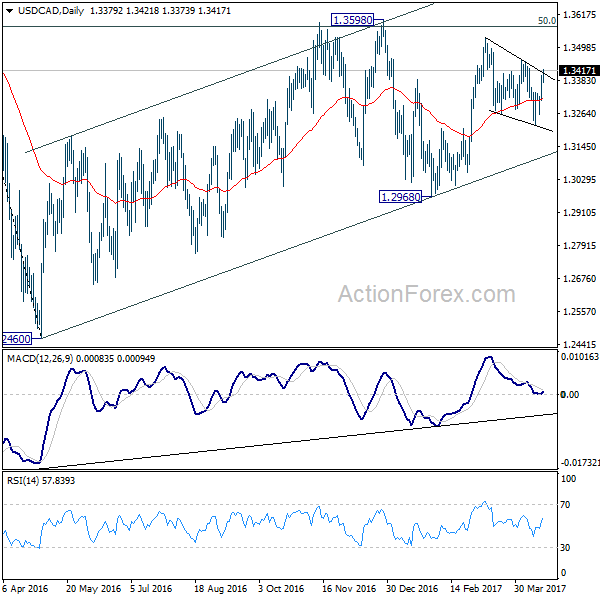
USD/CAD Daily Outlook
Daily Pivots: (S1) 1.3328; (P) 1.3364; (R1) 1.3416; More....
USD/CAD's rise from 1.3222 continues and reaches as high as 1.3421 so far. Intraday bias remains on the upside for 1.3455 resistance. As noted before, correction from 1.3534 is likely finished with three waves down to 1.3222.FIrm break of 1.3455 will confirm this bullish case and send USD/CAD to 1.3598 resistance. In that case, whole rise from 1.2460 is likely resuming too. On the downside, below 1.3337 minor support will bring another fall. But we'd expect strong support from 61.8% retracement of 1.2968 to 1.3534 at 1.3184 to contain downside and bring rebound.
In the bigger picture, price actions from 1.4689 medium term top are seen as a correction pattern. The first leg has completed at 1.2460. The second leg from 1.2460 is likely still in progress and could target 61.8% retracement of 1.4689 to 1.2460 at 1.3838. We'd look for reversal signal there to start the third leg. However, break of 1.2968 will argue that the third leg has already started and should at least bring a retest of 1.2460 low. Meanwhile, sustained trading above 1.3838 would pave the way to retest 1.4689 high.
GBP/USD Daily Outlook
Daily Pivots: (S1) 1.2603; (P) 1.2753; (R1) 1.2993; More...
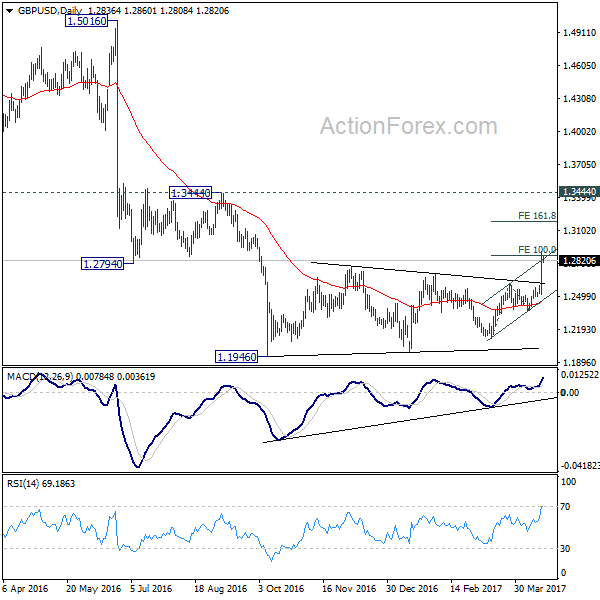
GBP/USD rises to as high as 1.2903 so far and met mentioned target of 100% projection of 1.2108 to 1.2614 from 1.2365 at 1.2871. There is no sign of topping yet. Based on current momentum, the rally would possibly extend to 161.8% retracement at 1.3184. Still, price actions from 1.1946 are seen as a correction. Hence we'd expect strong resistance below 1.3444 to bring larger down trend resumption. on the downside, break of 1.2614 resistance turned support will turn bias back to the downside for 1.2365 support first.
In the bigger picture, fall from 1.7190 is seen as part of the down trend from 2.1161. There is no sign of medium term reversal yet. Sustained trading below 61.8% projection of 2.1161 to 1.3503 from 1.7190 at 1.2457 will target 100% projection at 0.9532. Overall, break of 1.3444 resistance is needed to confirm medium term bottoming. Otherwise, outlook will remain bearish.
EUR/USD Daily Outlook
Daily Pivots: (S1) 1.0664; (P) 1.0700 (R1) 1.0766; More....
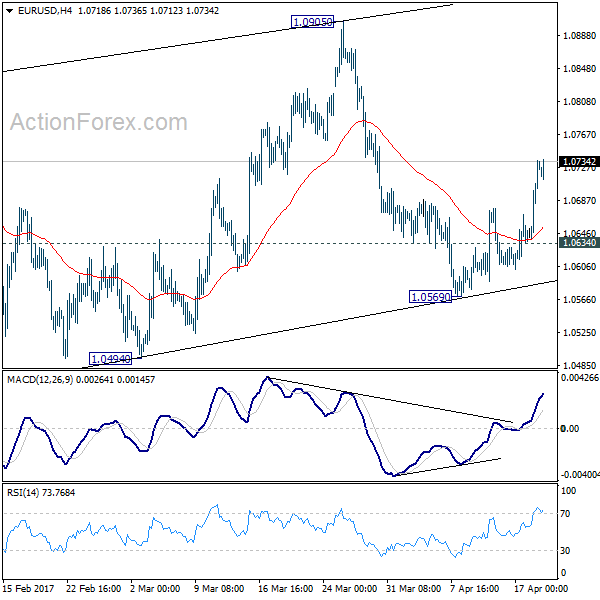
Corrective rise from 1.0339 is still in progress with 1.0569 as another rising leg. Intraday bias in EUR/USD remains on the upside for 1.0905 resistance and above. We'll pay attention to topping signal above 1.0905 again, as we'd expect larger down trend to resume later. On the downside, break of 1.0634 minor support will turn intraday bias back to the downside for 1.0569 instead.
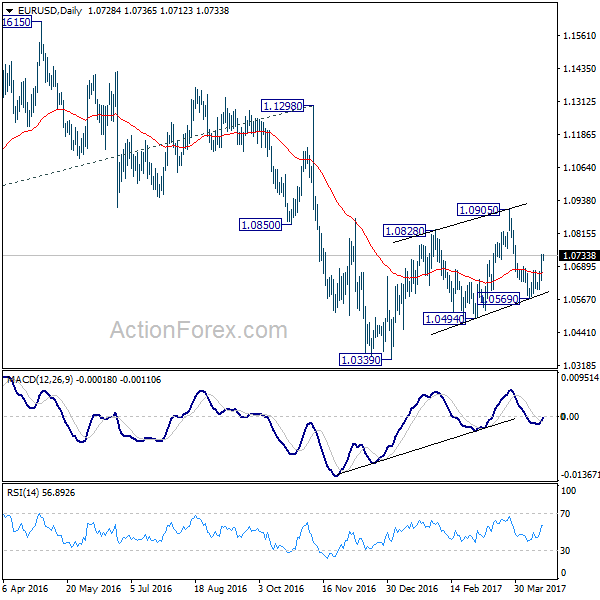
In the bigger picture, as long as 1.1298 key resistance holds, whole down trend from 1.6039 (2008 high) is still expected to continue. Break of 1.0339 low will send EUR/USD through parity to 61.8% projection of 1.3993 to 1.0461 from 1.1298 at 0.9115. However, considering bullish convergence condition in weekly MACD, break of 1.1298 will indicate term reversal. this would also be supported by sustained trading above 55 week EMA.