
Sample Category Title
Elliott Wave Trade Ideas Performance Update
The long position entered in EUR/GBP at 0.8620 finally met our upside upside at 0.8720 as the pair rebounded to 0.8735, however, euro ran into renewed selling interest there and the pair then tumbled from there to as low as 0.8485 late last week.
A short position was entered in USD/CAD at 1.3340, however, as the greenback continued finding decent demand just above previous support at 1.3278 (last week’s low) and has rebounded, we exited the position earlier today at 1.3359 with small loss.
The long positions entered in AUD/USD the week before at 0.7645 is still holding at the moment.
In short, 3 positions were entered with total profit of 81 points and the positions are listed below.
22 Mar: AUD/USD - Long at 0.7645,
23 Mar: EUR/GBP - Long at 0.8620, exited at 0.8720 (+ 100 points)
31 Mar: USD/CAD - Short at 1.3340, exited at 1.3359 (- 19 points)
| AUD EUR/JPY EUR/GBP CAD
Jan - 15 -275 - 35 -120
Feb + 140 -17 - 40 +11
Mar + 20 +115 +132 - 19
Apr
May
Jun
Jul
Aug
Sep
Oct
Nov
Dec
Y-T-D + 145 - 177 + 57 + 38
Candlesticks and Ichimoku Trade Ideas Performance Update
We sold dollar against yen last week at 111.20 and although the pair retreated from 111.32, the greenback found renewed buying interest at 110.72 and rebounded again, we exited the position with small profit at 111.00 and price eventually rose to as high as 112.20 before dropping again.
We also sold dollar against euro and Swiss franc last week, a long position was entered in EUR/USD at 1.0800 and a short position was entered in USD/CHF at 0.9910, both positions ended with different levels of loss as the greenback reversed previous weakness.
No position was entered in cable last week.
In short, 3 positions were entered among all 4 currency pairs with total loss of 38 points and the position are listed below:
29 Mar : USD/JPY - Short at 111.20, exited at 111.00 (+ 20 points)
29 Mar : EUR/USD - Long at 1.0800, exited at 1.0765 (- 35 points)
29 Mar : USD/CHF - Short at 0.9910, exited at 0.9933 (- 23 points)
| JPY EUR CHF GBP
Jan + 167 - 85 - 10 + 50
Feb + 200 +150 +93 - 59
Mar -23 -70 -23 - 35
Apr
May
Jun
Jul
Aug
Sep
Oct
Nov
Dec
Y-T-D + 344 - 10 +60 -44
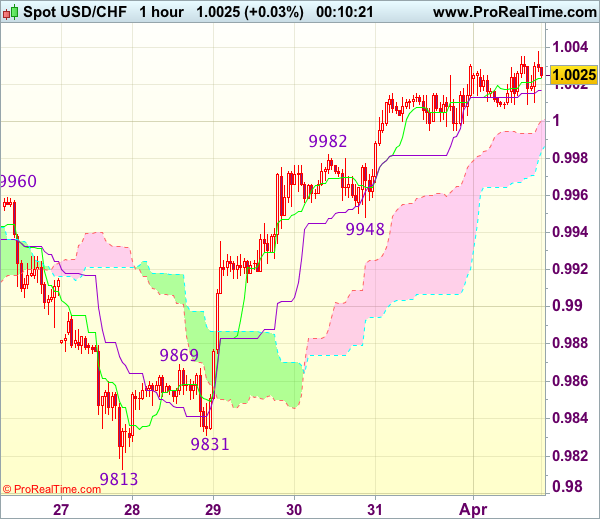
Trade Idea Wrap-up: USD/CHF – Buy at 0.9950
USD/CHF - 1.0025
Most recent candlesticks pattern : N/A
Trend : Near term up
Tenkan-Sen level : 1.0024
Kijun-Sen level : 1.0017
Ichimoku cloud top : 1.0001
Ichimoku cloud bottom : 0.9984
Original strategy :
Buy at 0.9950, Target: 1.0050, Stop: 0.9915
Position : -
Target : -
Stop : -
New strategy :
Buy at 0.9950, Target: 1.0050, Stop: 0.9915
Position : -
Target : -
Stop : -
As the greenback has continued trading with a firm undertone, suggesting recent rise from last week’s low at 0.9813 is still in progress and bullishness remains for this move to extend gain to previous support at 1.0060 (now resistance), however, loss of upward momentum should prevent sharp move beyond resistance at 1.0109, risk from there has increased for a retreat to take place later.
In view of this, would not chase this rise here and would be prudent to buy dollar on pullback as said support at 0.9948 should limit downside. Below 0.9931 (50% Fibonacci retracement of 0.9831-1.0031) would abort and signal top is formed instead, bring correction to 0.9905-10 (61.8% Fibonacci retracement) but reckon previous resistance at 0.9869 would hold from here.
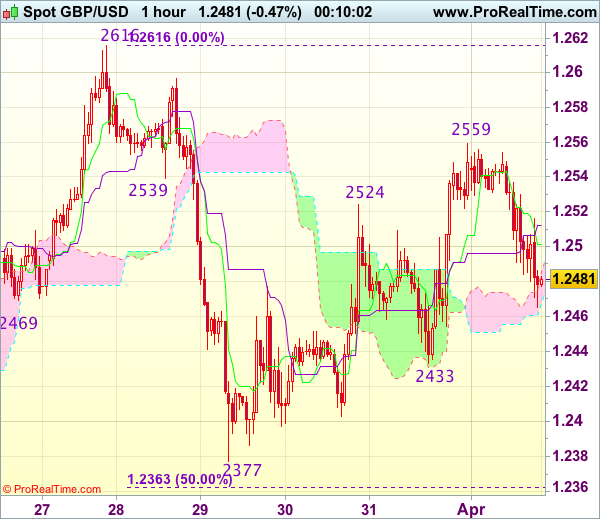
Trade Idea Wrap-up: GBP/USD – Stand aside
GBP/USD - 1.2482
Most recent candlesticks pattern : N/A
Trend : Near term up
Tenkan-Sen level : 1.2501
Kijun-Sen level : 1.2512
Ichimoku cloud top : 1.2486
Ichimoku cloud bottom : 1.2468
New strategy :
Stand aside
Position : -
Target : -
Stop : -
Although cable has retreated after meeting resistance at 1.2559 on Friday on active cross-trading in sterling and consolidation with mild downside is seen for weakness to 1.2450-55, break of support at 1.2433 is needed to signal top has been formed at 1.2559, bring further fall towards 1.2400-05. Looking ahead, only a drop below 1.2400-05 would signal the rebound from 1.2377 has ended, bring retest of 1.2377 first.
In view of this, would not chase this fall here and would be prudent to stand aside for now. Above 1.2515-20 would bring another bounce towards 1.2559 but break there is needed to signal the erratic rise from 1.2377 (last week’s low) is still in progress and may extend gain towards 1.2570-75, however, as broad outlook remains consolidative, reckon upside would be limited to 1.2595-00 and price should falter below last week’s high at 1.2616.
WTI Crude Oil Hugging $50 at Start of Week
West Texas crude has started the trading week quietly, as the pair trades just above the symbolic $50 in the North American session. On the release front, there is just one major release on the schedule. ISM Manufacturing PMI dropped to 57.2, matching the forecast.
It was a month to forget for crude, as prices sagged 6.0 percent. Weak oil prices is not the scenario that OPEC scripted, as its landmark deal to cut production was supposed to send crude above $60 a barrel and beyond. Instead, prices have fallen since the deal took effect on January 1. OPEC members have kept to the deal, as compliance levels have been exemplary. Still, the world remains awash in oil, as increasing US production has offset the OPEC cuts. US Crude Inventories continue to show surpluses, most of which have been higher than the forecast. Last week, US crude inventories have reached an all-time high of 534.0 million barrels, so oil prices may have trouble staying above the $50 level.
Donald Trump's young presidency has been rocky, with Trump's controversial statements and actions making headlines almost daily. The battles with the media continue, an economic policy remains a mystery, and Trump suffered a major setback as he couldn't even muster a vote over his healthcare bill. Despite these hiccups, the US economy hasn't missed a beat in 2017. The CB consumer confidence report soared to 125.6 in March, and strong consumer confidence levels should translate into increased consumer spending. GDP for the fourth quarter was revised to 2.1%, up from 1.9% in the previous GDP report. This points to strong growth for the economy,
The discussions around the monetary policy tables are not whether the Fed will raise rates, but rather how many times will the Fed press the rate trigger in 2017. The Fed has forecast two more hikes this year, but the markets are looking for three hikes, and the US dollar took a hit last week as the markets were disappointed with the Fed's dovish rate statement. The Fed will release the minutes of its March meeting on Wednesday, and the markets will be looking for clues as to the timing of a possible rate hike.
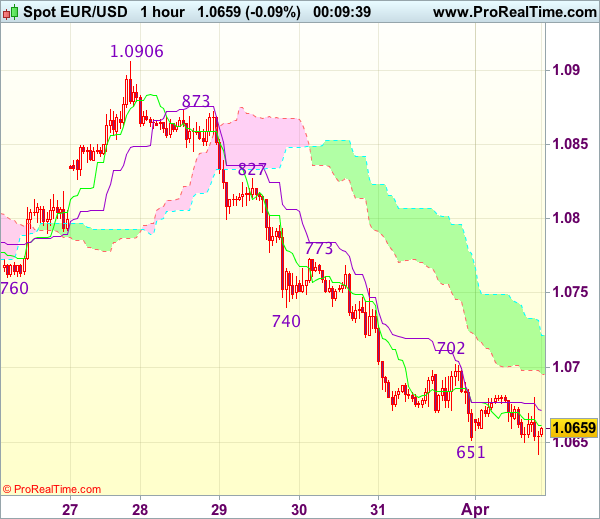
Trade Idea Wrap-up: EUR/USD – Sell at 1.0740
EUR/USD - 1.0658
Most recent candlesticks pattern : N/A
Trend : Near term down
Tenkan-Sen level : 1.0661
Kijun-Sen level : 1.0672
Ichimoku cloud top : 1.0722
Ichimoku cloud bottom : 1.0695
Original strategy :
Sell at 1.0740, Target: 1.0625, Stop: 1.0775
Position : -
Target : -
Stop : -
New strategy :
Sell at 1.0740, Target: 1.0625, Stop: 1.0775
Position : -
Target : -
Stop : -
As the single currency has remained under pressure after last week’s selloff, suggesting the decline from 1.0906 top is still in progress and bearishness remains for this fall to extend further weakness to 1.0620-25, then test of previous chart support at 1.0600, however, a sustained breach below the latter level is needed to retain downside bias for subsequent selloff to 1.0570-75 first, otherwise, risk from there is seen for a rebound later.
In view of this, would not chase this fall here and would be prudent to sell dollar on recovery as 1.0735-40 should limit upside. Only a firm break above resistance at 1.0773 would suggest low is formed instead, bring a stronger rebound to 1.0800 but resistance at 1.0827 should remain intact.
BoC Survey Joins List of Indicators Pointing to Stronger Canadian Economy
Highlights:
- The future sales measure inched lower but remained above its long-run average the long-run average. The 'indicators of future sales' measure rose to a 5-year high.
- Hiring intentions rose for a third consecutive quarter and business machinery and equipment investment intentions jumped to their highest level since Q3 2010 (and matched the second-highest level on record)
- Capacity pressures tightened modestly although indicators of labour shortages eased.
- 94% of respondents expected inflation in the 1% to 3% Bank of Canada target range. That is up from 89% in Q4/16 and with the increase reflecting more respondents expecting growth in the top 2%-3% half of the range.
- Credit conditions eased modestly both from the borrower's perspective and the lender's perspective (from the concurrently released Senior Loan Officer Survey)
Our Take:
The data from the Q1 BOS remains consistent with earlier indicators (GDP growth, for example, is on track to outpace U.S. growth for a third consecutive quarter in Q1/17) pointing to a firming in the Canadian economic backdrop. Expectations for future sales growth moderated but held above long-run average levels and hiring intentions improved for a third consecutive quarter (consistent with strong labour market improvement to-date in 2017). Perhaps most encouragingly, business investment intentions surged to their highest level since Q3 2010, and matched the second-highest reading on record, despite reports of significant uncertainty around the outlook tied to potential trade disruptions and changes to U.S. taxation that could hurt Canadian competitiveness. The business investment intentions in the BOS survey are in sharp contrast to a pull-back in private business investment intentions in a closely-watched annual CAPEX intentions survey from Statistics Canada. The indicator of labour market shortages did tick lower but overall capacity pressures tightened slightly. Bank of Canada Governor Poloz remained adamant last week that, notwithstanding a run of good economic data, the economy continues to run well-below its long-run production capacity. Today's BOS report will not necessarily change the Bank's view ahead of next week's policy decision; however, the longer the run of stronger economic data persists, the harder that position will be to defend.
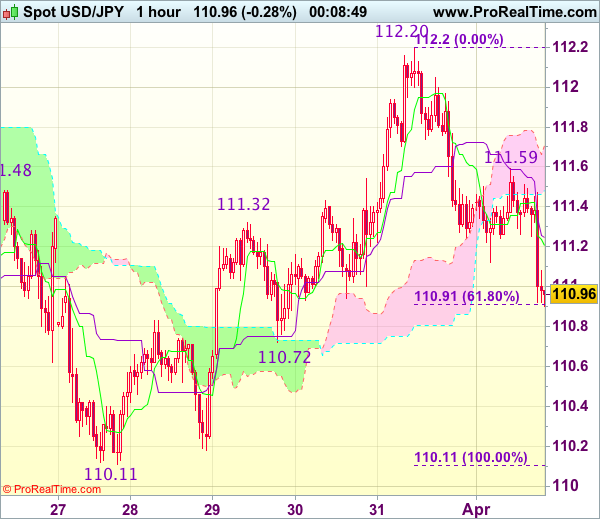
Trade Idea Wrap-up: USD/JPY – Stand aside
USD/JPY - 111.02
Most recent candlesticks pattern : N/A
Trend : Near term up
Tenkan-Sen level : 111.21
Kijun-Sen level : 111.25
Ichimoku cloud top : 111.71
Ichimoku cloud bottom : 111.48
New strategy :
Stand aside
Position : -
Target : -
Stop : -
As the greenback has fallen again on renewed cross-buying in yen, adding credence to our view that top has been formed at 112.20 last week and consolidation with mild downside bias remains for test of previous support at 110.72, however, near term oversold condition should limit downside to 110.50 and price should stay well above support at 110.11, bring rebound later.
In view of this, would not chase this fall here and would be prudent to stand aside in the meantime. Above the Kijun-Sen (now at 111.25) would bring recovery to 111.45-50 but break of intra-day resistance at 111.59 is needed to signal low is formed, bring a stronger rebound to 111.90-00 later.
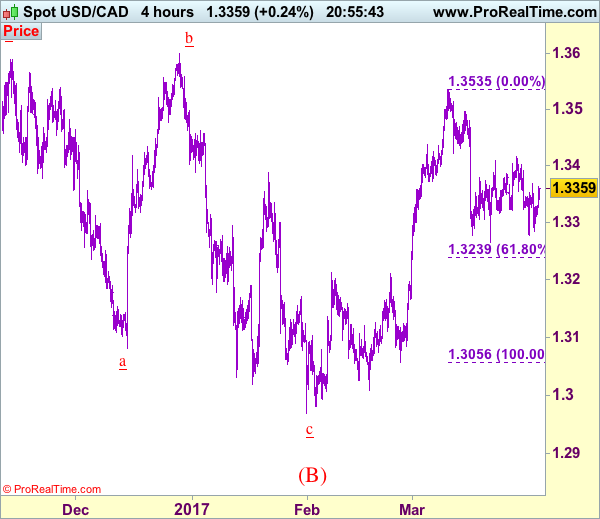
Trade Idea: USD/CAD – Exit short entered at 1.3340
USD/CAD - 1.3359
Recent wave: Only wave v of c has ended at 0.9407 and wave C of major A-B-C correction is underway for headway to 1.4700
Trend: Near term up
Original strategy :
Sold at 1.3340, Target: 1.3200, Stop: 1.3400
Position: - Short at 1.3340
Target: - 1.3200
Stop: - 1.3400
New strategy :
Exit short entered at 1.3340, Target: 1.3200, Stop: 1.3400
Position: - Short at 1.3340
Target: -
Stop:-
As the greenback has rebounded again after holding above indicated previous support at 1.3264, suggesting further consolidation would be seen, however, reckon upside would be limited and as long as resistance at 1.3415 holds, mild downside bias remains for another decline, below said support at 1.3264 would add credence to our view that top has been made at 1.3535 earlier this month, bring further fall to 1.3235-40 (61.8% Fibonacci retracement of 1.3056-1.3535) and then 1.3200-10, however, oversold condition should limit downside and reckon 1.3170 would hold from here.
In view of this, would be prudent to exit short entered at 1.3340. Above said resistance at 1.3415 would signal low is formed and shift risk back to upside for a stronger rebound to 1.3450 and possibly test of resistance at 1.3479, however, only break of 1.3495 resistance would indicate the pullback from 1.3535 has ended and bring retest of this level later.
To recap, wave B from 1.3066 is unfolding as an a-b-c and is sub-divided as a: 1.2192, b: 1.2716 and wave c is a 5-waver with i: 1.1983, ii: 1.2506, extended wave iii with minor iii at 1.0206, wave iv ended at 1.0781 and wave v as well as wave iii has ended at 0.9931, hence the subsequent choppy trading is the wave iv which is unfolding as (a)-(b)-(c) with (a) leg of iv ended at 1.0854, followed by (b) leg at 1.0108 and (c) leg as well as the wave iv ended at 1.0674. The wave v is sub-divided by minor wave (i): 0.9980, (ii): 1.0374, (iii): 0.9446, (iv): 0.9913 and (v) as well as v has possibly ended at 0.9407, therefore, consolidation with upside bias is seen for major correction, indicated target at 1.3700 and 1.4000 had been met and further gain to 1.4700 would be seen later.
Gold Steady as ISM Manufacturing PMI Meets Expectations
Gold has posted slight gains in the Monday session. In North American trade, gold is trading at $1252.81 per ounce. On the release front, there is just one major release on the schedule. ISM Manufacturing PMI dropped to 57.2, matching the forecast.
Donald Trump's young presidency has been turbulent, with Trump's controversial statements and actions making headlines almost daily. The battles with the media continue, an economic policy remains a mystery, and Trump suffered a major setback as he couldn't even muster a vote over his healthcare bill. Despite these hiccups, the US economy hasn't missed a beat in 2017. The CB consumer confidence report soared to 125.6 in March, and strong consumer confidence levels should translate into increased consumer spending. GDP for the fourth quarter was revised to 2.1%, up from 1.9% in the previous GDP report. This points to strong growth for the economy,
The discussions around the monetary policy tables are not whether the Fed will raise rates, but rather how many times will the Fed press the rate trigger in 2017. The Fed has forecast two more hikes this year, but the markets are looking for three hikes, and the US dollar took a hit last week as the markets were disappointed with the Fed's dovish rate statement. The Fed will release the minutes of its March meeting on Wednesday, and the markets will be looking for clues as to the timing of a possible rate hike. If the minutes are dovish in tone, gold could head lower.