Sample Category Title
EUR/GBP Daily Outlook
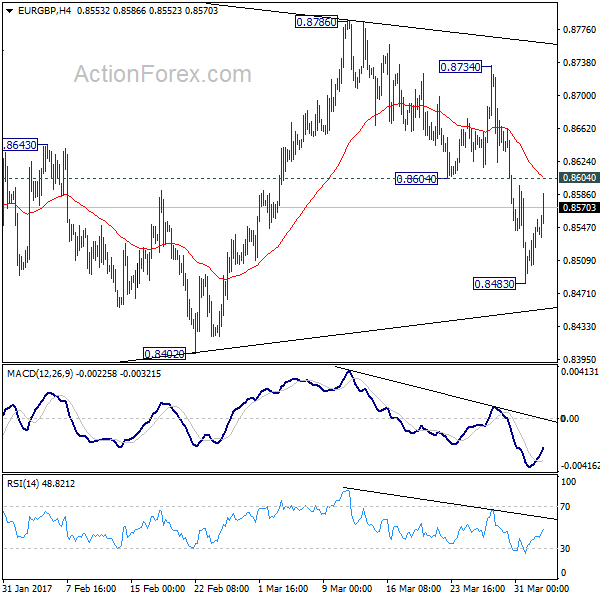
Daily Pivots: (S1) 0.8505; (P) 0.8531; (R1) 0.8571; More...
EUR/GBP recovered after forming a temporary low at 0.8430, ahead of 0.8402 support. Intraday bias is turned neutral first. There is no change in the view that price actions from 0.8303 are a consolidation pattern. And, it's the second leg of the correction from 0.9304. Below 0.8430 will target 0.8402. Break of 0.8402 will resume the fall from 0.9304 to 0.8116/20 cluster support, where the correction should end. Above 0.8604 minor resistance will bring another recovery before fall from 0.9304 resumes.
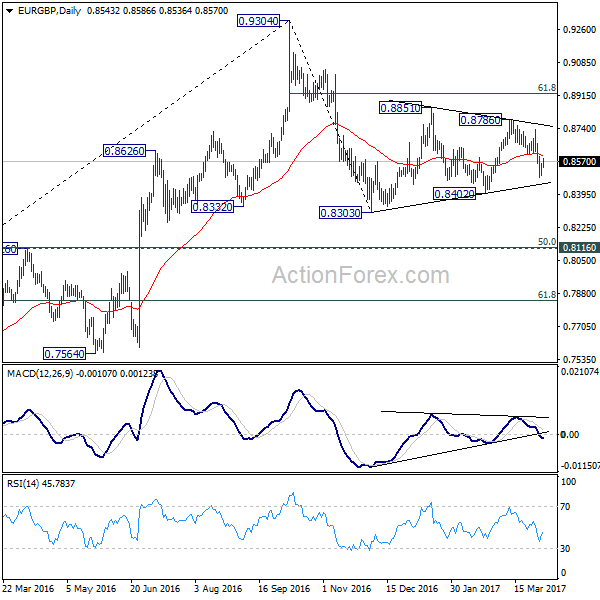
In the bigger picture, price actions from 0.9304 are viewed as a medium term corrective pattern. Such decline is likely ready to resume and should make a new low below 0.8303. At this point, we'd expect strong support from 0.8116 cluster support (50% retracement of 0.6935 to 0.9304 at 0.8120) to contain downside. Break of 0.9304 will pave the way to 0.9799 (2008 high). However, sustained break of 0.8116 could bring deeper decline to next key support level at 0.7564 before the correction completes.
Canadian RBC Manufacturing PMI Jumped To Its Highest Level Since October 2013 In March
For the 24 hours to 23:00 GMT, the USD rose 0.47% against the CAD and closed at 1.3383.
Macroeconomic data showed that Canada's RBC manufacturing PMI advanced to a level of 55.5 in March, expanding at its fastest rate since October 2013, compared to a level of 54.7 recorded in the previous month.
Separately, the Bank of Canada (BoC), in its latest business outlook survey, indicated that the balance of opinion on future sales dropped to 21.0% from 26.0% in the previous quarter.
In the Asian session, at GMT0300, the pair is trading at 1.3383, with the USD trading flat against the CAD from yesterday's close.
The pair is expected to find support at 1.3328, and a fall through could take it to the next support level of 1.3272. The pair is expected to find its first resistance at 1.3419, and a rise through could take it to the next resistance level of 1.3454.
The currency pair is trading above its 20 Hr and 50 Hr moving averages.

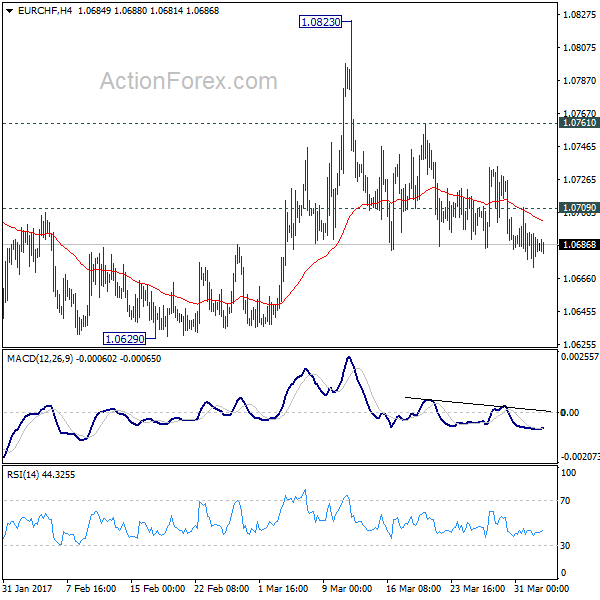
EUR/CHF Daily Outlook
Daily Pivots: (S1) 1.0674; (P) 1.0684; (R1) 1.0695; More...
As noted before, EUR/CHF's rebound form 1.0629 should have completed at 1.0823. Intraday bias stays mildly on the downside for 1.0620/29 key support zone. Decisive break there will resume the larger fall from 1.1198. On the upside, above 1.0709 minor resistance will turn intraday bias neutral. But outlook will be cautiously bearish as long as 1.0761 resistance holds.
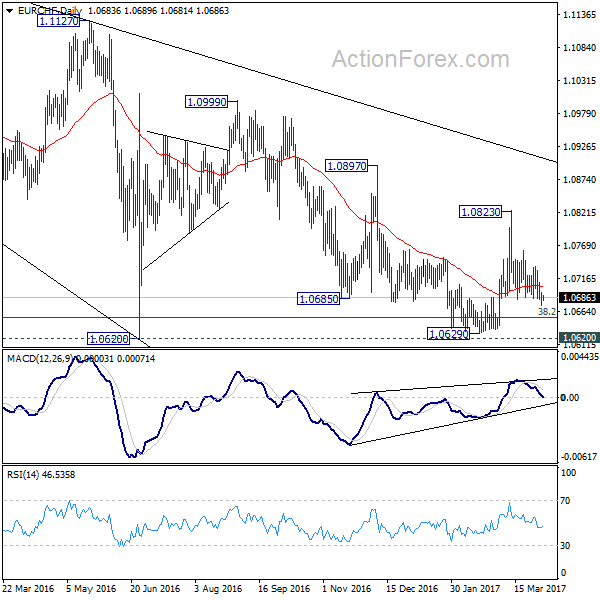
In the bigger picture, the decline from 1.1198 is seen as a corrective move. Current development suggests that it's not completed yet. sustained trading below 38.2% retracement of 0.9771 to 1.1198 at 1.0653 will target 50% retracement at 1.0485. In any case, break of 1.0823 resistance is needed to be the first indication of reversal. Otherwise, deeper fall is still expected even in case of recovery.
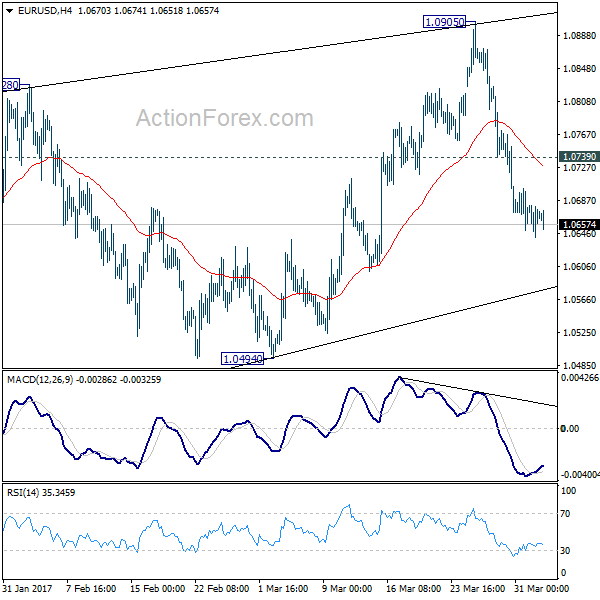
EUR/USD Daily Outlook
Daily Pivots: (S1) 1.0647; (P) 1.0664 (R1) 1.0686; More....
EUR/USD lost some downside momentum with 4 hour MACD crossed above signal line. But deeper decline is still expected with 1.0739 minor resistance intact. Our view is unchanged that corrective rise from 1.0339 is completed at 1.0905. And more importantly, larger down trend is probably resuming. Break of 1.0494 should confirm this bearish case and target 1.0339 low. Further break of 1.0339 will target parity next. On the upside, above 1.0739 minor resistance will delay the bearish case and turn focus back to 1.0905 resistance instead.
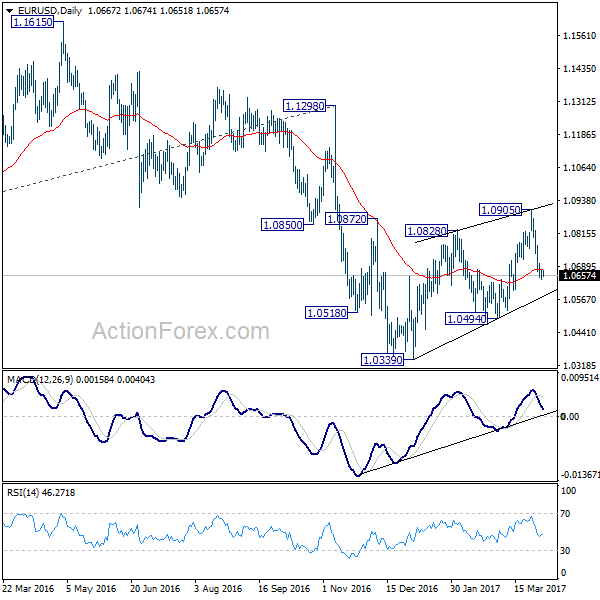
In the bigger picture, as long as 1.1298 key resistance holds, whole down trend from 1.6039 (2008 high) is still expected to continue. Break of 1.0339 low will send EUR/USD through parity to 61.8% projection of 1.3993 to 1.0461 from 1.1298 at 0.9115. However, considering bullish convergence condition in weekly MACD, break of 1.1298 will indicate term reversal. this would also be supported by sustained trading above 55 week EMA.
GBP/USD Daily Outlook
Daily Pivots: (S1) 1.2448; (P) 1.2501; (R1) 1.2538; More...
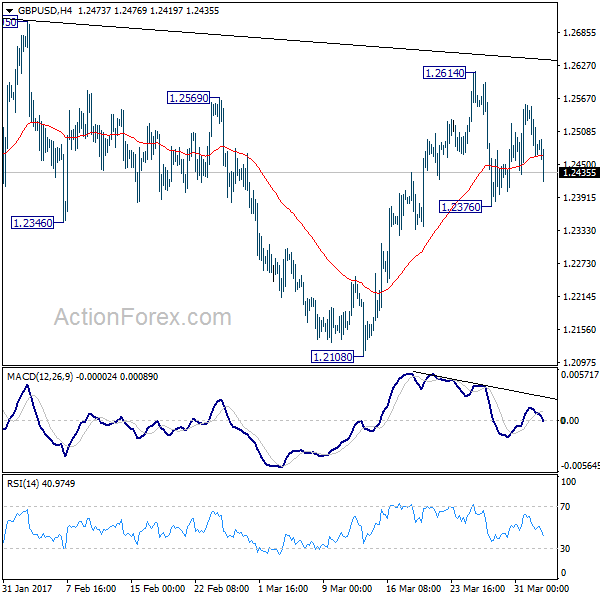
GBP/USD is still bounded in range of 1.2376/2614 and intraday bias stays neutral for the moment. Overall, price actions from 1.1946 are viewed as a consolidation pattern pattern. On the downside, break of 1.2376 will turn bias to the downside for 1.2108 support. Decisive break there will be an early sign of larger down trend resumption. On the upside, break of 1.2614 will extend the rise from 1.2108. But upside should be limited by 1.2705/2774 resistance zone to bring larger down trend resumption eventually.
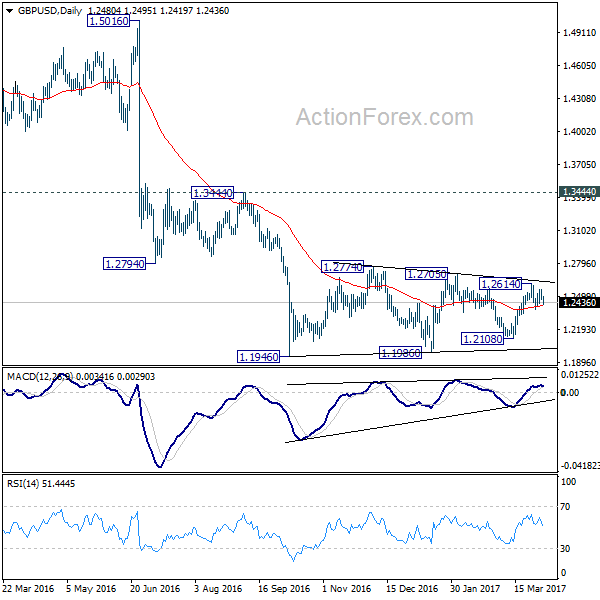
In the bigger picture, fall from 1.7190 is seen as part of the down trend from 2.1161. There is no sign of medium term reversal yet. Sustained trading below 61.8% projection of 2.1161 to 1.3503 from 1.7190 at 1.2457 will target 100% projection at 0.9532. Overall, break of 1.3444 resistance is needed to confirm medium term bottoming. Otherwise, outlook will remain bearish.
RBA Torn Between High Housing Prices And Subdued Inflation
RBA left the cash rate unchanged at 1.5% in April, continuing to struggle between soaring property prices and subdued inflation. Policymakers appeared more optimistic over the global economic outlook than the domestic one. The central bank remained concerned over the rising property prices and warned of the situation that household borrowing growth was outpacing growth in income. We expect RBA to leave its monetary stance unchanged throughout the year.
Economy to show moderate growth
The central bank noted domestic economy continued to show 'moderate growth' in the 'transition following the end of the mining investment boom'. Policymakers acknowledged rising non-mining business investment over the past year and pickup in business confidence. Meanwhile, they also acknowledged some deterioration in the employment market, noting the rise in unemployment rate, modest growth in payrolls as slow wage growth. RBA continued to warn of low inflation.
Inflation remains quite low
As noted in the statement, inflation 'remains quite low'. While the headline reading should 'pick up over the course of 2017 to be above 2%, underlying inflation would rise more gradually with 'growth in labour costs remaining subdued'. Recall that the country's unemployment rate rose to 5.9%, the highest in 13 months, in February, up from 5.7% a month ago. The number of payrolls slipped -0.1K, the first drop in 5 months, while the number of unemployed increased +26K. Headline CPI moderated to +0.5% q/q in 4Q16, from +0.7% in the prior quarter. Core inflation steadied at +0.4% q/q for the quarter.
RBA concerned on house prices
The persistently-high housing prices remained a concern. As suggested in the statement, 'conditions in the housing market continue to vary considerably around the country'. While 'conditions are strong and prices are rising briskly' in some markets, prices are 'declining' in others. It also addressed the situation in the eastern capital cities, noting that 'a considerable additional supply of apartments is scheduled to come on stream over the next couple of years. Growth in rents is the slowest for two decades'. Yet, the above message was only a repeat of previous meeting statements.
Household borrowing outpaced income growth
What's new was the warning that household borrowing growth was outpacing growth in income. Policymakers judged that 'the recently announced supervisory measures should help address the risks associated with high and rising levels of indebtedness'. They added that 'lenders need to ensure that the serviceability metrics that they use are appropriate for current conditions. A reduced reliance on interest-only housing loans in the Australian market would also be a positive development'.
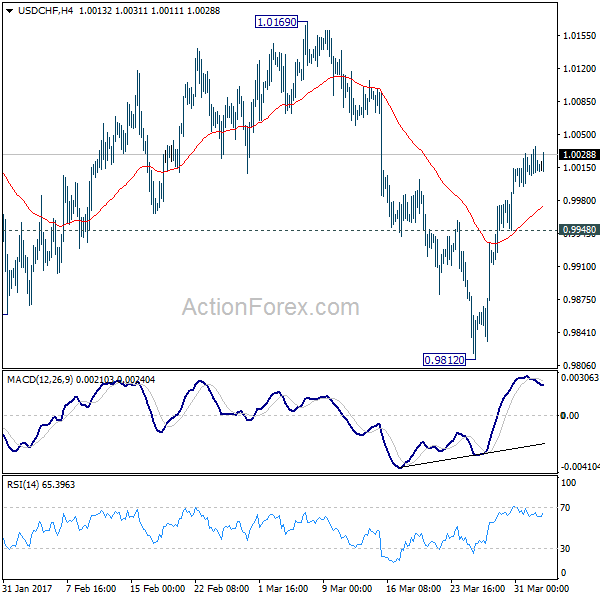
USD/CHF Daily Outlook
Daily Pivots: (S1) 1.0002; (P) 1.0019; (R1) 1.0032; More.....
USD/CHF lost some upside momentum after hitting 110.36 as seen in 4 hour MACD. But still, further rally is in favor with 0.9948 minor support intact. As noted before, corrective decline fall from 1.0342 should have finished with three waves down to 0.9812 already. Sustained trading above 55 day EMA (now at 1.0023) will affirm this bullish case. Break of 1.0169 resistance will confirm and target a test on 1.0342 high. On the downside, however, below 0.9948 minor support will turn bias back to the downside for 0.9812 instead.
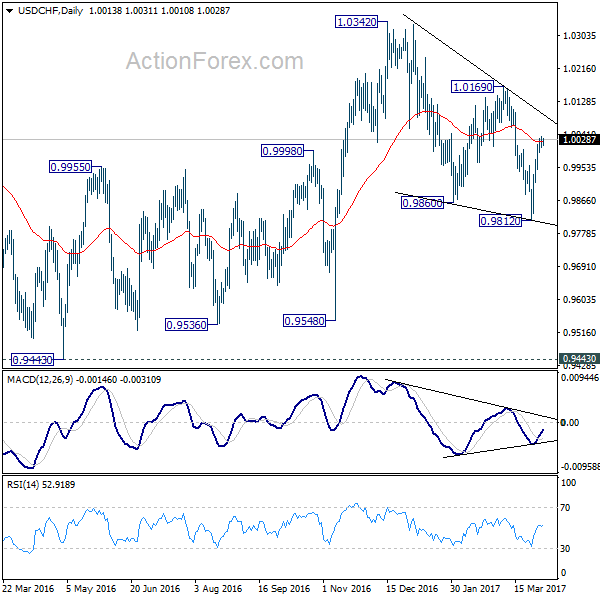
In the bigger picture, USD/CHF is staying in medium term sideway pattern between 0.9443/1.0342. In any case, decisive break of 1.0342 resistance is needed to confirm underlying strength. Otherwise, we'll stay neutral in the pair first. In case of another fall, we'd expect strong support from 0.9443/9548 support zone.
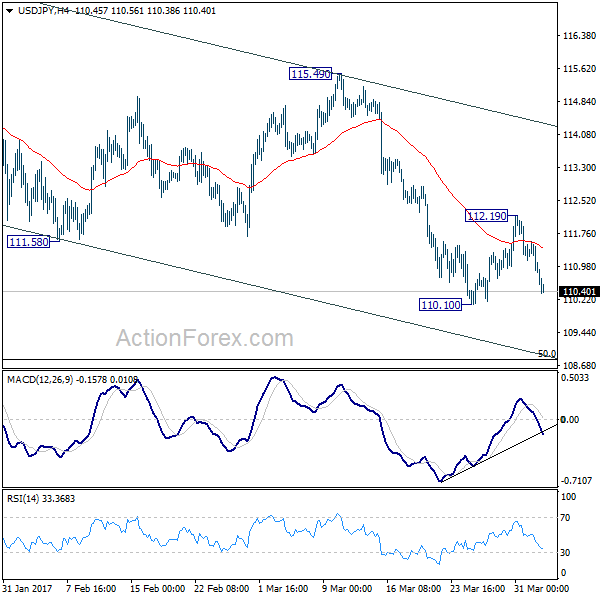
USD/JPY Daily Outlook
Daily Pivots: (S1) 110.64; (P) 111.11; (R1) 111.37; More....
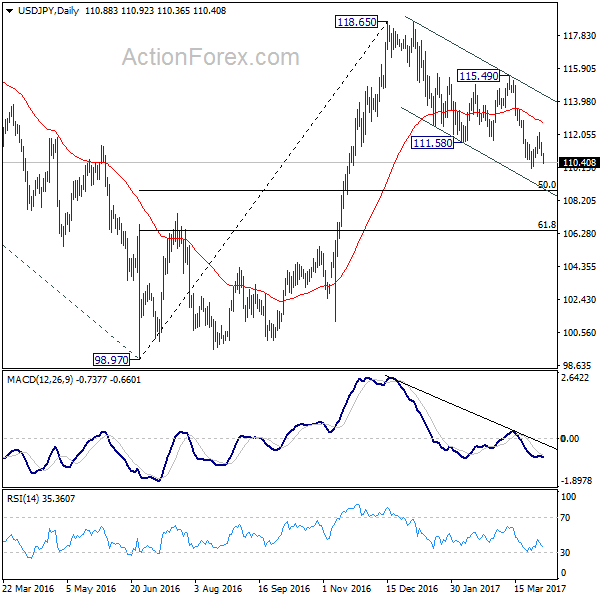
USD/JPY's fall and break of 110.99 minor support suggests that rebound from 110.10 is completed. More importantly, the corrective decline from 118.65 is still in progress. Intraday bias is turned back to the downside. Break of 110.10 will confirm fall resumption and target 50% retracement of 98.97 to 118.65 at 108.81. On the upside, break of 112.19 resistance is needed to confirm near term reversal. Otherwise, outlook will stay mildly bearish in case of recovery.
In the bigger picture, price actions from 125.85 high are seen as a corrective pattern. The impulsive structure of the rise from 98.97 suggests that the correction is completed and larger up trend is resuming. Decisive break of 125.85 will confirm and target 61.8% projection of 75.56 to 125.85 from 98.97 at 130.04 and then 135.20 long term resistance. Nonetheless, sustained trading below 55 week EMA (now at 111.16) will extend the consolidation from 125.85 with another fall through 98.97 before completion.
Daily Technical Analysis: USD/JPY Challenges Support Trend Line At 110
Currency pair USD/JPY
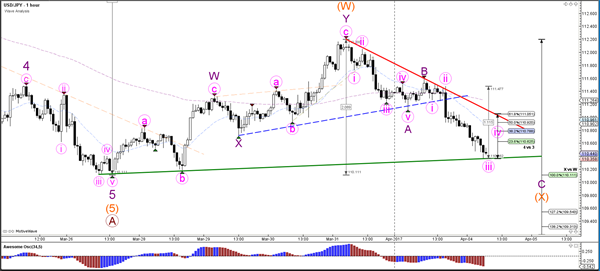
The USD/JPY broke below the support trend line (dotted blue) and is now testing the next support (green). A bounce and break above resistance (red) could indicate that wave X (orange) has been completed whereas a break below the 138.2% Fibonacci level invalidates wave X (orange).
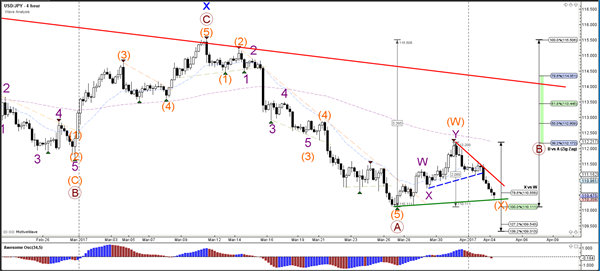
The USD/JPY break above the 61.8% Fibonacci level invalidates wave 4 (pink). A final wave 5 (pink) after a wave 4 (pink) retracement could for instance bounce at the 100% Fib level of wave X vs W (orange) and 110 psychological round level.
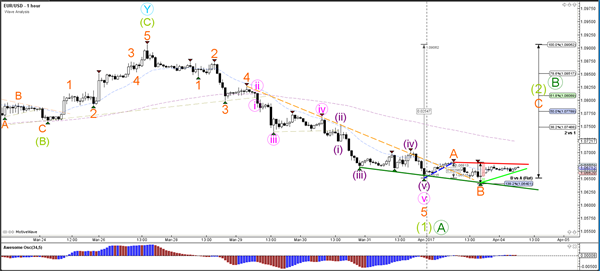
Currency pair EUR/USD
The EUR/USD is struggling to show strong bullish momentum above the resistance trend line (dotted orange). When looking at an hourly chart it seems more likely that a wave 2 or B retracement will occur soon.
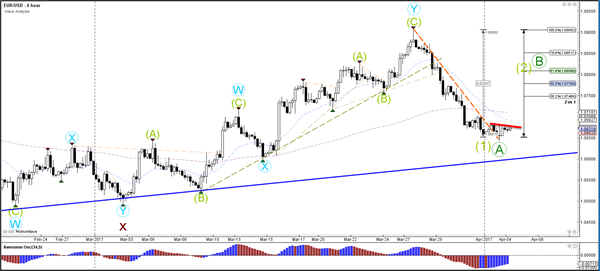
The EUR/USD could still be in a wave ABC (orange) because it did not break below the 138.2% Fibonacci level of wave B vs A. A break below that level indicates a downtrend continuation whereas a break above resistance (red) could spark a wave C (orange).
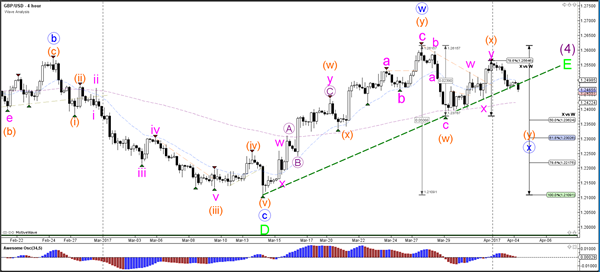
Currency pair GBP/USD
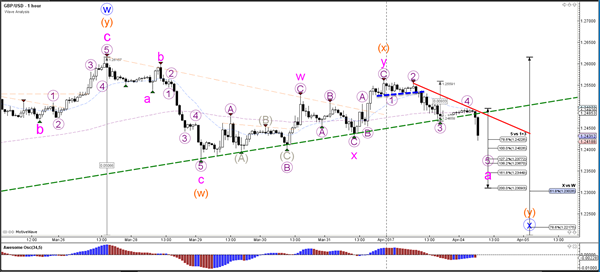
The GBP/USD failed to break above the previous top or 78.6% Fibonacci resistance level and is now breaking below the support trend line (dotted green) which changes the expected wave structure. The failure of the bullish price movement makes it a wave X (orange). Price could now be retracing to the Fibonacci levels of wave X vs W (blue).
The GBP/USD bearish breakout below the support level of the mini triangle (dotted blue) made an ABC (purple) zigzag within wave Y (pink) of wave X (orange) more likely than a 12345. The wave 4 (purple) developed as a bear flag and broke earlier today. A larger ABC zigzag (pink) could occur before completing wave X (blue).
USD/CAD Daily Outlook
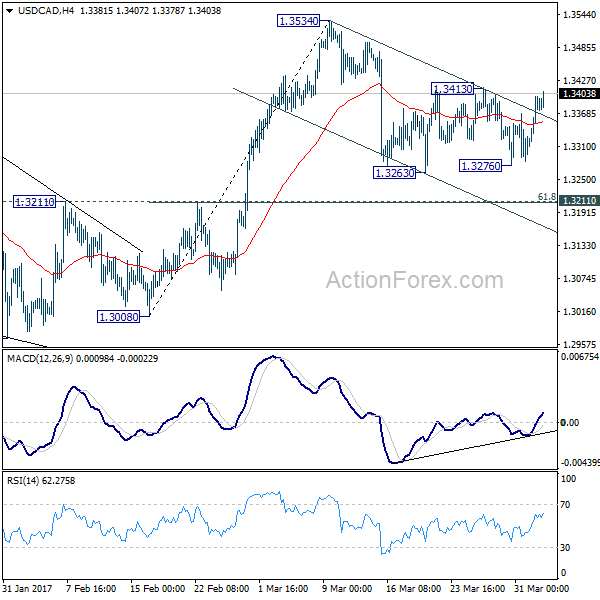
Daily Pivots: (S1) 1.3314; (P) 1.3356; (R1) 1.3425; More....
USD/CAD rebounded strongly after defending 1.3263 support but it's held below 1.3413 resistance so far. Intraday bias remains neutral for the moment. Fall from 1.3534 is seen as a correction, no change in this view. On the upside, break of 1.3413 will argue that such correction is completed and turn bias back to the upside for 1.3534 and above. On the downside, below 1.3263 will bring deeper fall. But we'd expect strong support from 1.3211 cluster level (61.8% retracement of 1.3008 to 1.3534 at 1.3209) to contain downside and bring rebound.
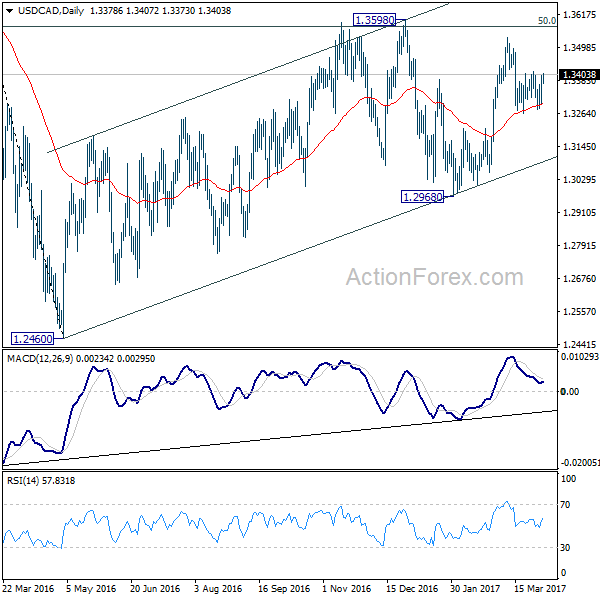
In the bigger picture, price actions from 1.4689 medium term top are seen as a correction pattern. The first leg has completed at 1.2460. The second leg from 1.2460 is likely still in progress and could target 61.8% retracement of 1.4689 to 1.2460 at 1.3838. We'd look for reversal signal there to start the third leg. Break of 1.2968 will argue that the third leg has already started and should at least bring at retest of 1.2460 low. However, sustained trading above 1.3838 would pave the way to retest 1.4689 high.