Sample Category Title
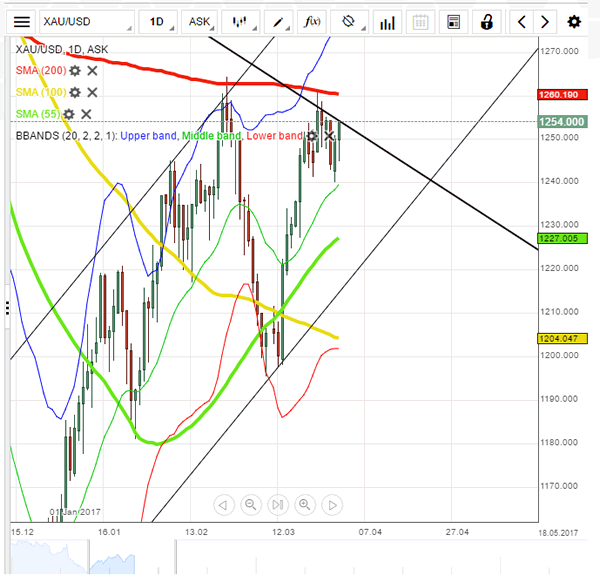
Spot Gold Open Green But Upside Cut Sharp
'Earlier in the day, the statistics bureau reported an expansion in the country's February trade surplus to more than double the previous month's as exports of gold and minerals rebounded, while imports dropped.' – Nichola Saminather (Based on Bloomberg)
Pair's Outlook
Despite the early reading, Gold managed to show a solid 392 green pips on the daily chart, suggesting that bullish momentum prevails, but the resistance cluster at 1,256.77/1,257.69 is most likely to limit upside potential due to the multiple tests that have failed at the area before. We will look for the pair to remain squeezed in between the aforementioned resistance and the 1,249.67/1,248.96 zone. In general it looks like XAU/USD is in the process of establishing a trading range with decent support at 1,242.20.
Traders' Sentiment
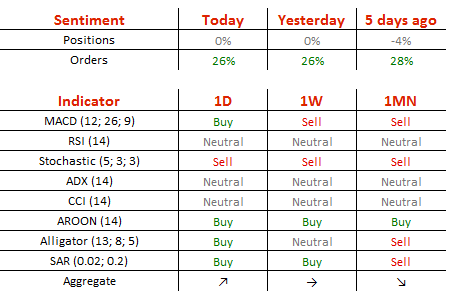
SWFX traders are neutral on the metal, as 50% of open positions are long. However, 63% of trader set up orders are to buy the yellow metal.
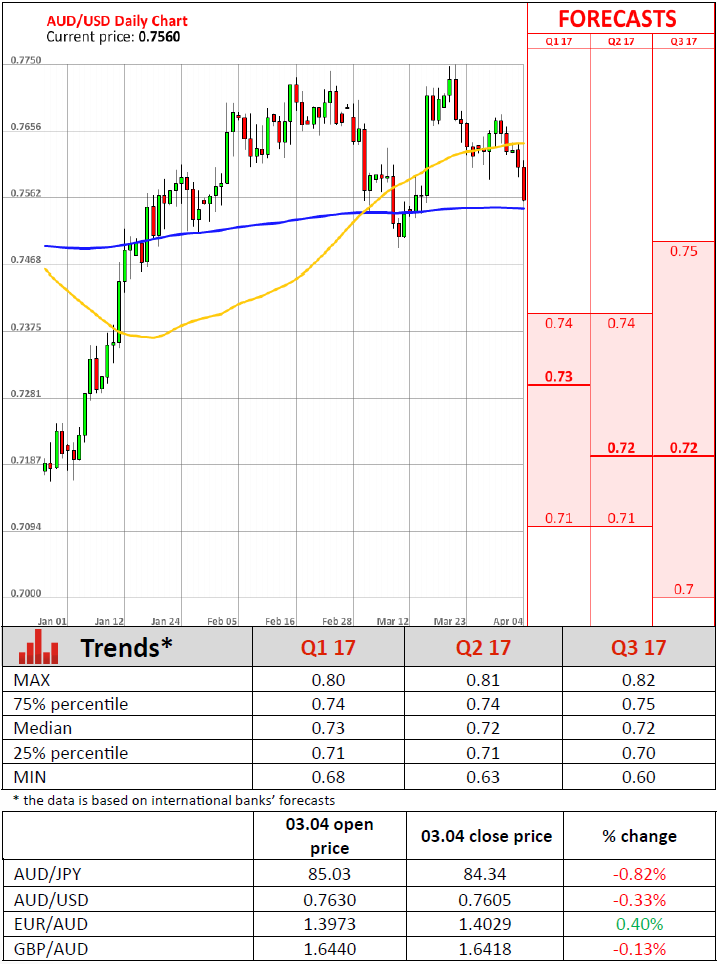
Technical Outlook: AUDUSD – Extended Weakness Pressures 200SMA Support
The Aussie accelerated lower on Tuesday after RBA and took out support at 0.7588 (Fibo 61.8% of 0.7489/0.7747 rally / lows of 28 Mar/03 Apr), completing Failure Swing pattern on daily chart.
Fresh bears are now pressuring strong supports at 0.7548/43 (200SMA / weekly cloud top), break of which would open way towards key short-term support at 0.7489 (09 Mar low).
Daily studies are turning into full bearish setup and support further weakness, after the pair returned into thick daily cloud that underpinned the uptrend since early March.
Oversold near-term studies suggest that bears may show hesitation at 200SMA support.
Bear-cross formed by daily Tenkan-sen / Kijun-sen lines at 0.7616, is expected to cap extended upticks.
Res: 0.7588, 0.7616, 0.7638, 0.7656
Sup: 0.7548, 0.7506, 0.7489, 0.7467
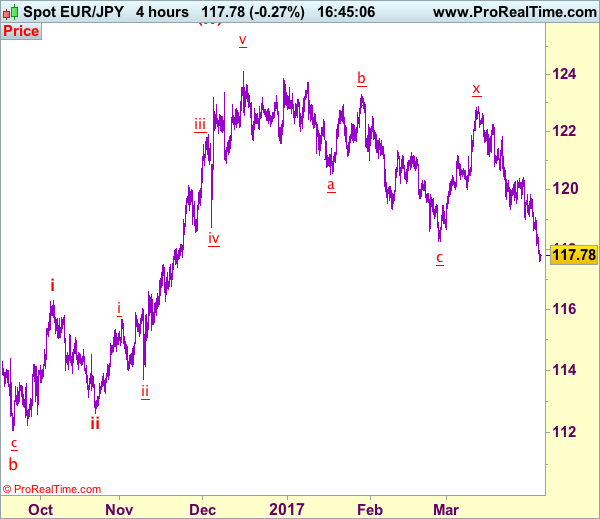
Trade Idea: EUR/JPY – Sell at 118.60
EUR/JPY - 117.82
Recent wave: wave v of (C) ended at 94.12 and major correction in wave A has ended at 149.79
Trend: Near term down
Original strategy:
Sell at 120.40, Target: 118.40, Stop: 121.00
Position: -
Target: -
Stop: -
New strategy :
Sell at 118.60, Target: 116.60, Stop: 119.20
Position: -
Target: -
Stop:-
As euro’s recent selloff has gathered momentum, adding credence to our bearish view that the decline from 124.10 top (2016 high) is still in progress and further weakness to 117.00-10 would be seen, however, near term oversold condition should prevent sharp fall below 116.50-60 and reckon 116.15-20 would hold from here, bring rebound later.
In view of this, would not chase this fall here and would be prudent to sell euro on subsequent rebound as 118.60-70 should limit upside. Above 119.06 resistance would defer and suggest a temporary low is possibly formed, risk rebound to 119.40-50 but price should falter below resistance at 119.85, bring another selloff.
Our latest preferred count is that wave (ii) is ABC-X-ABC which ended at 123.33 and wave (iii) is unfolding with wave iii ended at 100.77, followed by wave iv at 111.57 and wave v as well as the wave (iii) has ended at 97.04, followed by wave (iv) at 111.43 and wave (v) has ended at 94.12 which is also the end of the larger degree v, this also implied the major wave (C) has also ended there, hence major correction has commenced from there with (A) leg unfolding in its lower degree wave c which has possibly ended at 145.69. Under this count, A-B-C wave (B) has commenced with A leg ended at 136.23, wave B at 143.79 and wave C has possibly ended at 149.79.
Our larger degree count is that the decline from 139.26 is wave (C) and is sub-divided into a diagonal triangle i-ii-iii-iv-v with wave i - 105.44, wave ii- 123.33, wave iii - 97.03, wave iv - 111.43, followed by the final wave v as well as the end of wave (C) at 94.12, this also mark the bottom of larger degree wave B. Under this count, major rise in wave C has commenced as an impulsive wave with minor wave III ended at 145.69, wave V is still in progress for further gain to 150.00. Having said that, this so-called wave V could well be the first leg of larger degree 5-waver wave C and this wave C should bring at least a retest of wave A top at 169.97 (July 2008).
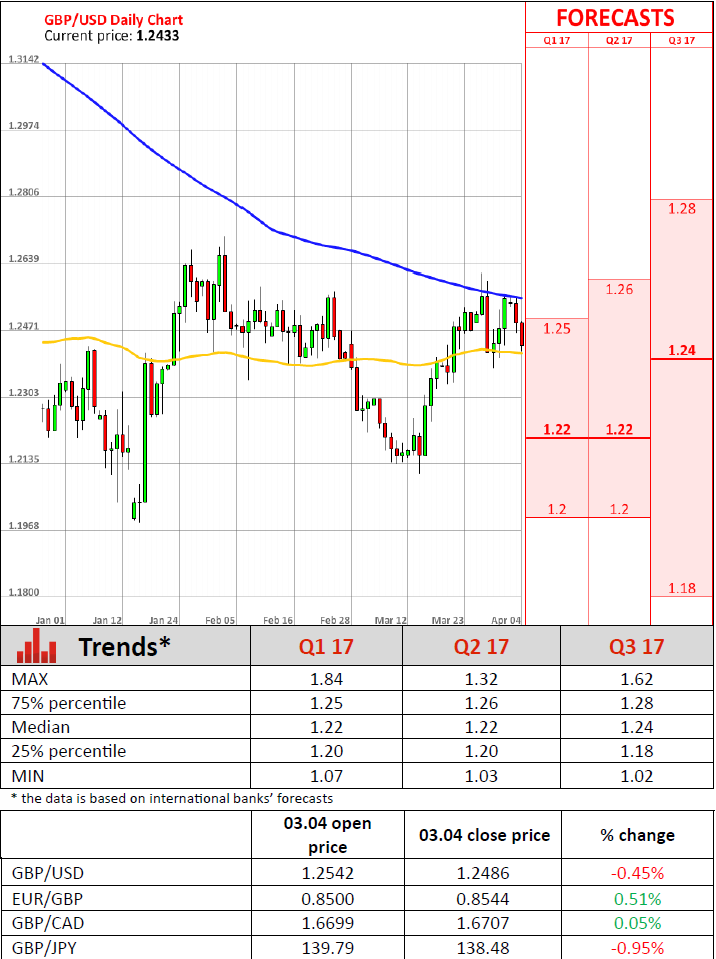
UK PMI Does Not Justify Experts’ Expectations
'High costs and weak wage growth are sapping the strength of consumers, with rates of expansion in output and new orders for these (consumer) products slowing further.' - Rob Dobson, IHS Markit
The Purchasing Manager's Index for the British manufacturing sector dropped slightly in March, contrary to experts' prognoses, who expected a modest increase. According to IHS Markit, the PMI tumbled to a four-month low of 54.2 on a seasonally adjusted basis. Nevertheless, this was still a good result for the manufacturing sector, as the PMI did not fall below the long-term average. One of the key contributors to manufacturing activity growth were exports, which became more competitive on the international market amid the sharp fall in the value of the Pound since the Brexit vote. Even though exports rose at a slower pace, they reflected the greater number of orders, which, in turn, pointed to high oversees demand and strong business confidence. In fact, business optimism in March reached a ten-month high, as 52% of the surveyed companies said they expected to see a surge in production during the next 12 months. Such positive prospect led to an improved hiring and overall employment improvement. However, inflationary pressures became more burdensome and higher raw material prices forced companies to charge higher selling prices. Incidentally, input cost growth in March was one of the fastest observed over the 20-year history of the survey.
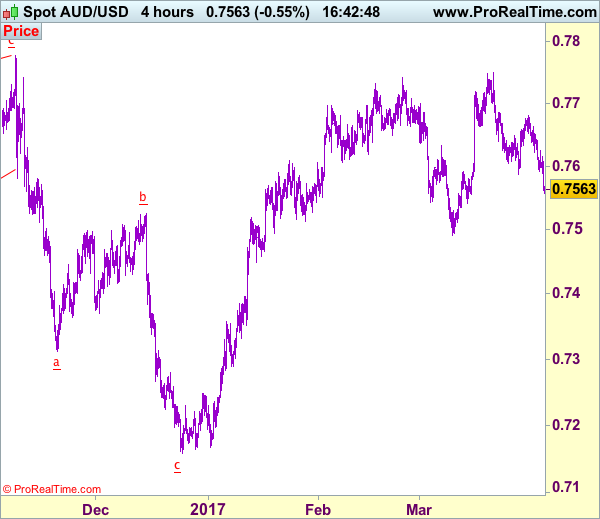
Trade Idea: AUD/USD – Sell at 0.7595
AUD/USD – 0.7562
Recent wave: Wave 5 ended at 1.1081 and major correction has commenced for fall to 0.7000 and then towards 0.6500-10
Trend: Near term up
New strategy :
Sell at 0.7595, Target: 0.7400, Stop: 0.7655
Position: -
Target: -
Stop:-
As aussie has fallen again after breaking support at 0.755, adding credence to our bearish view that the decline from 0.7750 top (last month’s high) is still in progress and may extend further weakness to 0.7530 but a break below indicated support at 0.7491 is needed to retain bearishness and bring further subsequent decline to 0.7450-55 (50% Fibonacci retracement of 0.7158-0.7750), however, near term oversold condition should limit downside to 0.7380-85 (61.8% Fibonacci retracement), risk from there is seen for a rebound later.
In view of this, would not chase this fall here and would be prudent to sell aussie on recovery as 0.7590-00 should limit upside and bring another decline later. Above 0.7625-30 would defer and risk a stronger rebound to 0.7650 but still reckon resistance at 0.7680-85 would limit upside and bring another decline later.
On the 4-hour chart, the move from 0.8066 is the wave 5 with i: 0.8860, ii: 0.8315, wave iii is an extended move ended at 1.0183, iv: 0.9706 and wave v has ended at 1.1081 (also the top of entire wave 5). The subsequent selloff is the major correction which is unfolding as ABC-X-ABC and 2nd A leg has ended at 0.8848, followed by a-b-c wave B which ended at 0.9758, hence, 2nd C wave is now in progress and indicated downside target at 0.7000 and 0.6950 had been met, so further fall to 0.6710-20 cannot be ruled out.
US Manufacturing Activity Slows Last Month
'The post-election resurgence of the manufacturing sector seen late last year is showing signs of losing steam.' - Chris Williamson, IHS Markit
US manufacturing activity rose in line with analysts' expectations last month, a private survey revealed on Monday. The Institute for Supply Management reported its Purchasing Managers' Index for the manufacturing sector came in at 57.2 in March, down from the preceding month's 57.7. However, the figure met market forecasts. Out of the 18 industries, 17 reported growth last month. Data also showed that the sharp oil price rebound contributed most to the manufacturing sector recovery over the past several months. Nevertheless, some manufacturing companies projected activity growth to remain flat in the upcoming months. The New Orders Index came in at 64.5 points, following the February reading of 65.1. However, the gauge if new orders remained at its three-year highs, suggesting that the sector would remain on a solid growth track. Manufacturers also pointed to rising raw material prices, providing further evidence that inflationary pressures continued to build in the US economy. Meanwhile, Markit reported that the group's PMI for the US manufacturing sector dropped to 53.3 last month, the lowest in six months, compared to the prior month's 53.4, whereas analysts anticipated a slight rise to 53.5 points. Furthermore, Markit said that the New Orders Index came in at its slowest pace since October.
RBA Expresses Concerns Over Housing Market
'Although we are experiencing a cooling off period in retail sales, we are confident that the reduction in the company tax rate ... will benefit hundreds of thousands of small and medium-sized businesses, their employees and the broader Australian community.' - Russell Zimmerman, Australian Retailers Association
As markets widely expected, the Reserve Bank of Australia left its key interest rate unchanged at its April monetary policy meeting on Tuesday, expressing concerns over the nation's housing market. Indeed, in some regions house prices more than doubled since the global financial crisis, prompting fears about the property bubble. Policymakers voted to keep the Cash Rate at a record low of 1.50%, claiming that any significant change to interest rates would be a major headwind to the real estate market and would lead to fragile economic growth. The RBA Governor Philip Lowe urged mortgage lenders to limit lending, as surging property prices continued pushing up the household debt to income ratio. Last month, data showed that the Australian unemployment rate climbed to 5.9%, while retail spending dropped 0.1%. These and other leading economic indicators forced the Central bank to remove its 3% economic growth forecast. However, policymakers claimed that the recent data was 'consistent with ongoing moderate growth'. According to market analysts, the RBA will likely remain on hold for the foreseeable future amid subdued inflation growth, soft employment growth, the housing market boom and high degree of uncertainty about the global economy.
Dollar Gains Ahead Of Trump-Xi Meeting
US President Trump and the Chinese president Xi Jinping, are scheduled to meet in Trump's Mar-a-Lago resort in Florida, this Thursday April 6.
There are some sensitive issues between the US and China, such as trade protectionism, currency manipulation, South China Sea claims and North Korea's nuclear program. Trump stated that if China doesn't take actions to rein in the development of nuclear strength in North Korea then the US will act alone. President Xi expressed in mid-March that 'the mutual benefits between the two nations outweighs the conflicts with cooperation as the only right choice for long term development'.
On Monday evening, FOMC voting member Harker stated that 'the Fed is likely to raise rates twice more this year' which is in line with the Fed's 'gradual' rate hike pace. USD strengthened this morning during early European session with the dollar index testing the 100.50 resistance level.
US non-farm payroll and unemployment for March will be released this Friday at 13:30 BST. The US labour market has remained solid, seeing more than 200,000 job gains per month in average over the past six months.
This morning the Reserve Bank of Australia (RBA) announced that rates will remain unchanged at 1.5% in line with expectations. However, the RBA made a dovish statement as the latest unemployment rate rose to a 13-month high. AUD/USD hit a 3-week low of 0.7561 this morning breaking the significant psychological support level at 0.7600.
Economic data for today is thin. UK construction PMI (Mar) to be released at 09:30 BST will likely affect GBP and GBP crosses. The US trade balance is released at 13:30 BST with Fed governor Tarullo making a speech at 21:30 BST.
Bank of Japan Governor Kuroda will make a speech at 08:15 BST on Wednesday April 5. Yen has been one of the best performing currencies over the past few months, as the recent risk events such as Trump's healthcare bill and the triggering of Brexit, has resulted in the rallying of safe havens.
EW Analysis: S&P500 Aiming For 2370
Regarding stocks, I think we have some nice structure on E-mini S&P500; a five wave rise from 2321 on E-mini S&P500 followed by a three wave set-back into our 2346-2351 support zone. So far we can already see some upward reaction so we suspect that price will continue to rise, back above 2370 in sessions ahead.
S&P500, 1H
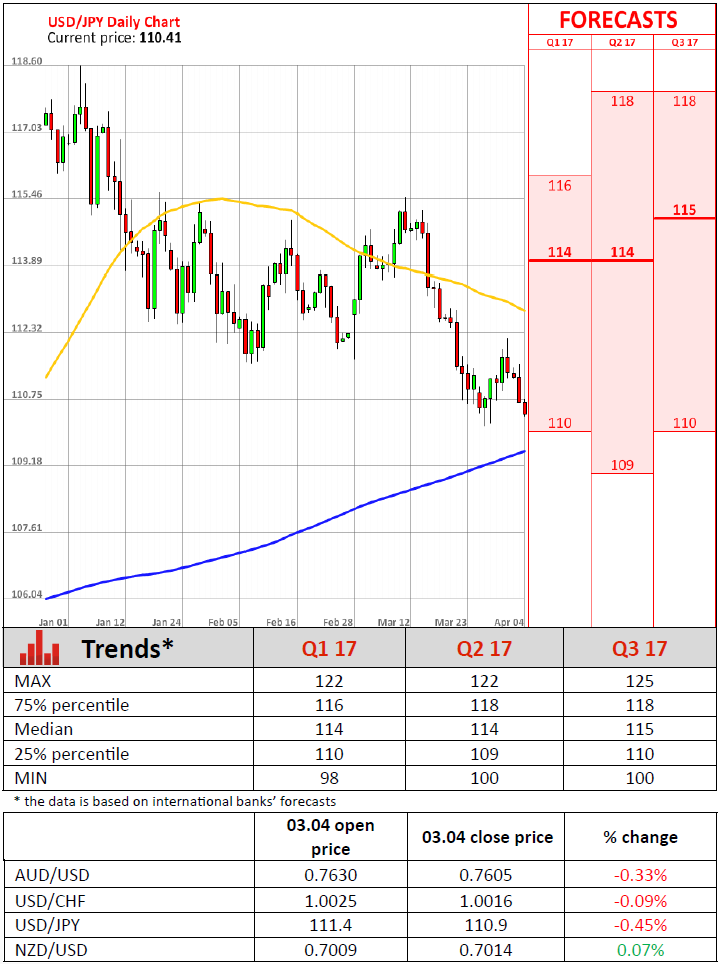
Technical Outlook: USDJPY – Key Support At 110.00 Zone Are Under Increased Pressure
The pair is in red for the third straight day and extends weakness from 112.18 recovery top that so far retraced over 76.4% of 110.09/112.18 recovery leg.
Firm bearish tone has been established on all timeframes and favors renewed attack at recent lows which lay just above psychological 110.00 support and 109.91 (50% retracement of larger 101.17/118.65 rally) to signal fresh extension of bear-phase from 118.65 (15 Dec 2016 / 03 Jan 2017 double-top).
Bears seek for weekly close below 111.36 (weekly cloud top) for confirmation.
Initial resistance lies at 110.90 (session high / broken Fibo 61.8% of 110.09/112.18 upleg), followed by daily Tenkan-sen at 111.14, which should ideally limit recovery attempts.
Res: 110.90, 111.14, 111.36, 111.57
Sup: 110.32, 110.09, 109.91, 109.30