
Sample Category Title
Technical Outlook: GBPUSD – Extended Weakness Pressures 100SMA Support, Near-Term Outlook Is Negative
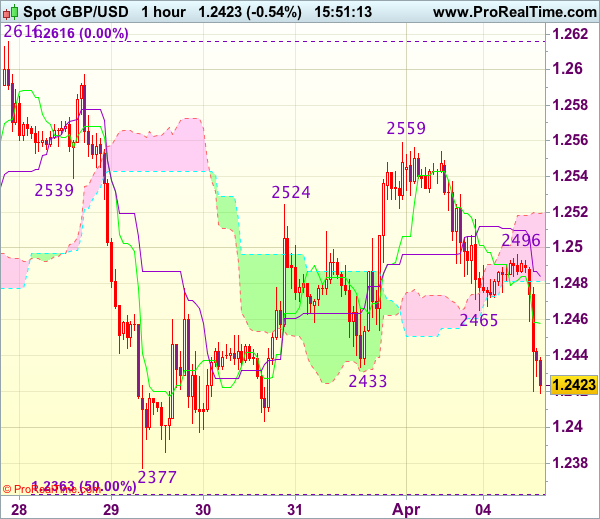
Cable is strongly in red for the second day, after yesterday's close below daily cloud top/Tenkan-sen line generated bearish signal. Fresh acceleration lower in Asia took out support at 1.2443 (Fibo 61.8% of 1.2374/1.2553 upleg) and is currently pressuring 100SMA at 1.2413. Weak near-term studies see risk of further weakness and full retracement of 1.2374/1.2553 upleg, to confirm lower top at 1.2553 and open way for deeper correction of larger 1.2107/1.2613 rally. Political uncertainty maintains pressure on sterling that results in weakening daily chart bulls. Yesterday's low at 1.2463 marks initial resistance ahead of strong barrier at 1.2494 (session high/daily Tenkan-sen/cloud top) and only sustained break here would neutralize downside threats.
Res: 1.2463, 1.2494, 1.2522, 1.2553
Sup: 1.2414, 1.2401, 1.2374, 1.2360
Technical Outlook: EURUSD – Hourly Cloud Caps Consolidation Above Fibo Support At 1.0650
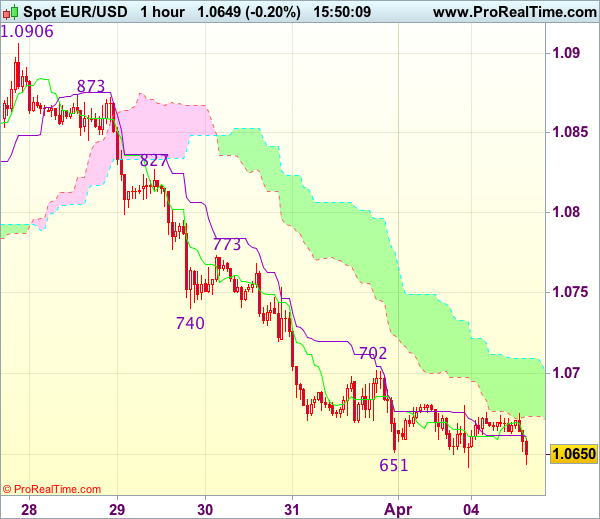
The Euro is trading in extended consolidation above cracked Fibo 61.8% support at 1.0650, but was so far unable to clearly break lower.
The upside remains capped by falling thick hourly cloud (spanned between 1.0670 and 1.0708) which maintains the pressure for final break below 1.0650 and test of next strong supports at 1.0622 (daily cloud top / 100 SMA) and 1.0583 pivot (daily cloud base) in extension.
Prevailing bearish tone favors this scenario, however, strongly oversold slow stochastic on daily chart warns of extended consolidation and possible stronger upticks.
Initial resistance lies at 1.0670 and guards strong barriers at 1.0700/08 (daily Kijun-sen line / hourly cloud top), which is expected to ideally cap extended upticks.
Only close above the latter would delay bears and signal stronger correction of 1.0905/1.0641 downleg.
Res: 1.0670, 1.0700, 1.0708, 1.0745
Sup: 1.0641, 1.0622, 1.0600, 1.0583
GBP/USD Candlesticks and Ichimoku Analysis
Weekly
• Last Candlesticks pattern: Shooting star
• Time of formation: 5 Sep 2016
• Trend bias: Down
Daily
• Last Candlesticks pattern: Long black candlestick
• Time of formation: 24 Jun 2016
• Trend bias: Down
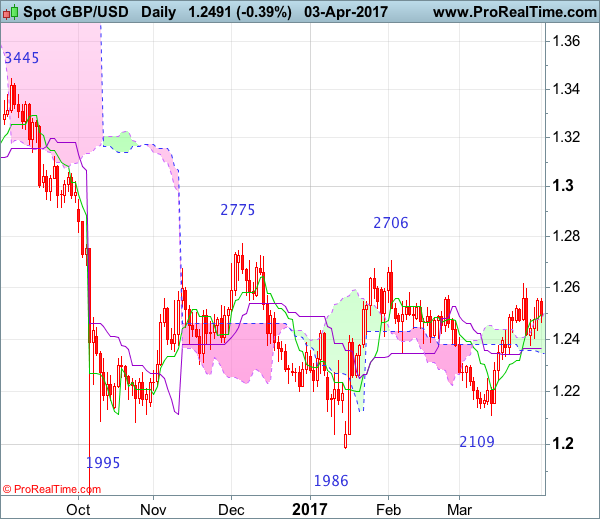
GBP/USD – 1.2478
Although the British pound slipped to as low as 1.2377 last week, the subsequent rebound on cross-trading in sterling suggests consolidation would be seen, however, as cable met resistance at 1.2559 late last week and has retreated again, suggesting weakness to 1.2433 cannot be ruled out but said support at 1.2377 should continue to hold, bring further sideways trading. Only a drop below said support at 1.2377 would signal the retreat from 1.2616 top is still in progress, bring further fall to previous support at 1.2335, once this level is penetrated, this would signal the rise from 1.2109 has ended, then weakness to 1.224050 would follow.
On the upside, whilst recovery to 1.2530-35 cannot be ruled out, reckon said last week’s high at 1.2559 would limit upside and bring further consolidation. Only a daily close above this level would revive bullishness and suggest the retreat from 1.2616 has ended, bring further gain to 1.2595-00, then retest of said resistance, break there would extend the rise from 1.2109 to 1.2650, however, as broad outlook remains consolidative, reckon upside would be limited and price should falter well below indicated previous resistance at 1.2706, bring retreat later. In the event cable is able to penetrate resistance at 1.2706, this would retain bullishness and extend the erratic rise from 1.1986 low towards another previous resistance at 1.2775 first.
Recommendation: Exit long entered at 1.2470 and stand aside for this week.
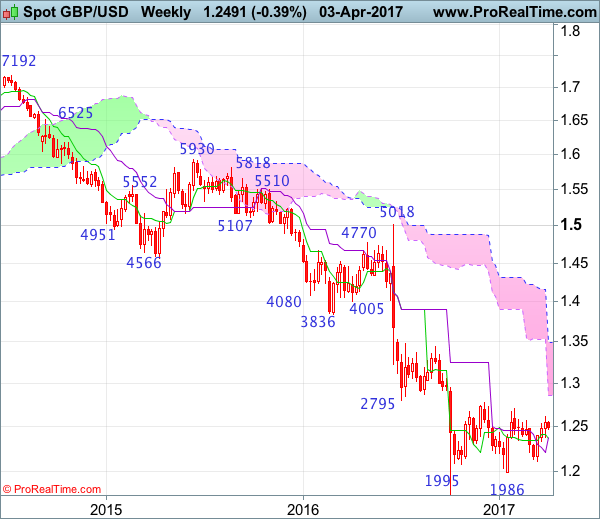
On the weekly chart, although cable recovered after finding support at 1.2377, early retreat from 1.2616 suggests the rebound from 1.2109 has possibly ended there and consolidation with mild downside bias is seen for weakness to 1.2400 and then test of 1.2377, however, a break below 1.2335 is needed to add credence to this view, bring further fall to 1.2240-50, then 1.2200. Looking ahead, a drop below 1.2109 support is needed to retain bearishness and suggest medium term downtrend has resumed for weakness towards recent low at 1.1986.
On the upside, expect recovery to be limited to 1.2530-35 and last week’s high at 1.2559 should hold, bring another decline. Above said resistance at 1.2559 would bring rebound to 1.2616, break there would revive previous near term bullish view that another leg of corrective rise from 1.1986 low take place and extend gain to 1.2706 resistance but break there is needed to provide confirmation, bring retracement of early downtrend for test of previous resistance at 1.2775 and later 1.2850-60 but price should falter well below psychological resistance at 1.3000.
Currencies: Dollar Shows No Clear Trend, But USD/JPY Nears Key Support
Sunrise Market Commentary
Rates: US 10-yr yield closing in on 2.3% support
Today's eco calendar won't inspire trading, suggesting sentiment-driven action. If yesterday's risk aversion persists, the US 10-yr yield could eventually test key 2.3% support, the lower bound of the 2.3%/2.64% trading range. We don't anticipate a move lower given the Fed's intention to normalize policy (rate hikes and run-off Fed's balance sheet).
Currencies: Dollar shows no clear trend, but USD/JPY nears key support
The dollar stabilized against the euro yesterday, but the decline in US yields weighed on USD/JPY. The pair nears the key 110 support area. Will the US currency lose further interest rate support. Today's data probably won't be decisive yet. The recent short squeeze of sterling shows tentative signs for running into resistance.
The Sunrise Headlines
- US equities eventually closed between flat (Dow) and -0.30% (Nasdaq) after reversing part of the initial losses. Overnight, Asian stock markets lose ground as well with Japan underperforming and China & India closed.
- Car sales unexpectedly slid in March, heightening concerns about bloated dealer stocks and pricing pressure in an industry that has been central to US economic growth. It delivers a sluggish start to the spring selling season.
- South Africa's credit rating was downgraded to junk status for the first time in almost two decades amid an accelerating drumbeat of calls for President Jacob Zuma to step down. USD/ZAR moved north of 13.75
- Australia kept interest rates unchanged at 1.5%, remaining in a form of policy paralysis as housing is too hot to allow an easing and the economy lacks the strength to absorb a tightening.
- The Fed could begin shrinking its portfolio of bonds as soon as this year, Philly Fed Harker said, adding his voice to a growing number of colleagues warning they could promptly wind down a crisis-era policy.
- The ECB estimates that Banca Popolare di Vicenza and Veneto Banca need about €6.4B to bolster their balance sheets, and considers the two struggling Italian lenders to be solvent, according to people familiar with the matter.
- Today's eco calendar only contains US trade balance and EMU retail sales. The Austrian debt agency sells bonds. ECB Draghi and Fed Tarullo are scheduled to speak, but the ECB chairman presents the new €50 euro note.
Currencies: Dollar Shows No Clear Trend, But USD/JPY Nears Key Support
Decline in US yields weighs on the US dollar
On Monday, trading in the major dollar cross rates started the new quarter on a slow footing. EUR/USD retested last week's lows, but no break occurred. The US manufacturing ISM was OK, but didn't help the US currency. On the contrary, US bond yields declined during the US session, pressuring the dollar. Especially USD/JPY was hurt. A decline in equities and oil was also a USD negative. The pair closed the session at 110.90 (from 111.39). EUR/USD finished the session at 1.0670 (1.0652 on Friday).
Overnight,several Asian markets are closed. The cautious risk-off start to the quarter in the US and the rise of the yen are causing 1%+ losses for Japanese equities. The yen extends yesterday's rebound. USD/JPY drops to the mid 110 area. EUR/USD shows no clear trend. Euro weakness and USD softness are keeping each other in balance. EUR/USD hovers in the 1.0665/70 area. The Reserve bank of Australia kept its policy rate unchanged at 1.5%. It warns on growth in household borrowing. At the same time, the Bank indicates that wage growth and inflation remain low. It applauds the Aussie decline since 2013. A rise could complicate the economic adjustment. AUD/USD dropped from 0.76+ area to the 0.7575.
Today, the volatile EMU retail sales are expected to rise 0.5% M/M and 1% Y/Y, but the report is most often ignored. In the US, the February trade balance and the factory orders are up for release. The trade deficit is expected to have declined to $44.5B from 48.5B. Technical factors might be in play. We don't expect a big reaction. The factory orders include the more volatile durable orders that have already been published. Regarding central bankers, speeches from Draghi and Tarullo won't be important
Last week, the US reflation trade regained traction and supported a comeback of the dollar. Fed speakers also confirmed that further policy normalization is to be expected throughout 2017. At the same time, the euro faced headwinds as rumours questioned the case for early ECB policy normalization. The move was reinforced by very soft EMU inflation data. However, the price action at the end of last week and yesterday suggests that the rise of the dollar as no strong legs. US yields also remain on a downward trajectory .
Of late, we advocated that the dollar needs very strong data to gain more ST term. This assessment remains valid and especially applies to USD/JPY. The pair struggles not to fall to/below the recent lows in the 110 area. The red alert is again on! We keep a close eye on US yields nearing key support levels. For EUR/USD, the repositioning away from early ECB normalization s has been worked out. We maintain a cautious EUR/USD negative bias, but the decline might slow. We don't see a case for big EUR/USD gains if sentiment on risk would stay risk-off. From a technical point of view, USD/JPY temporary regained the 111.36/60 previous range bottom, but it couldn't be sustained. A decline below 110 would signal more trouble ahead. EUR/USD extensively tested the topside of the MT range, but the test was rejected last week. The 1.0874/1.0906 area now looks a solid resistance. EUR/USD might return lower in the previous 1.0875/1.05 trading range.
EUR/USD: correction slows as USD rebound is running out of steam
EUR/GBP
Sterling short squeeze is slowing
Yesterday, sterling drifted of off Friday's correction top against the euro and the dollar after a solid performance last week. The UK manufacturing PMI declined from 54.5 to 54.2. The report didn't change the UK eco picture, but helped to block the recent short-covering rally of sterling. EUR/GBP rebounded to the mid 0.85 area and closed the session at 0.8545. Cable drifted back to the 1.25 area even as the dollar wasn't in really good shape. The pair closed the session at 1.2486. Yesterday's price action is a first indication that the sterling short-squeeze ran its course.
Today, the eco calendar only contains the UK construction PMI. A stabilisation at 52.5 is expected. This morning, the sterling remains in the defensive. Both cable and GBP/EUR are ceding ground. Is uncertainty on Brexit again becoming a factor of importance for GBP trading? Mid-March, sterling found a better bid. Substantially higher than expected UK inflation and a more hawkish tone from the BoE supported sterling. We changed our short-term bias on EUR/GBP from positive to neutral. Last week's decline of the euro reinforced the EUR/GBP downside momentum. Further consolidation in the MT sideways range might be on the cards. The decline below the 0.8592 previous break-up suggests that a full retracement to the 0.8402 range bottom is possible. However, the pair shows tentative signs of a ST bottoming out process. Longer term, Brexitcomplications remain a potential negative for sterling. We are not convinced that the BoE will raise rates anytime soon, even not after recent higher inflation data
EUR/GBP: sterling short-squeeze shows tentative signs of easing
USD/CHF Candlesticks and Ichimoku Analysis
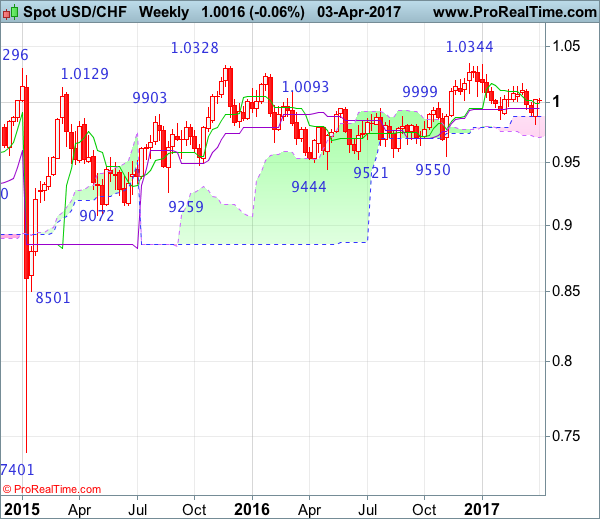
Weekly
• Last Candlesticks pattern: Doji
• Time of formation: 26 Sep 2016
• Trend bias: Sideways
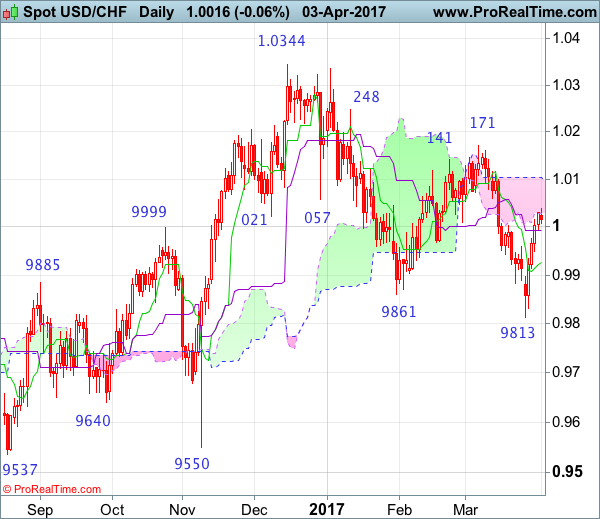
Daily
• Last Candlesticks pattern: Shooting star
• Time of formation: 25 Oct 2016
• Trend bias: Near term up
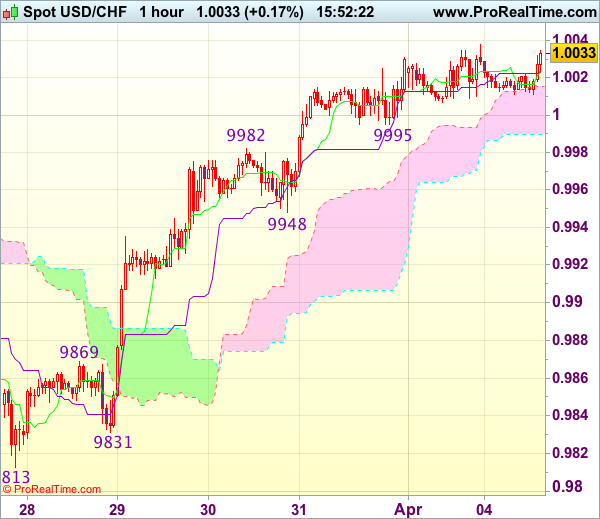
USD/CHF – 0.9861
Although the greenback opened lower initially last week and fell to as low as 0.9813, as dollar found decent demand there and staged a much stronger-than-expected rebound, suggesting recent erratic decline from 1.0344 top has possibly ended there and consolidation with mild upside bias is seen for further gain towards the upper Kumo (now at 1.0103), however, a daily close above resistance at 1.0171 is needed to add credence to this view and encourage for subsequent rise to 1.0200-10, otherwise, further choppy trading is in store.
On the downside, whilst pullback to the Kijun-Sen (now at 0.9992) cannot be ruled out, reckon downside would be limited to 0.9950-60 and the Tenkan-Sen (now at 0.9926) should hold, bring another rebound later. Below 0.9840-50 would risk retest of said support at 0.9813 but only break there would revive bearishness and signal the decline from 1.0344 top is still in progress for further fall to 0.9735-40 (76.4% retracement of 0.9550-1.0344) and later towards 0.9700 but oversold condition should limit downside to 0.9650-60, bring rebound later.
Recommendation: Buy at 0.9950 for 1.0150 with stop below 0.9850.
On the weekly chart, although the greenback fell briefly below previous support at 0.9861, lack of follow through selling and the subsequent strong rebound from 0.9813 formed a long white candlestick with a long lower shadow, suggesting low is possibly formed there and consolidation with mild upside bias is seen for further gain to 1.0060 and then 1.0085-90, however, break of resistance at 1.0171 is needed to signal the fall from 1.0344 top has ended at 0.9813, bring further subsequent rise towards key resistance at 1.0248. A sustained breach above this level would signal early upmove has possibly resumed, bring test of 1.0335-44 resistance area, above there would provide confirmation and headway to 1.0400-10 and later 1.0500 would follow.
On the downside, expect pullback to be limited to the Kijun-Sen (now at 0.9947) and bring another rebound. Only below said support at 0.9813 would abort and signal the erratic fall from 1.0344 top is still in progress, bring further decline for retracement of early upmove to 0.9735-40, then towards the lower Kumo (now at 0.9706) but reckon downside would be limited to 0.9640-50 and price should stay well above support at 0.9550.
Trade Idea : USD/CHF – Buy at 0.9950
USD/CHF - 1.0025
Most recent candlesticks pattern : N/A
Trend : Near term up
Tenkan-Sen level : 1.0023
Kijun-Sen level : 1.0024
Ichimoku cloud top : 1.0015
Ichimoku cloud bottom : 0.9990
Original strategy :
Buy at 0.9950, Target: 1.0050, Stop: 0.9915
Position : -
Target : -
Stop : -
New strategy :
Buy at 0.9950, Target: 1.0050, Stop: 0.9915
Position : -
Target : -
Stop : -
As the greenback has maintained a firm undertone after last week’s rally above 1.0003 resistance, suggesting recent rise from last week’s low at 0.9813 is still in progress and bullishness remains for this move to extend gain to previous support at 1.0060 (now resistance), however, loss of upward momentum should prevent sharp move beyond resistance at 1.0109, risk from there has increased for a retreat to take place later.
In view of this, would not chase this rise here and would be prudent to buy dollar on pullback as said support at 0.9948 should limit downside. Below 0.9931 (50% Fibonacci retracement of 0.9831-1.0031) would abort and signal top is formed instead, bring correction to 0.9905-10 (61.8% Fibonacci retracement) but reckon previous resistance at 0.9869 would hold from here.
Trade Idea : GBP/USD – Sell at 1.2465
GBP/USD - 1.2432
Most recent candlesticks pattern : N/A
Trend : Near term down
Tenkan-Sen level : 1.2458
Kijun-Sen level : 1.2478
Ichimoku cloud top : 1.2520
Ichimoku cloud bottom : 1.2481
New strategy :
Sell at 1.2465, Target: 1.2365, Stop: 1.2500
Position : -
Target : -
Stop : -
As cable has dropped again after meeting renewed selling interest at 1.2496 earlier today and broke below indicated support at 1.2433, adding credence to our view that the rebound from 1.2377 has ended at 1.2559, hence further weakness to 1.2400-05 and later towards support at 1.2377 would be seen. Looking ahead, only a drop below 1.2377 would confirm the fall from 1.2616 is still in progress for subsequent decline towards key support at 1.2335.
In view of this, would not chase this fall here and would be prudent to sell cable on recovery as 1.2465 (previous support turned resistance) should limit upside. Only break of said resistance at 1.2496 would abort and suggest an intra-day low is formed instead, risk a stronger rebound to 1.2525-30.
Trade Idea : EUR/USD – Sell at 1.0730
EUR/USD - 1.0654
Most recent candlesticks pattern : N/A
Trend : Near term down
Tenkan-Sen level : 1.0660
Kijun-Sen level : 1.0661
Ichimoku cloud top : 1.0710
Ichimoku cloud bottom : 1.0673
Original strategy :
Sell at 1.0740, Target: 1.0625, Stop: 1.0775
Position : -
Target : -
Stop : -
New strategy :
Sell at 1.0730, Target: 1.0610, Stop: 1.0765
Position : -
Target : -
Stop : -
As the single currency has remained under pressure after falling to 1.0642 yesterday, adding credence to our bearish view that the decline from 1.0906 top is still in progress and bearishness remains for this fall to extend further weakness to 1.0620-25, then test of previous chart support at 1.0600, however, a sustained breach below the latter level is needed to retain downside bias for subsequent selloff to 1.0570-75 first, otherwise, risk from there is seen for a rebound later.
In view of this, would not chase this fall here and would be prudent to sell dollar on recovery as 1.0730-40 should limit upside. Only a firm break above resistance at 1.0773 would suggest low is formed instead, bring a stronger rebound to 1.0800 but resistance at 1.0827 should remain intact.
Trade Idea : USD/JPY – Sell at 110.95
USD/JPY - 110.51
Most recent candlesticks pattern : N/A
Trend : Near term down
Tenkan-Sen level : 110.61
Kijun-Sen level : 110.97
Ichimoku cloud top : 111.57
Ichimoku cloud bottom : 111.46
New strategy :
Sell at 110.95, Target: 109.95, Stop: 111.30
Position : -
Target : -
Stop : -
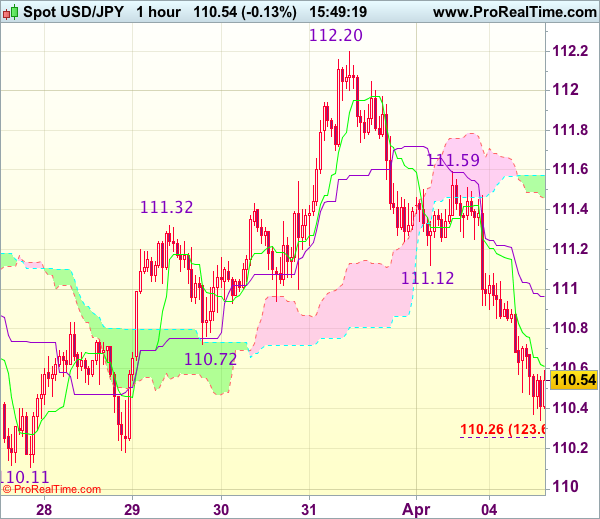
As the greenback has dropped again after meeting renewed selling interest at 111.59 yesterday, adding credence to our view that top ha been formed at 112.20 and bearishness remains for the selloff from there to extend weakness to 110.11 support, however, break there is needed to retain downside bias and confirm medium term decline has resumed for further subsequent fall to 109.80-85 (1.618 times projection of 112.20-111.12 measuring from 111.59) which is likely to hold on first testing.
In view of this, would not chase this fall here and would be prudent to sell dollar on recovery as 110.90-95 should limit upside. Above previous support at 111.12 (now resistance) would defer but only break of resistance at 111.59 would abort and signal the fall from 112.20 has ended instead.
Flight-To-Safety Sends Safe Havens To Monthly Highs
The robust growth in manufacturing data across Europe, Asia, and the U.S. was not enough to refuel the reflation trade. Asian equities declined early Tuesday, sovereign bonds pushed higher, the USDJPY fell below 110.5, and gold prices approached 2017 highs.
The price action in different asset classes indicates that investors are favoring the safe havens ahead of a potentially tensed Trump-Xi summit. The U.S. Treasury yields reflect markets nervousness to a large extent because in this rising rates environment where economic conditions are improving, it doesn't make a lot of sense to see U.S. 10-year yields dropping back towards 2.32%, an 11.6% decline from March highs. If the drop in yields is not temporary, it would spark a market correction, so traders should keep a close eye on U.S. sovereign debt.
Crude oil prices are not supporting appetite to risk either. The continued increase in U.S. rig counts and the rebound in Libyan output kept prices under pressure. "Oversupply", the most offensive term for OPEC, doesn't seem to have faded yet, which requires OPEC and non-OPEC producers to take extending production cuts into serious consideration, otherwise balancing the markets will take much longer than previously anticipated.
The Reserve Bank of Australia kept its cash rate at 1.5% for the eighth consecutive month, a widelyexpected decision. But the AUDUSD declined by 30 pips, as the RBA highlighted that a soft labor data remains an area of concern and an appreciating Aussie would complicate the economy's transition away from mining. The Central Bank also warned on risky lending to house buyers which drove prices in the main cities to double-digit gains, suggesting that regulators will take the proper measures to curb risky mortgage lending to cool down escalating home prices.
In other currency news, the South African rand resumed its fall after S&P cut the country's rating into junk. ZAR fell 1.7% early Tuesday after dropping 2% on Monday. The elevated political risks after firing the finance minister will continue to be reflected in the country's currency. From a fundamental perspective, the rand looks undervalued, but how much lower it might drop in the short run depends on the political developments. A 5-10% fall from current levels is very likely.