

Sample Category Title
GOLD (XAUUSD) Elliott Wave: Forecasting the Path
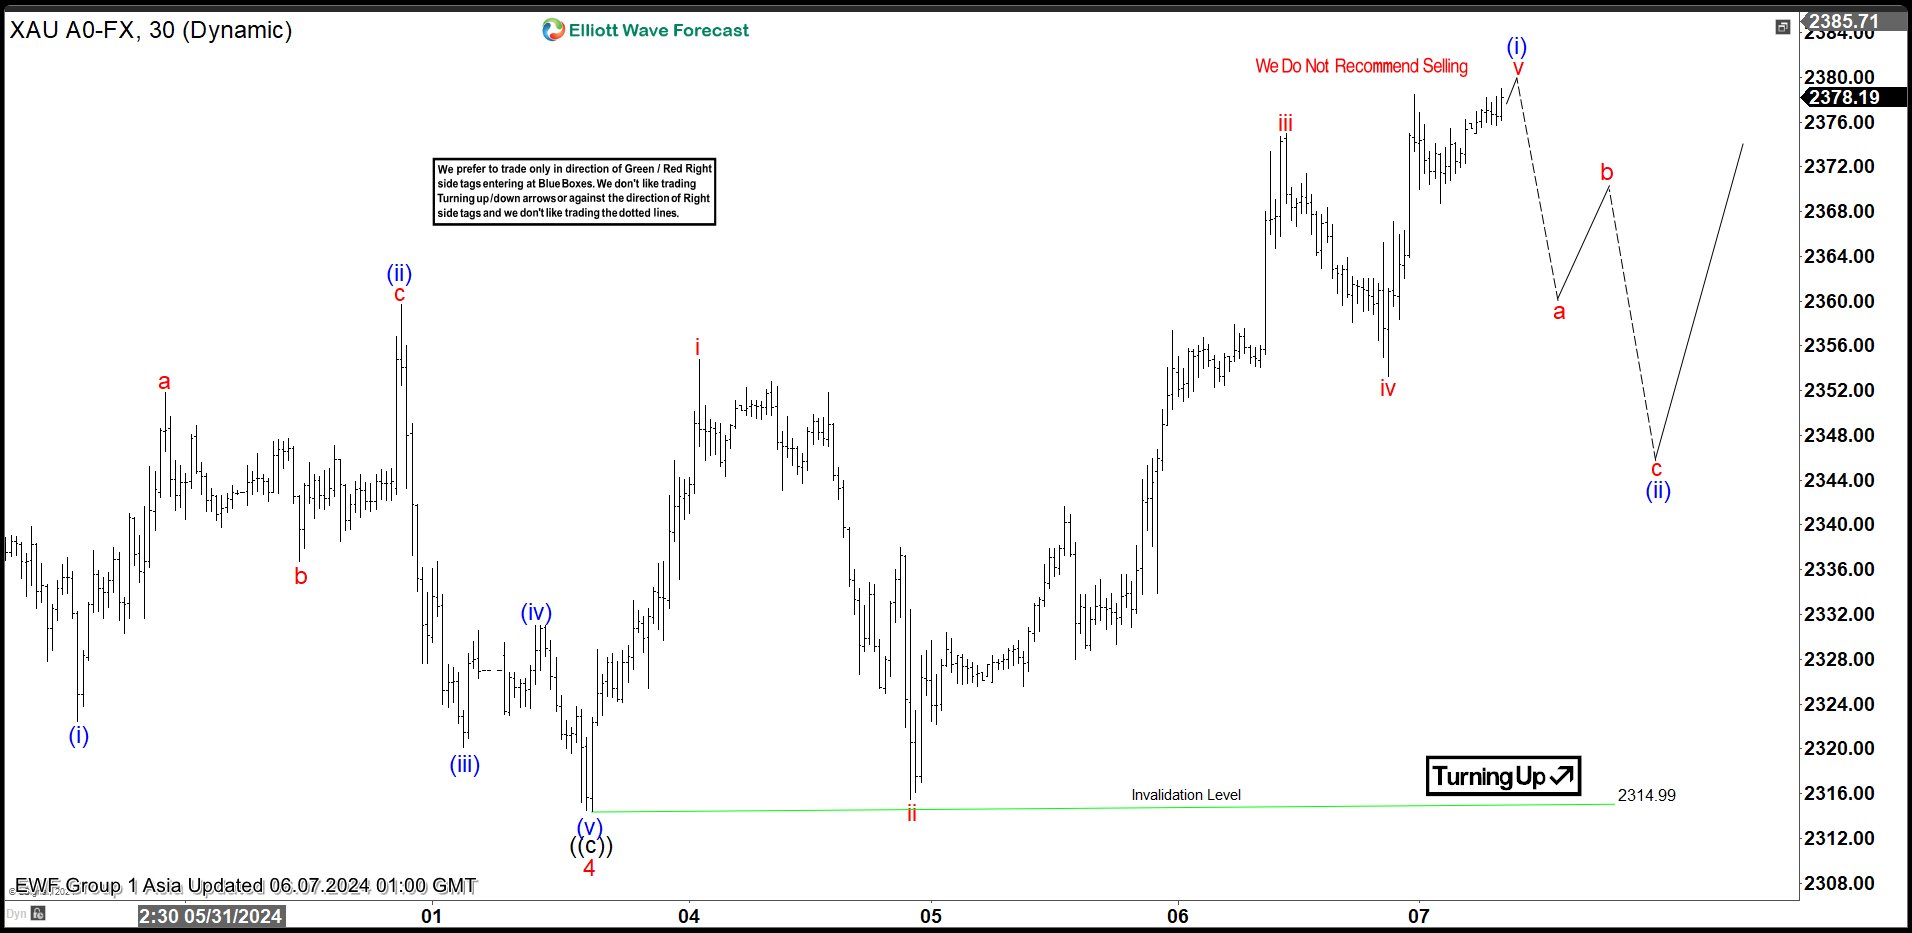
Hello fellow traders. In this technical article we’re going to take a quick look at the Elliott Wave charts of GOLD (XAUUSD) , published in members area of the website. As our members know, GOLD ended cycle from the 2314.99 low as 5 waves structure. The commodity is now giving us pull back against the 2314.99 low. Let’s break down our Elliott Wave forecast further in this article.
GOLD H1 Asia Update 06.07.2024
The current view suggests that GOLD is about to complete cycle from the 2314.99 low. We can count 5 waves pattern labeled as i,ii,iii,iv,v red. There is already enough number of swings in place, so pull back can start any moment.
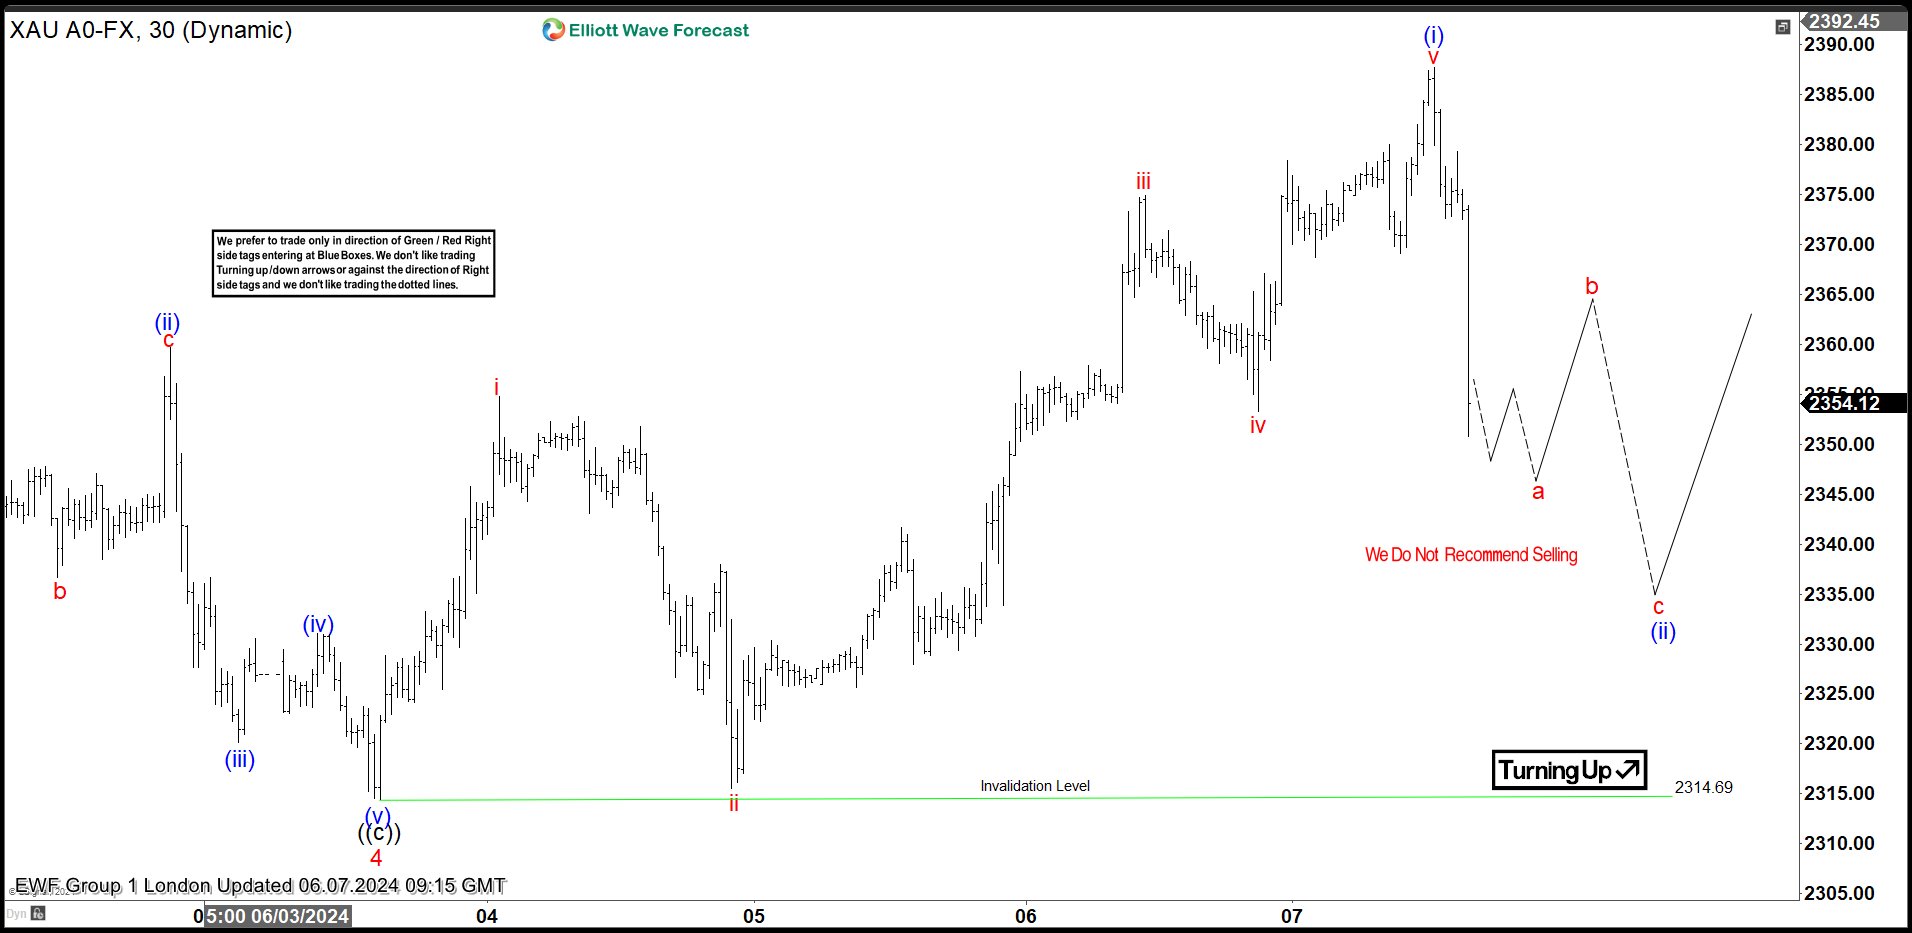
GOLD H1 London Update 06.07.2024
GOLD completed cycle from the 2314.9 low as expected and currently giving us wave (ii) blue correction. We got very sharp decline from the peak, which indicates we are doing impulsive move which can be first leg a red of a potential Elliott Wave Zig Zag Pattern.
Crypto Market Quiet
Market picture
The crypto market capitalisation remained almost unchanged overnight at $2.63 trillion, showing a sharp decline in volatility. Bitcoin settled near the $71K level (+0.2%), while Ethereum settled near $3800 (-0.9 %). Prices of top altcoins changed between -1.2 % (Avalanche) and +2.7% (Toncoin).
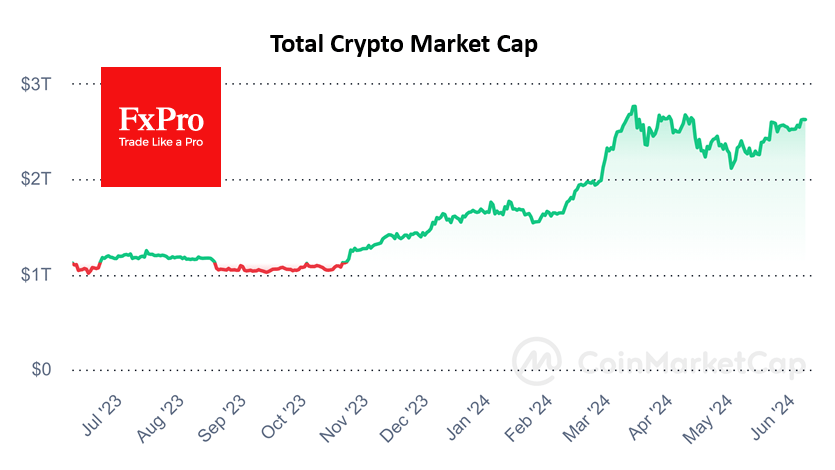
The lull in the crypto market is probably due to expectations of important macroeconomic data from the US and the Fed’s reaction to them. An important test is Friday’s labour market statistics, with the FOMC rate decision and inflation to follow next week.
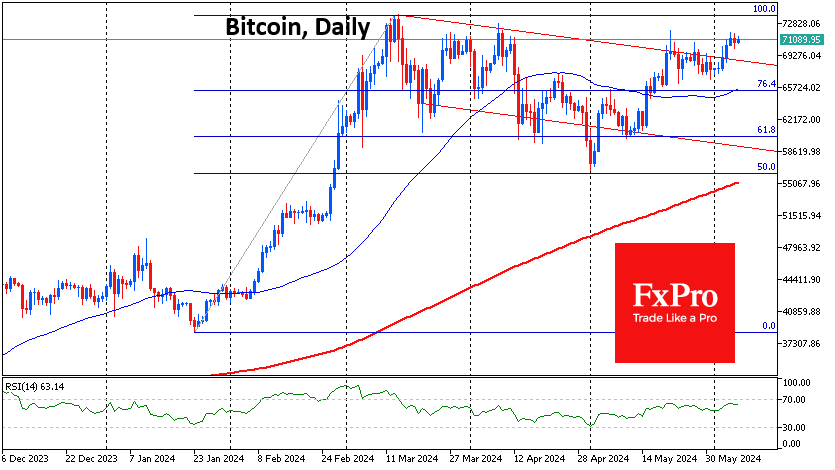
Technically, Bitcoin remains at an important resistance area, a break of which could trigger a FOMO rally with a quick update of historical highs. A reversal down from this area would send BTCUSD towards $60K.
News background
The options market has bet on Bitcoin rising above $74,000 by the end of June, suggesting increased expectations of a “decisive breakout” of the all-time high, QCP Capital believes.
MN Trading founder Michael van de Poppe notes that Bitcoin’s chart is showing upward momentum. He believes altcoins are also poised for growth, and the big momentum will be seen from late June to September-October.
Bitcoin will rise to $100,000 by November, ahead of the US election, with a new all-time high it could hit as early as this weekend, Standard Chartered expects. The bank confirmed a target for BTC to rise to $150,000 by the end of the year and to $200,000 by the end of 2025.
Processing applications to launch spot Ethereum-ETFs will take “some time,” SEC head Gary Gensler said. He emphasised that crypto firms are engaging in activities that laws do not allow traditional exchanges to conduct.
VanEck raised its forecast for Ethereum to $22,000 by 2030. The company called Ethereum a “successful digital economy” that attracts around 20 million active users per month while generating $5.5 trillion worth of stablecoin transfers in the last twelve months.
Paxos introduced the Lift Dollar (USDL) stablecoin, which entitles holders to a ~5% annualised ‘risk-free’ yield. The first market for USDL will be Argentina, known for its permanently weakened currency and high inflation.
Crypto exchange Bybit appears to have started services in mainland China, which is on the list of excluded jurisdictions for the platform, suggested crypto journalist Colin Wu.
Payment system Mastercard has reinstated agreements with Binance regarding payments and deposits after resolving issues with US regulators. The partnership broke down in September 2023 under the onslaught of US regulators.
Market Awaits NFP Data: Euro/Dollar Consolidates
At the end of the week, the US dollar is hovering around an eight-week low against the euro, but trading activity remains subdued. Everyone is conserving energy ahead of this evening's May employment data from the US. These reports are expected to provide more insight into the timing of the Federal Reserve's monetary policy easing.
Yesterday, the European Central Bank lowered its interest rate by 25 basis points, from 4.50% to 4.25% per annum. The euro retained its daily gains. The ECB gave few indications about its future steps, and the market remains uncertain whether there will be further rate cuts. Persistent inflationary pressures dim the prospects for the ECB.
In its comments, the ECB mentioned that the consumer price index will remain above the target of 2% until the end of next year.
The market is preparing for relatively soft non-farm payroll (NFP) data from the US. The final figure may fall below the forecast of 185,000.
Investor expectations regarding the Federal Reserve's decisions are constantly shifting. The market now predicts the first rate cut in September, followed by another in November.
EUR/USD Technical Analysis
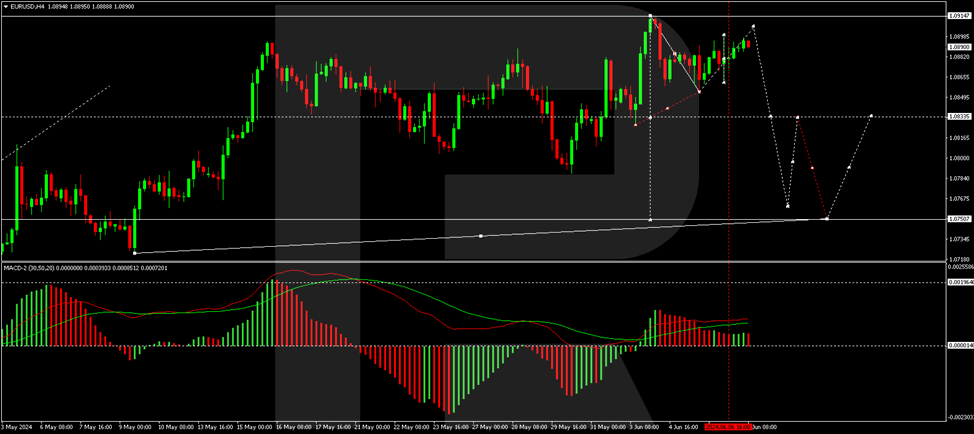
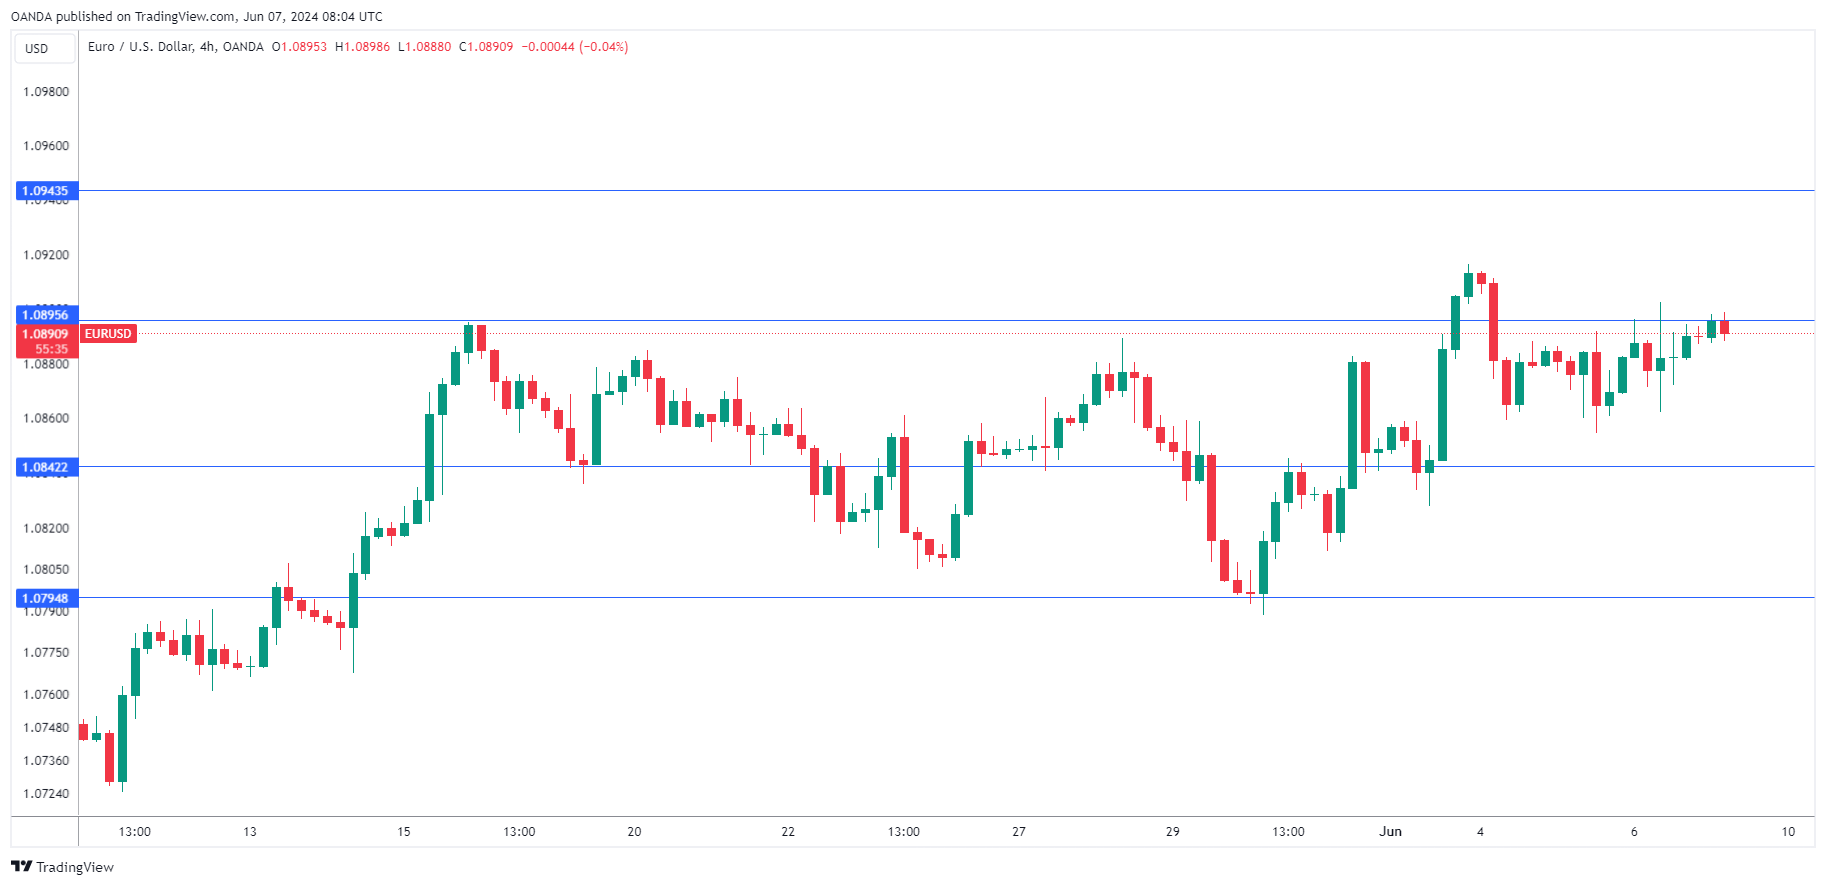
On the H4 chart, EUR/USD has formed an initial wave of decline to 1.0854 and a correction up to 1.0901. We expect the start of a new wave of decline to the level of 1.0833. A break below this level will open the potential for a wave down to 1.0760, with a trend continuation prospect to 1.0750. This first target of the decline wave is technically confirmed by the MACD indicator, whose signal line is at its peak and ready to continue descending.
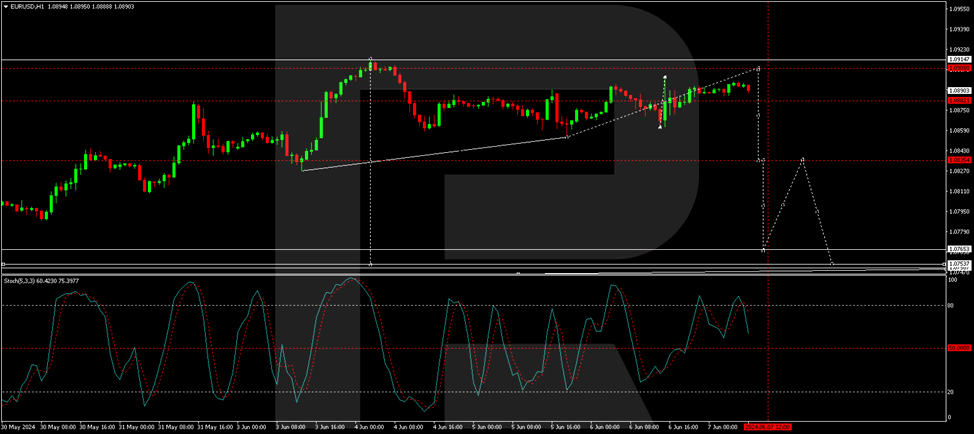
On the H1 chart, EUR/USD is forming a consolidation range around 1.0882. An expansion of the range to 1.0908 is possible. After reaching this level, we will consider the likelihood of a new wave of decline to 1.0882. A break below this level will open the potential for a wave down to 1.0835, with a trend continuation prospect to 1.0765. This local target is technically confirmed by the Stochastic oscillator, whose signal line is below the level of 80. We expect a decline to the level of 20.
USD/CHF: At a Multi-Week Low and Cracking Key Supports ahead US Jobs Data
USDCHF stands at the back foot and hit new multi-week low early Friday, as markets await release of US jobs report for May.
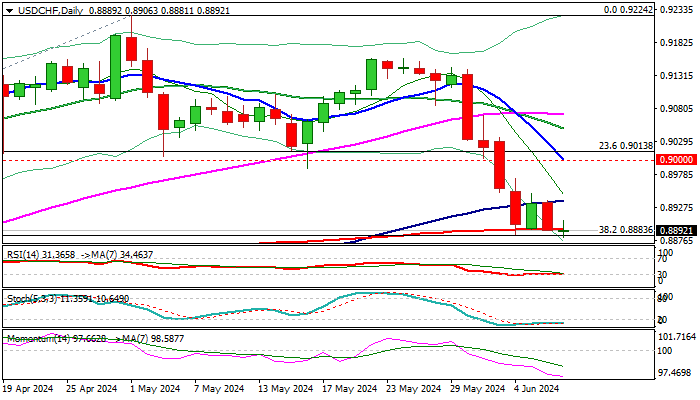
Recent bear-leg from 0.9158 (May 24 lower top) has found solid support at 0.8893/83 zone (200DMA / Fibo 38.2% of 0.8332/0.9224 rally) which contained several attacks in past few sessions, keeping the price in consolidative mode for the fourth consecutive day.
Daily studies are predominantly bearish (strong negative momentum / price action below thick daily cloud / daily Tenkan/Kijun-sen in bearish setup) however, oversold conditions and repeated failure to clearly break 0.8893/83 pivots, questions near-term bears and suggests that fresh signal is needed to define direction.
US labor data, today’s key economic event, are likely to generate that signal.
Economists expect that US economy have added 185K new jobs in May, unemployment is forecasted unchanged at 3.9% and slight increase in average earnings is expected (0.3% May f/c from 0.2% Apr), but also take into consideration softer than expected job openings in April and significant drop in private sector payrolls in May.
Generally, softer than expected May numbers, would add to dovish Fed’s stance and increase pressure on dollar, which would result in USDCHF’s sustained break through key 0.8893/83 supports and open way for further retracement of 0.8332/0.9224 rally.
Conversely, upbeat May job figures would offer fresh support to the greenback and generate initial basing signal.
Res: 0.8937; 0.9000; 0.9049; 0.9070.
Sup: 0.8883; 0.8838; 0.8778; 0.8729.
Canadian Dollar Eyes Can., US Job Data
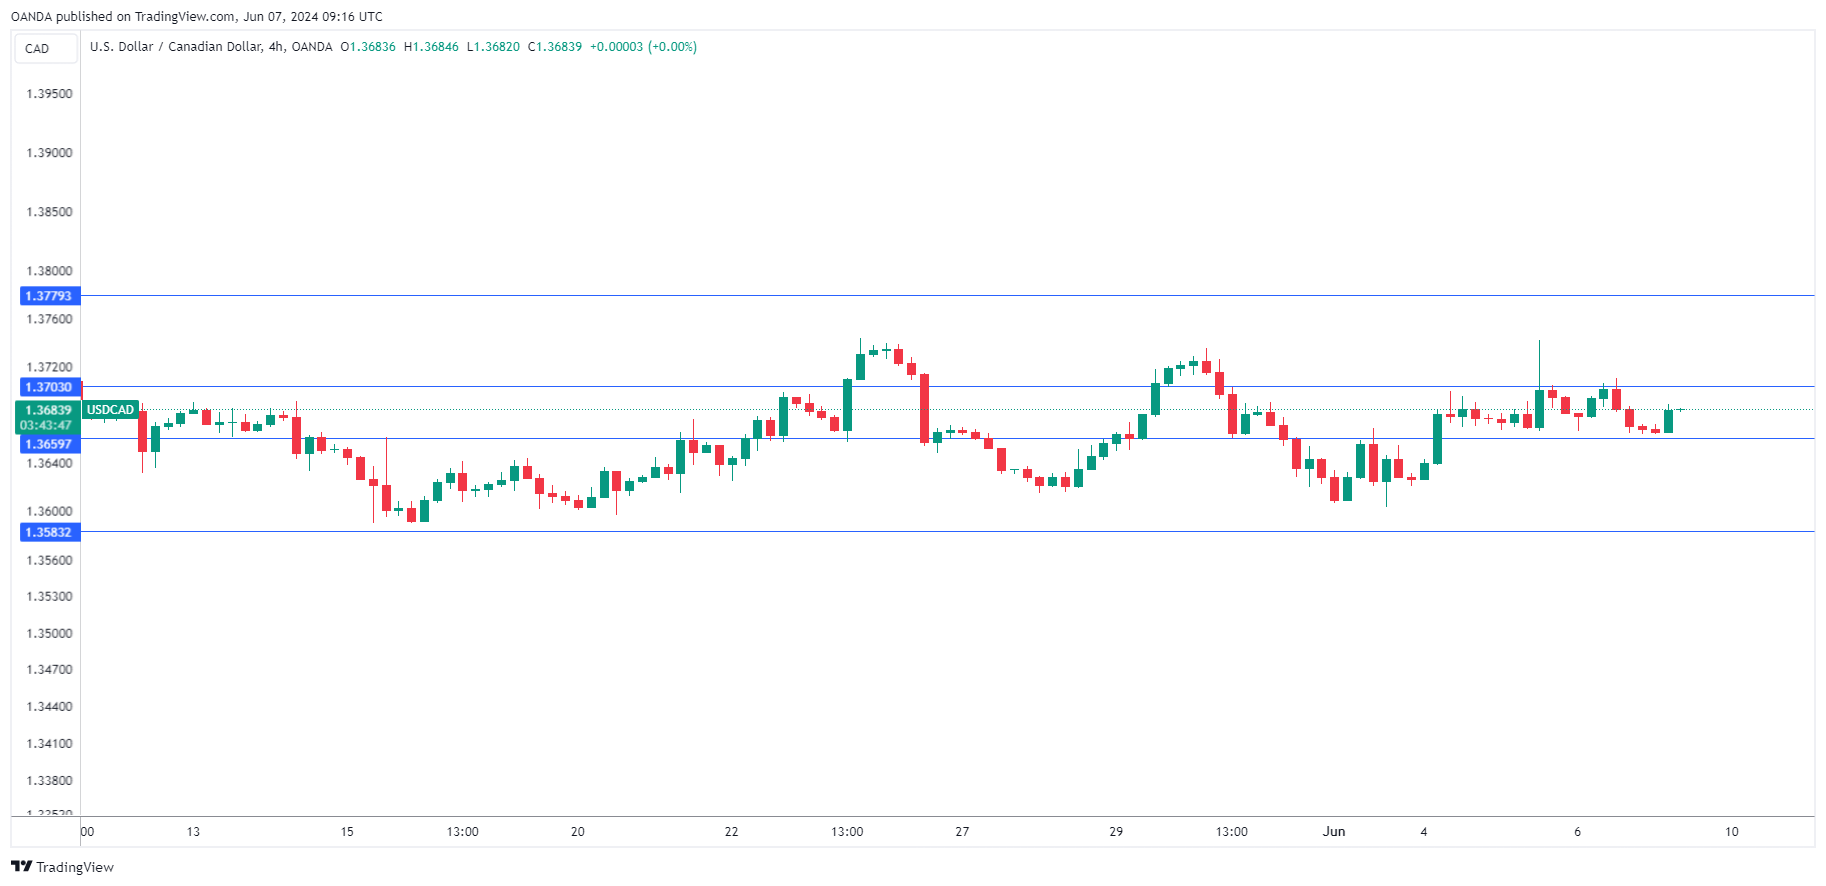
The Canadian dollar has had a relatively quiet week and has ticked higher on Friday. In the European session, USD/CAD is trading at 1.3683, up 0.10%. We could see stronger movement from the pair in the North American session, when both the US and Canada release the May employment report.
Canada’s job growth showed an unexpected spurt in April, as the economy created 90,400 new jobs. This was the highest level in 15 months and crushed the market estimate of 18,000. The numbers were particularly encouraging as employment gains were felt across the economy.
The May report is expected to show a sharp drop, with an market estimate of 22,500. The unemployment rate is forecast to creep up to 6.2%, compared to 6.1% in April. The Bank of Canada will be keeping a close look at the job numbers, as it looks ahead to the next meeting on July 24th. The BoC took the plunge earlier this week and lowered rates from 5.0% to 4.75%. This was the first rate cut in over four years and comes as inflation has fallen to 2.7%, which is within the BoC’s “comfort level” of 1-3%.
The central bank’s inflation target is the midpoint of 2%, but as we saw this week, the BoC is prepared to cut rates even if inflation is above the target. The economy has slowed due to elevated rates and further rate cuts will boost the economy as well as provide relief to households that have been hit hard by sticky inflation and high mortgage payments.
The US releases nonfarm payrolls later today. This release is one of the most important events on the data calendar but has found itself overshadowed by inflation releases. Still, nonfarm payrolls is a market-mover that can have a significant impact on the US dollar. The market estimate stands at 185,000 for May, little changed from the 175,000 gain in April.
USD/CAD Technical
- USD/CAD is putting pressure on resistance at 1.3703. Above, there is resistance at 1.3779
- 1.3659 and 1.3583 are the next support levels
Euro Shrugs as ECB Lowers Rates to 3.75%
The euro is drifting on Friday. EUR/USD is trading at 1.0892 in the European session, up 0.04% on the day. We could see some movement from the euro in the North American session, with the release of US nonfarm payrolls.
ECB cuts, but no commitments to continue
The ECB pressed the rate-cut trigger on Thursday and cut the deposit rate by 0.25% to 3.75%. This followed five straight months of a record high rate of 4.0%. The ECB’s steep rate-tightening cycle has slashed inflation levels but policy makers were hesitant to lower rates until yesterday, fearing that inflation could rebound after a rate cut.
The combination of lower inflation and a weak eurozone economy prodded the central bank to finally lower rates and the move was well-telegraphed. As a result, the euro showed a muted reaction with only slight gains following the rate decision.
ECB President Lagarde said at a press conference after the meeting that there was a “strong likelihood” that the rate cut was the start of “dialling back” rates, but stressed that rate decisions would be based on the data.
The central bank will most likely pause in July and the swap markets have priced in a 60% probability of a September cut. The ECB will want to monitor the effect of the rate cut on economic activity, in particular on inflation. ECB policy makers will also be keeping an eye on the Federal Reserve, which won’t be cutting before September at the earliest. The Fed usually takes the lead on rate policy and the ECB will be hesitant to continue cutting before the Fed, as this will likely weaken the euro and send inflation higher.
The US releases nonfarm payrolls on Friday and little change is expected. In April, nonfarm payrolls fell to 175,000 down sharply from 330,000 in March and its lowest level in six months. The market estimate for May is 185,000. A significant miss from the estimate could wake up the sleepy euro in the North American session.
USDCHF Posts More Than 2-month Low
- USDCHF finds strong obstacle at 200-day SMA
- MACD endorses negative momentum; RSI near oversold region
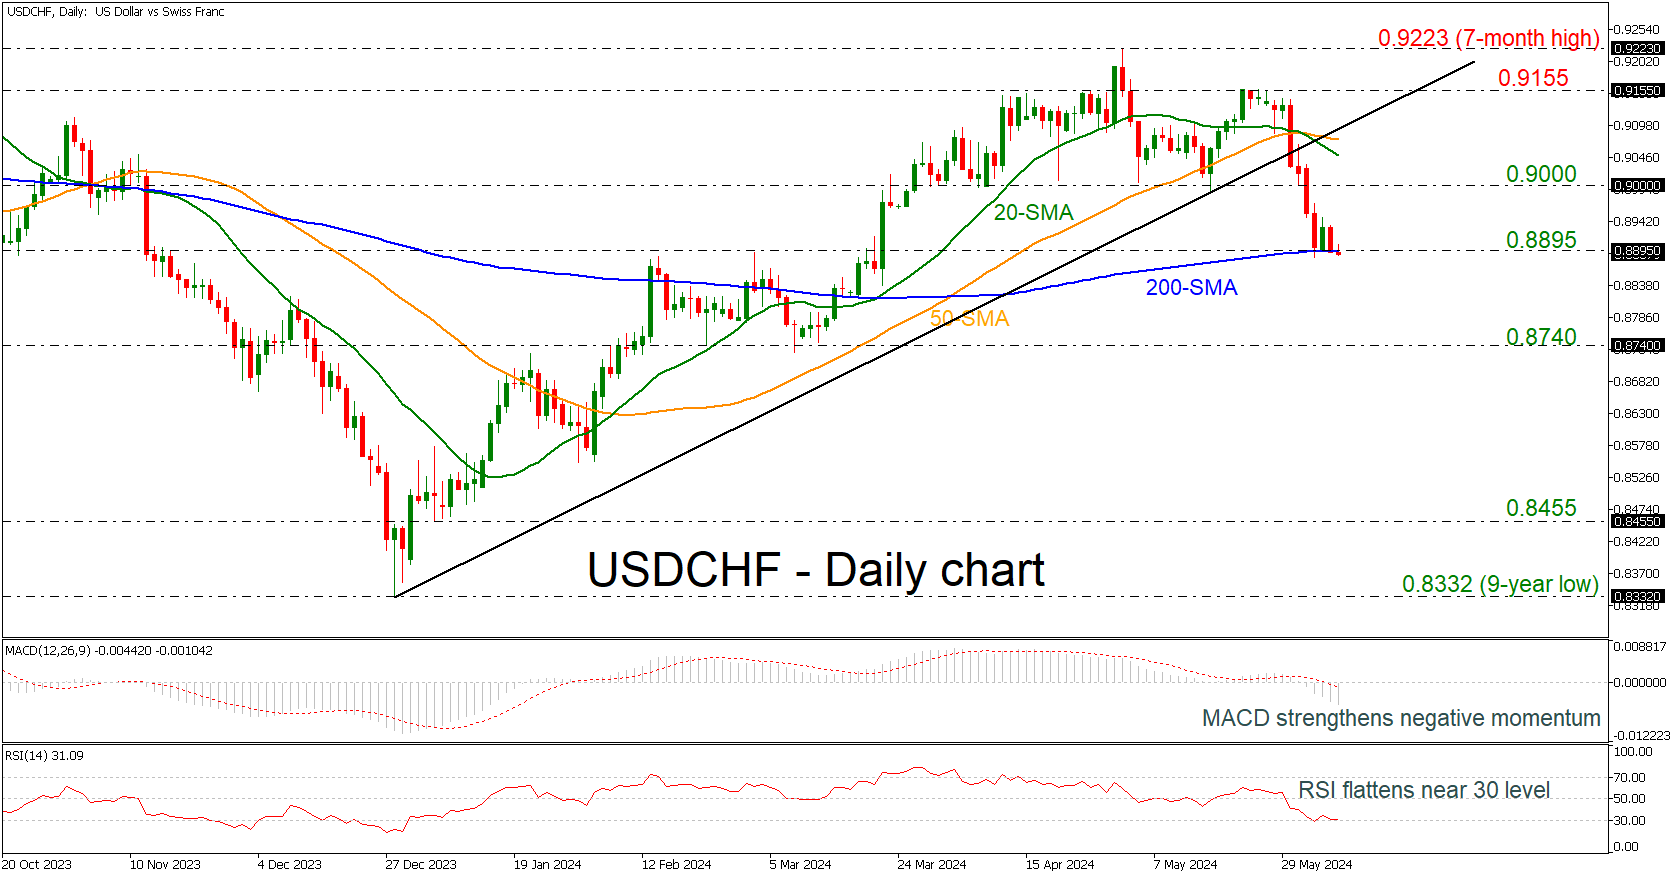
USDCHF plunged to a new more than two-month low of 0.8879 today but has found support at the 200-day simple moving average (SMA) in the 0.8895 area.
The pair is currently in a bearish retracement with the 20- and the 50-day SMAs posting a negative crossover.
According to the technical oscillators, the MACD is extending its negative momentum beneath its trigger and zero lines, while the RSI is moving horizontally near the 30 level.
In case of steeper negative actions, the market may retest the 0.8740 support, while even lower the 0.8455 barricade is waiting to endorse the bearish outlook.
On the other hand, a successful rebound off 0.8895 could drive the market towards the 0.9000 psychological level. Above this restrictive level, the 20- and the 50-day SMAs around 0.9050 and 0.9075 respectively may attract traders’ attention.
All in all, USDCHF is creating a negative move in the short-term view and a slip beneath the flat 200-day SMA could open the way for more decreases.
ECB’s Nagel: Rate cuts not on autopilot
ECB Governing Council member Joachim Nagel stated today that the decision to cut interest rates yesterday was "logical" given the tendency for inflation to decrease. However, he emphasized that inflation remains "stubborn," particularly in the services sector.
Nagel highlighted that negotiated wages are expected to rise sharply this year and continue strong growth thereafter. He noted, "We on the ECB Governing Council are not driving on autopilot when it comes to interest rate cuts."
Council member Olli Rehn stated that inflation will continue to decline and interest rate cuts will support economic recovery. Rehn suggested that the possible scale of interest rate cuts over the next few years could range from 1 to 2 percentage points, assuming no new economic shocks occur.
Council member Gediminas Šimkus indicated that more than one rate cut might be necessary this year. He acknowledged that while data shows clear signs of disinflation, the path ahead will be challenging. Vice President Luis de Guindos added that inflation is expected to be around 2% next year but also noted "huge uncertainty in the economy."
USDCAD Holds Within Recent Range
- USDCAD constrained within a range as US & Canadian jobs data awaited at 12:30 GMT
- Bulls need a rally above 1.3775; bears could take control below 1.3578
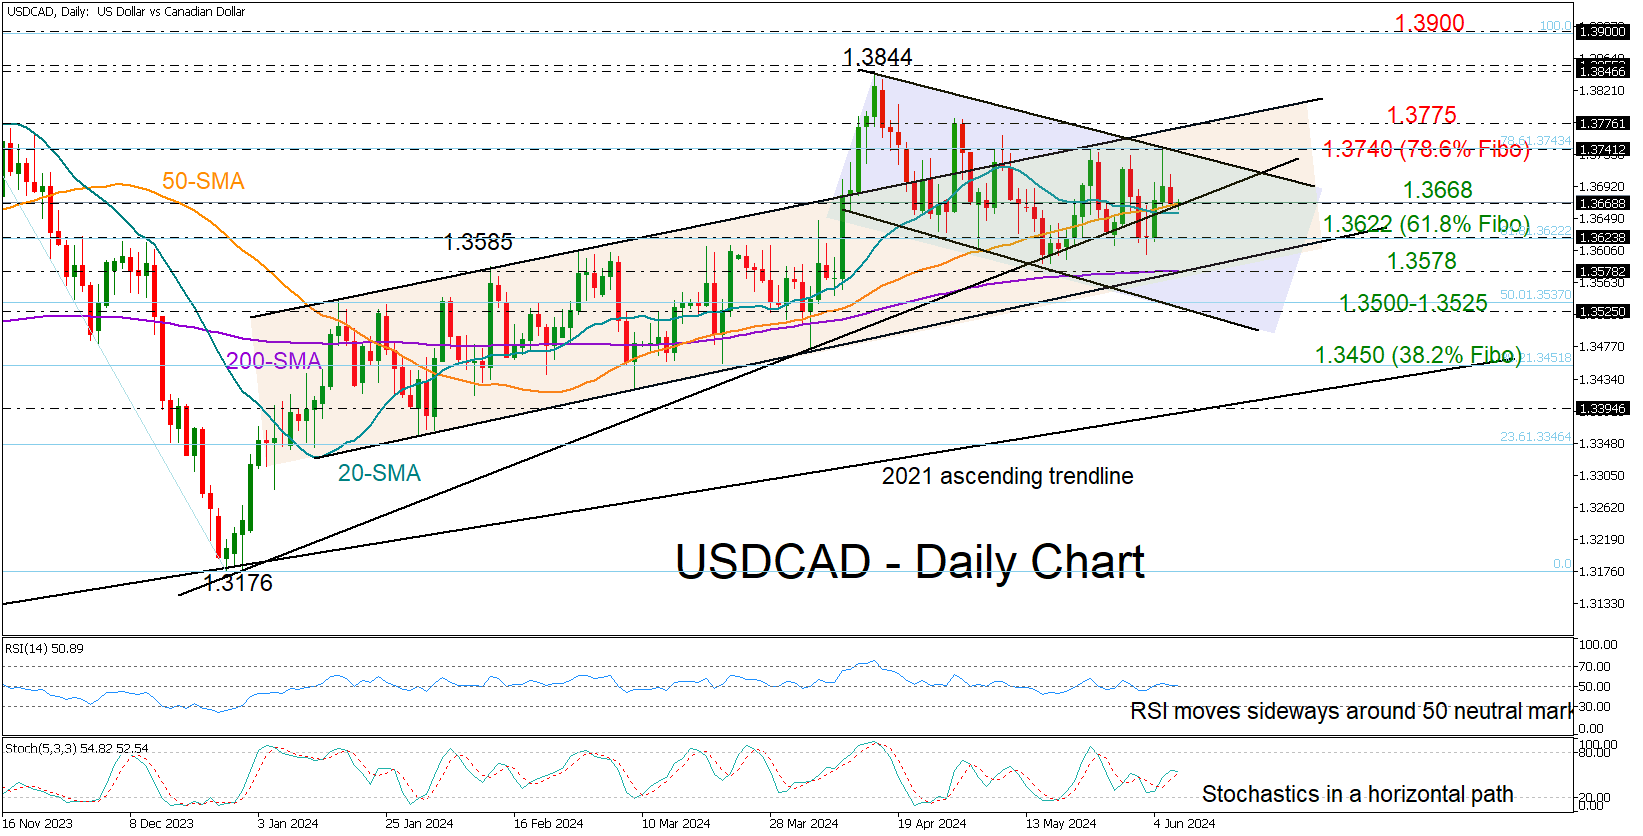
USDCAD has been swinging sideways over the past two weeks between 1.3740 and 1.3600, unable to reverse the short-term downtrend from April’s peak of 1.3844.
The technical signals are currently uncertain, lacking a clear indication as the RSI continues to hover near its neutral mark of 50 and the stochastic oscillator maintains a flat trajectory.
Perhaps a close above the 50-day simple moving average (SMA) at 1.3668 could help the price climb towards the upper band of the range at 1.3740 and probably touch the key resistance line at 1.3775. Note that the 78.6% Fibonacci retracement of the November-December 2023 downleg is within this neighborhood. Further up, the pair could confront the top of 1.3844 and aim for the 1.3900 psychological mark, a break of which would open the door for the 2022 peak of 1.3976.
In the event that downside pressures resurface, initial support could develop around the 61.8% Fibonacci of 1.3622. A move lower and beneath 1.3600 could immediately stall near the 200-day SMA and the crucial support trendline at 1.3578. If the bears claim the latter too, the decline could stretch towards the falling line at 1.3525. Additional losses from there could aggressively squeeze the price towards the 38.2% Fibonacci of 1.3450.
To sum up, the short-term outlook for USDCAD remains neutral. The market could be influenced if it moves sustainably above 1.3775 or below 1.3578.
Gold Price Gains Traction, Crude Oil Price Rises
Gold price started a fresh increase above $2,350. Crude oil is recovering and might rise toward the $78.40 resistance zone.
Important Takeaways for Gold and Oil Prices Analysis Today
- Gold price started a decent increase from the $2,315 zone against the US Dollar.
- A major bullish trend line is forming with support at $2,368 on the hourly chart of gold at FXOpen.
- Crude oil is recovering losses and trading above the $74.30 support.
- There was a break above a connecting bearish trend line with resistance near $73.50 on the hourly chart of XTI/USD at FXOpen.
Gold Price Technical Analysis
On the hourly chart of Gold at FXOpen, the price formed support near the $2,315 zone. The price remained in a bullish zone and started a fresh increase above $2,340.
The bulls even pushed the price above the $2,350 level and the 50-hour simple moving average. Finally, it traded as high as $2,385. The price is now consolidating gains near the $2,385 zone and the RSI is above 70.
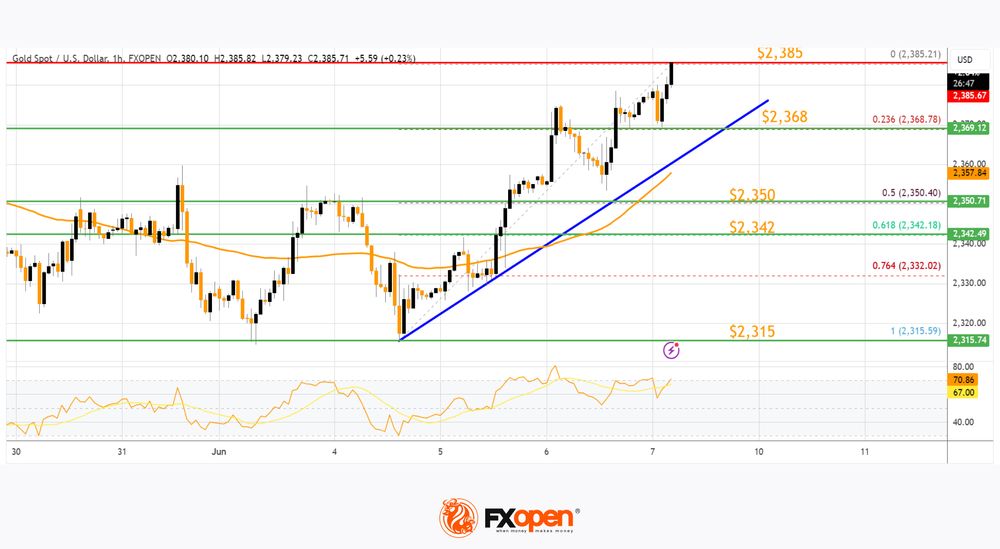
Initial support on the downside is near the 23.6% Fib retracement level of the upward move from the $2,315 swing low to the $2,38 high at $2,368. There is also a major bullish trend line forming with support at $2,368.
The first major support is near the $2,350 zone and the 50-hour simple moving average. It is close to the 50% Fib retracement level of the upward move from the $2,315 swing low to the $2,38 high. If there is a downside break below the $2,350 support, the price might decline further.
In the stated case, the price might drop toward the $2,342 support. Immediate resistance is near the $2,385 level. The next major resistance is near the $2,392 level. An upside break above the $2,392 resistance could send Gold price toward $2,400. Any more gains may perhaps set the pace for an increase toward the $2,420 level.
Oil Price Technical Analysis
On the hourly chart of WTI Crude Oil at FXOpen, the price found support near the $72.40 zone against the US Dollar. The price formed a base and started a recovery wave above $73.50 and the 50-hour simple moving average.
The bulls were able to push the price toward the 50% Fib retracement level of the downward move from the $78.42 swing high to the $72.42 swing low. Besides, there was a break above a connecting bearish trend line with resistance near $73.50.
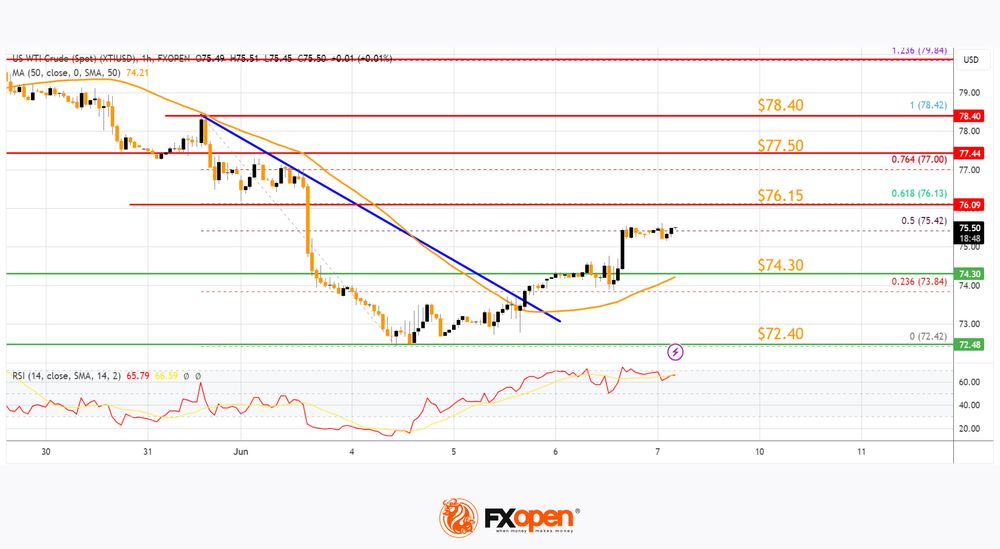
The hourly RSI is near the 65 level, but the price is struggling near $75.50. The next resistance is near the 61.8% Fib retracement level of the downward move from the $78.42 swing high to the $72.42 swing low at $76.15.
A clear move above the $76.15 could send the price toward the $77.50 resistance. Any more gains might send the price toward the $78.40 level. Conversely, the price might start a fresh decline from the $75.50 resistance.
Immediate support sits near the $74.30 level. The next major support on the WTI crude oil chart is $72.40. If there is a downside break, the price might decline toward $72.40. Any more losses may perhaps open the doors for a move toward the $71.20 support zone.
Start trading commodity CFDs with tight spreads. Open your trading account now or learn more about trading commodity CFDs with FXOpen.
This article represents the opinion of the Companies operating under the FXOpen brand only. It is not to be construed as an offer, solicitation, or recommendation with respect to products and services provided by the Companies operating under the FXOpen brand, nor is it to be considered financial advice.