Sample Category Title
Post-Holiday Forex Awakening: Dollar Strengthens on Surprising ISM Manufacturing Expansion
The forex markets roared back to life from holiday lull in early US session, Dollar surges broadly as buoyed by unexpectedly strong ISM manufacturing data. This report marks a pivotal shift for the sector, which has transitioned back into expansion after 16 months of contraction. Additionally, the prices component of the report soared to its highest level since mid-2022. This resurgence poses the question of whether the greenback can sustain its newfound momentum, with further scrutiny from upcoming ISM Services and Non-Farm Payroll data anticipated later in the week.
On the day, New Zealand Dollar emerged as the weakest link, followed by Euro and Sterling. The Canadian Dollar, meanwhile, found itself as the second strongest performer, albeit at a considerable distance behind the surging greenback, with Yen not far behind. Aussie and Swiss Franc occupy the middle ground.
Looking ahead to the Asian session, two critical developments are anticipated. First, with Yen nearing the 152 handle against Dollar once more, market participants are on high alert for verbal (or actual?) intervention from Japan. Second, Australian Dollar is set to face scrutiny as traders digest RBA's minutes, seeking clarity on the central bank's stance of "not ruling anything in or out."
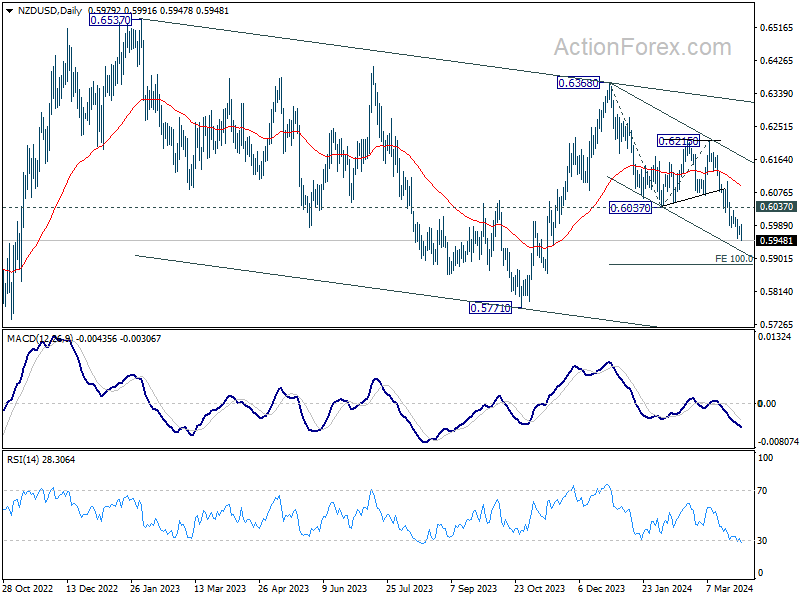
Technically, NZD/USD's decline resumes today and hits as low as 0.5949 so far. Near term outlook will stay bearish as long as 0.6037 support turned resistance holds. Next target is 100% projection of 0.63368 to 0.6037 from 0.6215 at 0.5884. Decisive break there will strengthen the case that whole decline from 0.6537 (2023 high) is resuming through 0.5771 low.
US ISM manufacturing rises to 50.3, first expansion in 16 mth, prices surge
US ISM Manufacturing PMI rose from 47.8 to 50.3 in March, above expectation of 48.5. The sector is now back in expectation for the first time since September 2022.
Looking at some details, new orders rose from 49.2 to 51.4. Production jumped from 48.4 to 54.6. Employment rose from 45.9 to 47.4. Prices rose from 52.5 to 55.8, highest since July 2022.
ISM said: "The past relationship between the Manufacturing PMI and the overall economy indicates that the March reading (50.3 percent) corresponds to a change of plus-2.2 percent in real gross domestic product (GDP) on an annualized basis," says Fiore.
Japan's Tankan survey: Service sector's optimism at highest since 1991
Japan's Q1 quarterly Tankan survey unveils mixed economic sentiment among the nation's large businesses. Service sector expressed their highest levels of optimism in over three decades, contrasting with a slight decline in confidence among manufacturers.
Large manufacturing index dropped from 13 to 11, still surpassing expectation of 10. However, outlook for large manufacturing firms saw modest increase from 8 to 10, slightly below forecasted 11.
On the brighter side, non-manufacturing index climbed from 32 to 34, exceeding expectations of 31 and marking the highest level since 1991. Despite this, non-manufacturing outlook remained steady at 27, falling short of anticipated 30.
Additionally, large all-industry Capex gauge, which measures capital expenditure plans across industries, is projected to grow by 4% in the new fiscal year. This figure, though positive, falls significantly below the anticipated 9.2% growth.
Japan's PMI manufacturing finalized at 48.2, worst of weakness has passed
Japan's PMI Manufacturing was finalized at 48.2 in March, up from February's 47.2, highest in four months.
Usamah Bhatti of S&P Global Market Intelligence noted that while the sector's performance remained "downbeat," there were emerging signs that the "worst of the weakness had passed". This observation is based on softer reductions observed in both output and new orders inflows.
However, it's important to highlight that the average PMI reading for Q1 stood at 47.8, indicating the weakest quarterly performance since Q3 2020, when it was 46.7.
Inflationary pressures "remained marked" Although the rate of input price inflation has moderated to its weakest in over three years, the challenge of high costs persists. In response to these pressures, selling price inflation has intensified to a three-month high, reflecting manufacturers' efforts to safeguard profit margins by transferring higher expenses onto their customers.
China's NBS PMI manufacturing rises to 50.8, first expansion in six months
China's official NBS PMI Manufacturing climbed from 49.1 to 50.8 in March, surpassing expectations of 50.1. This uptick not only marks the sector's first expansion in six months but also represents its highest reading in a year
Details showed notable increases in manufacturing production, which leaped from 49.8 to 52.2, and new orders, which surged from 49.0 to 53.0. Furthermore, new export orders rose from 46.3 to 51.3.
PMI Non-Manufacturing also showed positive momentum, climbing from 51.4 to 53.0, slightly above anticipated figure of 51.3. PMI Composite index, which encompasses both manufacturing and non-manufacturing activities, improved from 50.9 to 52.7,
Zhao Qinghe, senior statistician at NBS, attributed the March surge to increased production resumption efforts following Lunar New Year holiday, alongside improvement in market vitality.
China's Caixin PMI manufacturing ticks up to 51.1
China's Caixin PMI Manufacturing rose from 50.9 to 51.1 in March, above expectation of 51.0, marking the highest level in 13 months.
Wang Zhe, Senior Economist at Caixin Insight Group, noted acceleration in both supply and demand within sector with "overseas demand picking up".
Despite the overall improvement, employment continued "contraction. Additionally, "depressed price level worsened".
GBP/USD Mid-Day Outlook
Daily Pivots: (S1) 1.2608; (P) 1.2626; (R1) 1.2643; More...
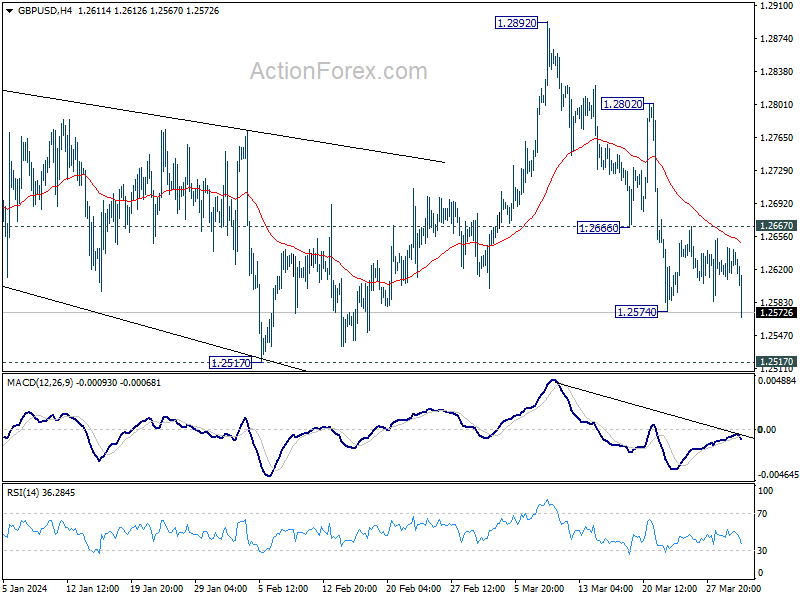
GBP/USD's fall from 1.2892 resumed by breaking 1.2574 support. Intraday bias is back on the downside for 1.2517 structural support first. Decisive break there will suggest that rise from 1.2036 has completed at 1.2892 already, and turn near term outlook bearish. For now, risk will stay on the downside as long as 1.2667 resistance holds, in case of recovery.
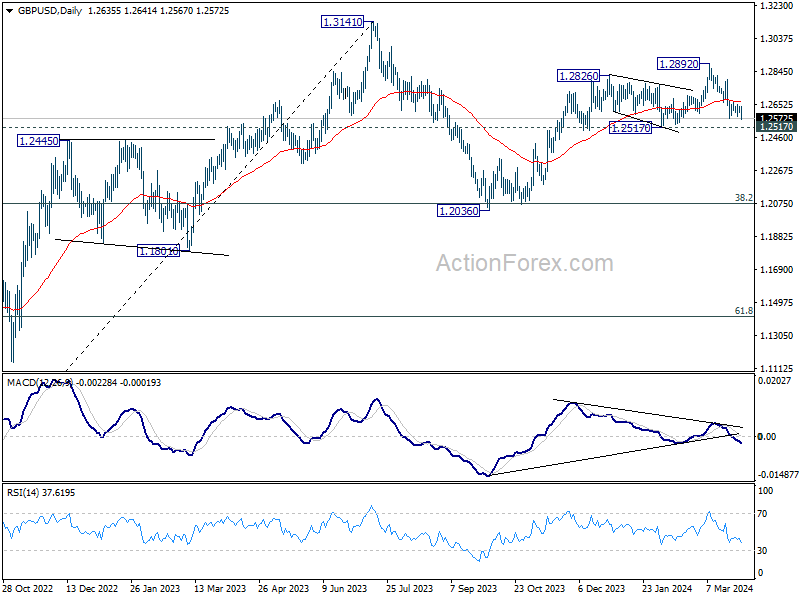
In the bigger picture, price actions from 1.3141 medium term top are seen as a corrective pattern to up trend from 1.0351 (2022 low). Rise from 1.2036 is seen as the second leg, which might still be in progress. But upside should be limited by 1.3141 to bring the third leg of the pattern. Meanwhile, break of 1.2517 support will argue that the third leg has already started for 38.2% retracement of 1.0351 (2022 low) to 1.3141 at 1.2075 again.
Economic Indicators Update
| GMT | Ccy | Events | Actual | Forecast | Previous | Revised |
|---|---|---|---|---|---|---|
| 23:50 | JPY | Tankan Large Manufacturing Index Q1 | 11 | 10 | 12 | 13 |
| 23:50 | JPY | Tankan Non - Manufacturing Index Q1 | 34 | 31 | 30 | 32 |
| 23:50 | JPY | Tankan Large Manufacturing Outlook Q1 | 10 | 11 | 8 | |
| 23:50 | JPY | Tankan Non - Manufacturing Outlook Q1 | 27 | 30 | 24 | 27 |
| 23:50 | JPY | Tankan Large All Industry Capex Q1 | 4.00% | 9.20% | 13.50% | |
| 00:30 | JPY | Manufacturing PMI Mar F | 48.2 | 48.2 | 48.2 | |
| 01:45 | CNY | Caixin Manufacturing PMI Mar | 51.1 | 51 | 50.9 | |
| 13:30 | CAD | Manufacturing PMI Mar | 49.8 | 49.7 | ||
| 13:45 | USD | Manufacturing PMI Mar F | 51.9 | 52.5 | 52.5 | |
| 14:00 | USD | ISM Manufacturing PMI Mar | 50.3 | 48.5 | 47.8 | |
| 14:00 | USD | ISM Manufacturing Prices Paid Mar | 55.8 | 52.8 | 52.5 | |
| 14:00 | USD | ISM Manufacturing Employment Index Mar | 47.4 | 45.9 | ||
| 14:00 | USD | Construction Spending M/M Feb | -0.30% | 0.50% | -0.20% | |
| 14:30 | CAD | BoC Business Outlook Survey |
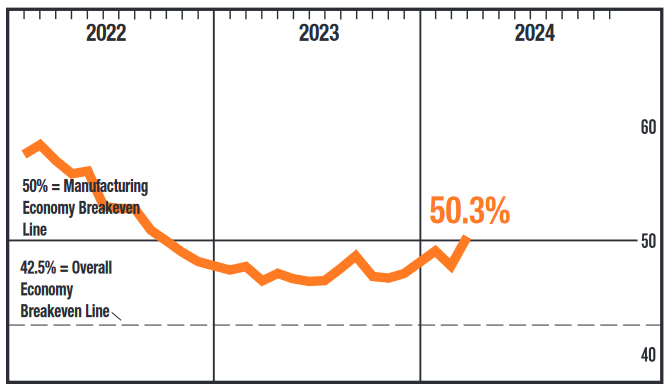
US ISM manufacturing rises to 50.3, first expansion in 16 mth, prices surge
US ISM Manufacturing PMI rose from 47.8 to 50.3 in March, above expectation of 48.5. The sector is now back in expectation for the first time since September 2022.
Looking at some details, new orders rose from 49.2 to 51.4. Production jumped from 48.4 to 54.6. Employment rose from 45.9 to 47.4. Prices rose from 52.5 to 55.8, highest since July 2022.
ISM said: "The past relationship between the Manufacturing PMI and the overall economy indicates that the March reading (50.3 percent) corresponds to a change of plus-2.2 percent in real gross domestic product (GDP) on an annualized basis," says Fiore.
Pound’s Pause Before Dive
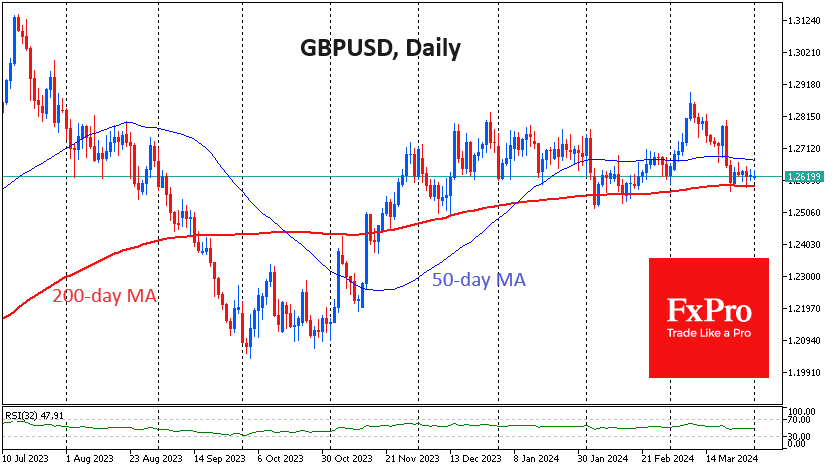
The British Pound has spent the past week in a tight 500 pip range but has mostly traded around the 1.2620 level. Attempts by the bears to send the GBPUSD into a downtrend like the EURUSD have so far failed, with the pair finding buyers on dips towards the 200-day moving average (now at 1.2590) since last November. It looks more like a temporary stalemate against the backdrop of the euro, franc and yen downtrends and the Canadian dollar’s unimpressive momentum.
In terms of moving averages, the uptrend was broken in the early days of February with a sharp dip below the 50-day MA. However, the dip below the longer-term 200-day MA lasted only a few hours. There was even a false attempt to bounce back from it in early March. But it was more of a false breakout, and the pressure on sterling quickly returned.
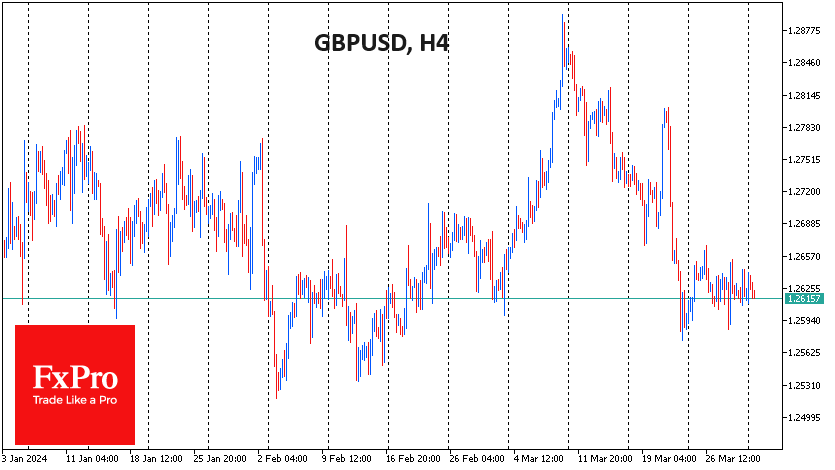
The market driver since the beginning of the year has been the comparison of monetary policy between the US and other developed countries. Last year ended with expectations of four or five Fed rate cuts, with the first in March; now, the probability of more than three cuts is estimated at 33%, starting in June (68% probability). Expectations for the Bank of England have not changed so dramatically. The first cut is still expected around the middle of the year, and for the whole year, 2-3 cuts are expected, down from 3-4 at the end of December.
A consolidation below the 200-day MA looks more like a matter of “when” than “if”, as the dollar tends to strengthen against its major peers. The Pound is in better shape than most of the major currencies, given the less dovish outlook for monetary policy. However, it can rarely swim against the tide for long. Europe has shown time and again that it can move quickly: the Bank of England started raising rates five months before the Fed, and the Swiss National Bank unexpectedly started easing at the end of March.
A GBPUSD fix below 1.26 will draw attention to the pound from those following long-term trends. A break below 1.25 will be an important signal that the market has decided its direction, which will signal the taking of a psychologically important level and confirm the breakdown of support in recent months.
Bitcoin Sets the Stage for Growth
Market picture
The crypto market capitalisation fell to $2.63 trillion. – the bottom of the range for the week. The top coins have moved without momentum over the past 24 hours, with losses for BTC (-0.9%), Ethereum (-1.9%) and BNB (-3%), but gains for Solana (1.4%), Dogecoin (+0.5%) and Toncoin (+2%).
Bitcoin was once again subject to an intensified sell-off after briefly moving above $71.5K. At the start of active trading in Europe, BTCUSD fell below $69K. This is a sharp drop from the immediate upper boundary to the lower boundary of the last six days’ trading range. Such a large amplitude can be explained by reduced liquidity due to the Easter weekend.
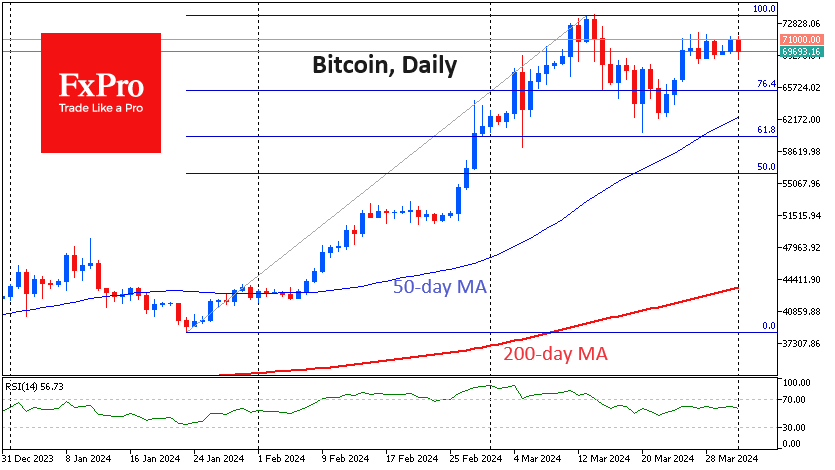
We still see the dips to just below $69K as a post-growth consolidation – an important stage before a new advance. However, we have already seen several false starts, so it is better to wait for confirmation that Bitcoin has completed the consolidation. In our case, it’s the ability to grow above $71.5K.
Bitcoin rose 15.4% in March to $70.9K, hitting all-time highs on several occasions. The number one cryptocurrency has risen in six out of the last seven months. In terms of seasonality, April is considered one of the best months for the top cryptocurrency. Over the past 13 years, Bitcoin has ended the year higher nine times. The average rise has been 21.6%, while the average fall has been 7%.
News background
The monthly demand for BTC in 2024 jumped from 40,000 to 213,000 coins, according to CryptoQuant. The number of available bitcoins fell to 2.7 million, the lowest in four years.
According to Santiment, crypto whales bought 100,000 BTC last week for a total of over $7 billion. According to GoinGlass, open interest in bitcoin futures reached a record $38 billion. The figure rose by $12 billion over the month.
CFTC Commissioner Caroline Pham said the cases against cryptocurrency exchange KuCoin highlight significant differences in approaches to the classification of cryptocurrencies and cross-jurisdictional lines between the CFTC and SEC.
Former CIA contractor Edward Snowden suggested that the largest US crypto exchange, Coinbase, had a good chance of winning its legal battle with the SEC.
Forbes questioned the usefulness of the Ripple ecosystem, specifically the XRP Ledger (XRPL) and the XRP token. In addition to XRPL, Cardano, Bitcoin Cash, Litecoin and Stellar were included in the list of “useless” blockchains, sparking outrage in the crypto community.
Japanese Yen Yawns After Mixed Business Confidence Report
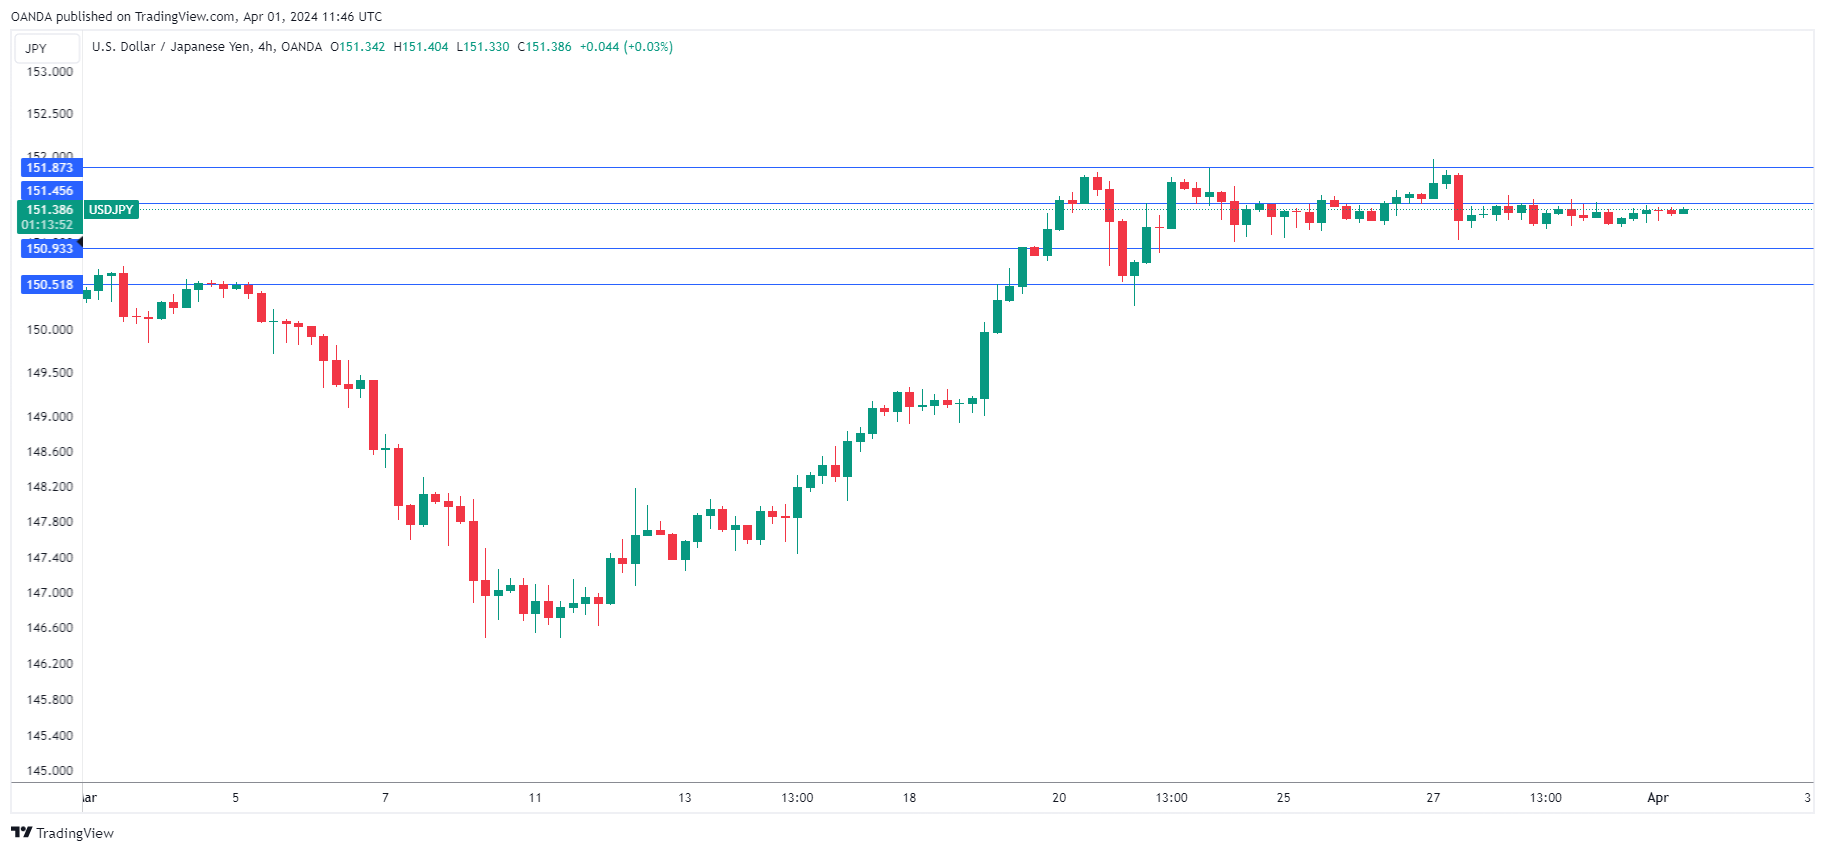
The Japanese yen is coming off a quiet week and is showing little movement on Monday. In the European session, USD/JPY is trading at 151.38, up 0.03%.
Business confidence among major manufacturers falls
The Bank of Japan’s Tankan business confidence survey was a mix and the yen showed a muted response. Business confidence for major Japanese manufacturers eased to 11 in the first quarter, down from a revised 13 in Q4 2023 but above the market estimate of 10. This was the first decline in four quarters and was attributed to weak activity in the auto sector due to production cuts.
The services sector showed an improvement in business confidence, rising to 34 in the fourth quarter, up from a revised 32 in Q4 2023 and just above the market estimate of 33. The index accelerated for an eighth straight quarter and hit its highest level in over 30 years.
With manufacturing and services both showing optimism, the readings are unlikely to change the BoJ’s policy outlook. The central bank lifted rates out of negative territory in late March but has signaled that it will not rush into another rate hike. BoJ policy makers will want to analyse additional data, especially inflation, as part of upcoming rate decisions.
The BoJ has set a rate target of 0% to 0.1%, so it’s fair to say that the central bank is moving very slowly in its tightening. With the Federal Reserve rate at 5% to 5.25%, the US/Japan rate differential was hardly dented by the BoJ rate hike, which explains why the yen didn’t get a boost after the move and remains at very low levels.
USD/JPY Technical
- USD/JPY is putting pressure on resistance at 151.45. Above, there is resistance at 151.87
- There is support at 150.93 and 150.51
XAU/USD: Gold Hits New Record High on Growing Hopes for Fed Rate Cut in June
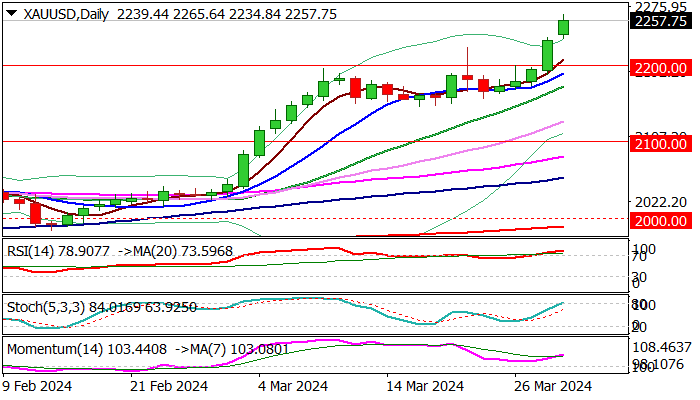
Gold hit new record high ($2265) in early Monday’s trading, as markets reopened after Good Friday’s pause.
The metal starts the month in firm bullish mode, after softer US inflation data boosted expectations for Fed’s first rate cut in June (bets currently show 69% probability for June rate cut).
Gold advanced 3% last week and has registered a monthly gain of 9.3% in March (the biggest monthly rally since July 2020).
Adding to strong bullish stance was the record fastest rally between two round-figure levels ($2100 and $2200) as well as a monthly close above $2200.
Bulls cracked initial target at $225 (Fibo 138.2% projection of the uptrend from $1614) with close above this level to reinforce bullish structure for extension towards $2300 (psychological level) and $2359 (Fibo 161.8% projection).
Daily studies are bullish but overbought that may provide increased headwinds to bulls and pause an action for consolidation.
Former record high ($2222) offers initial support ahead of more significant $2200/$2188 zone (psychological / rising 10DMA) which should ideally contain dips and keep larger bulls intact.
Res: 2265; 2300; 2359; 2400.
Sup: 2222; 2200; 2188; 2172.
Gold Flies to Consecutive Record Highs
- Gold advances sharply in the past few sessions
- Extends its streak of new all-time highs
- Momentum indicators suggest overbought conditions
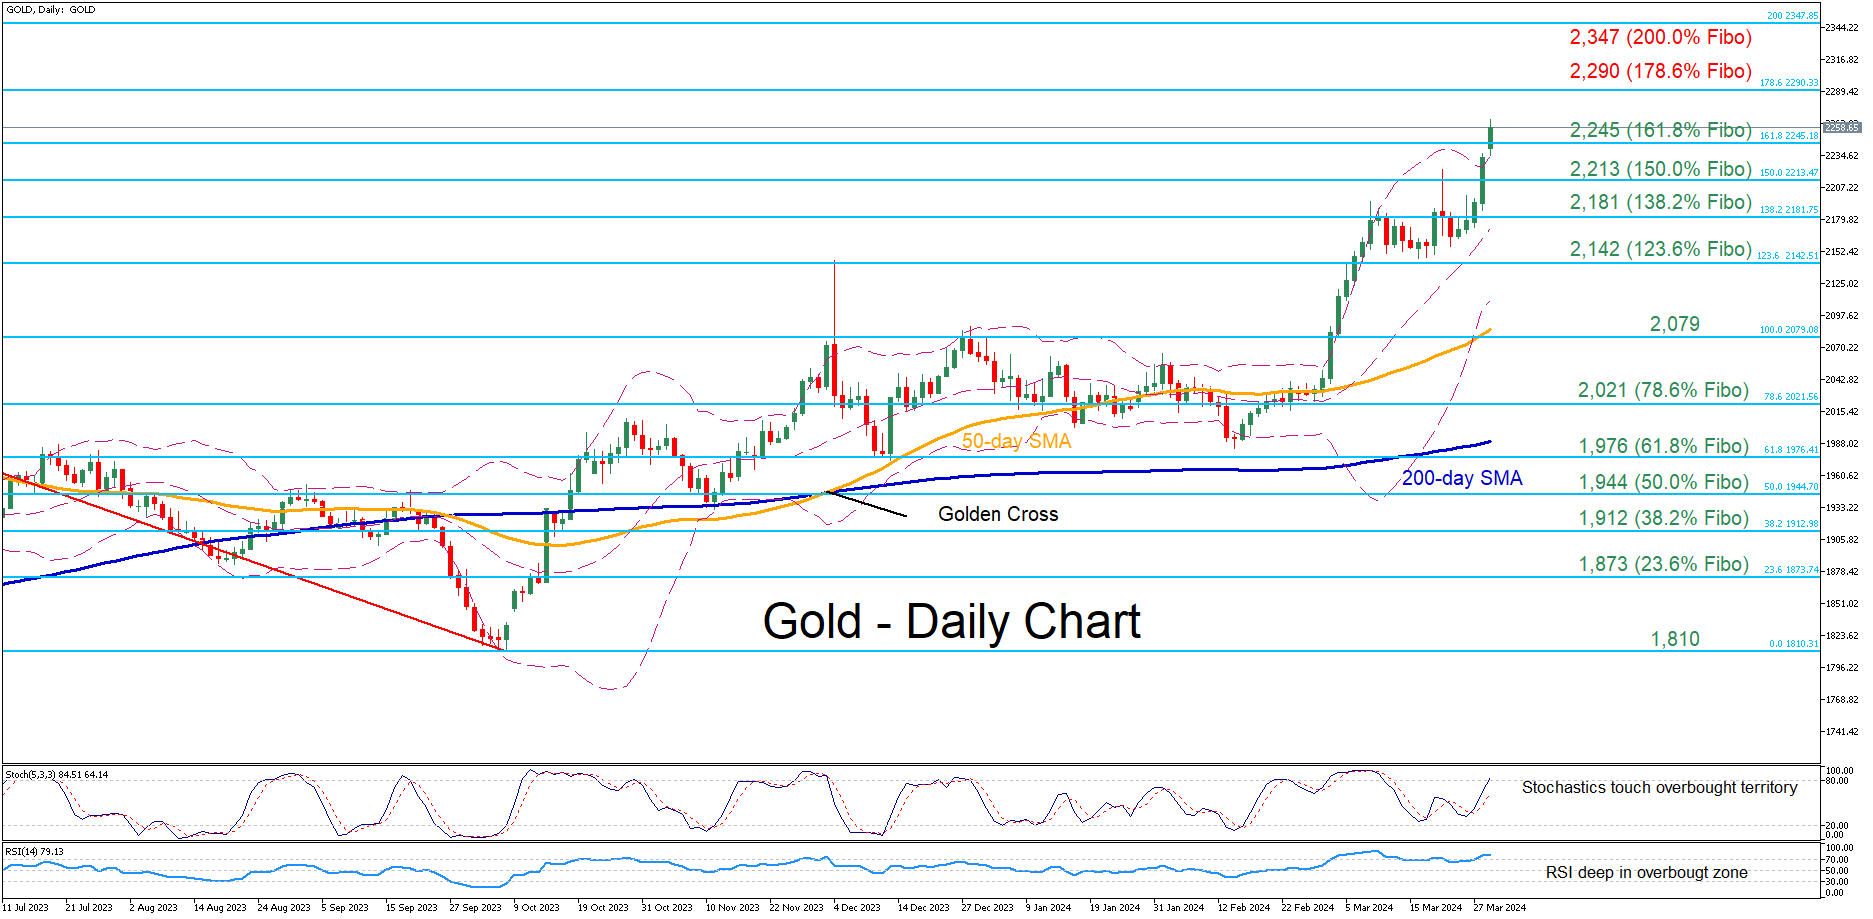
Gold has experienced a massive surge following its profound break above the 50-day simple moving average (SMA) in the beginning of March, generating a series of fresh record highs. However, an impending pullback could be on the cards as the short-term oscillators are flagging overbought signals.
Should the rally persist, the price could resume its movement within uncharted waters, where the Fibonacci extensions of the 2,079-1,810 downtrend may provide potential upside hurdles. Hence, the bulls could initially attack the 178.6% Fibo of 2,290 ahead of the 200.0% Fibo of 2,347. Failing to halt there, bullion might encounter resistance at the 2,500 round number.
In case of a pullback, gold may slide towards the 161.8% Fibo of 2,245 before the 150.0% Fibo of 2,213 comes under scrutiny. A violation of the latter might pave the way for the 138.2% Fibo of 2,181. Furter declines could then stall around the 123.6% Fibo of 2,142.
In brief, gold has been surging to consecutive all-time highs in the past few sessions, trading even above its upper Bollinger band. Therefore, the risk of a downside correction is growing given that technical indicators are warning of an overstretched advance.
EURUSD’s Recent Bearish Tendency to be Tested this Week
- EURUSD trades sideways in anticipation of this week’s key market events
- It remains below the various simple moving averages employed
- Momentum indicators support the current bearish move
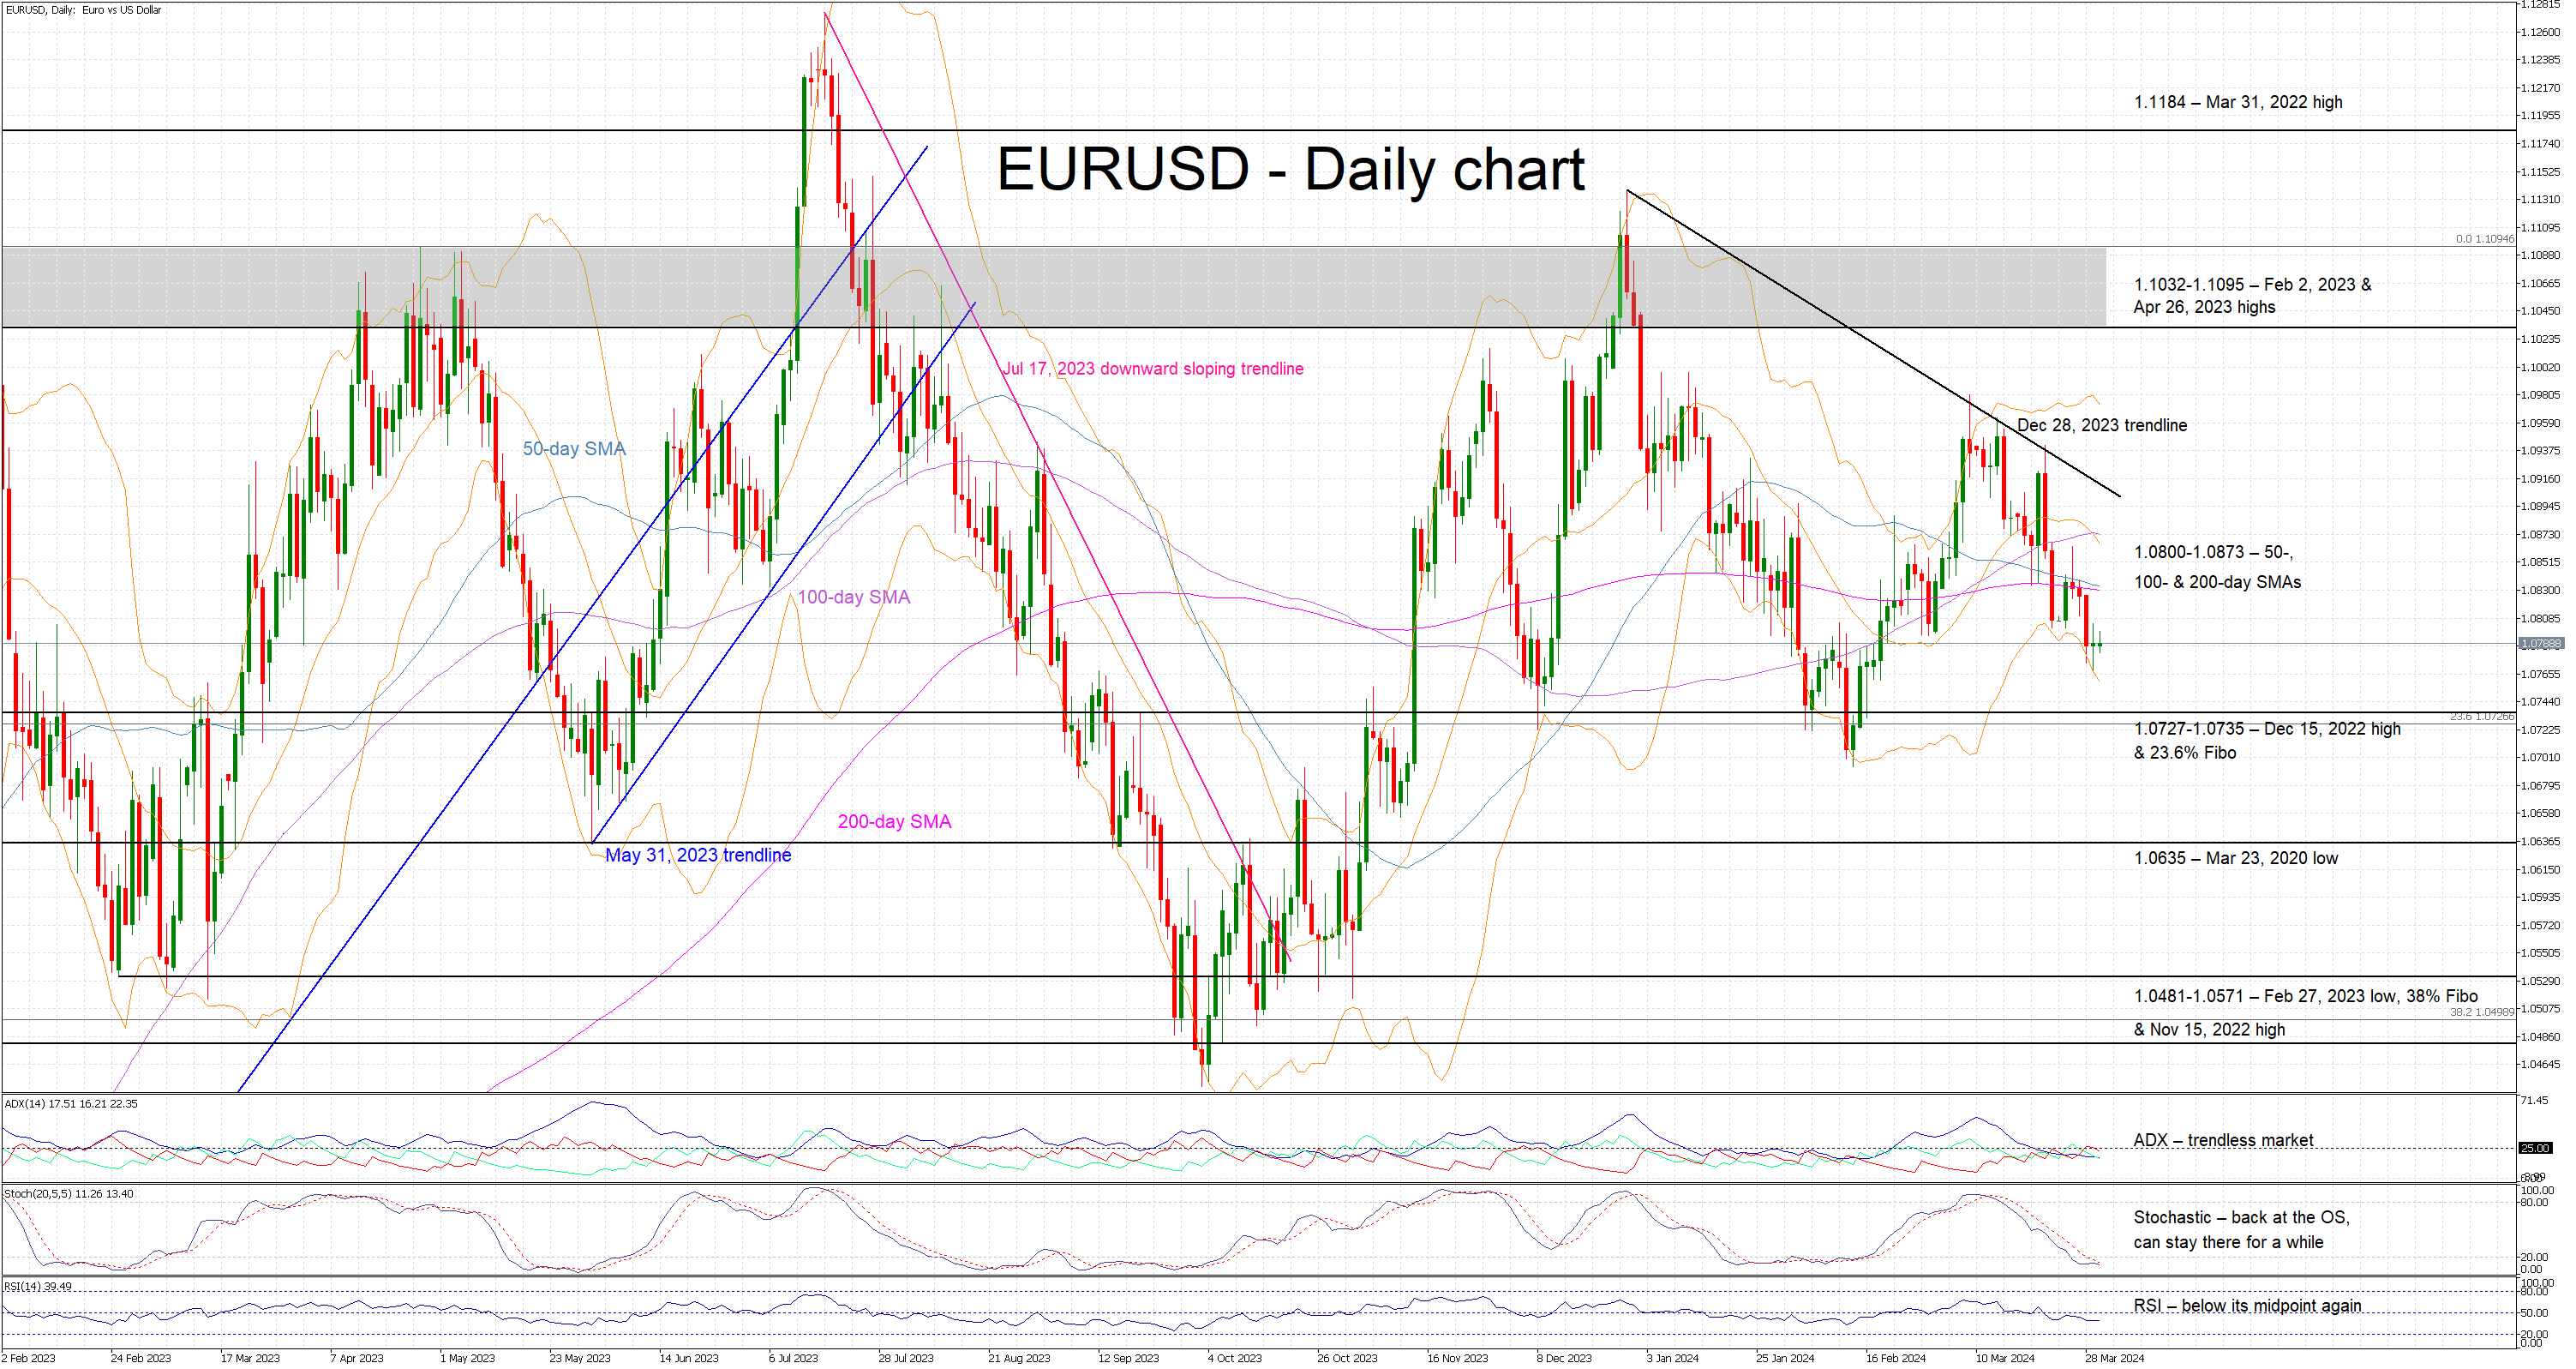
EURUSD is moving sideways today amidst a quieter start of the week due to the Easter Monday holiday observed in Europe. EURUSD has been on the retreat after repeatedly failing to break above the December 28, 2023 descending trendline and it is currently hovering below the 50-, 100- and 200-day simple moving averages (SMA). The bears are probably interested in recording a new 2024 low and, at this stage, they appear to enjoy the support of the momentum indicators.
More specifically, the RSI has dipped below its 50-midpoint, and the Average Directional Movement Index (ADX) remains stuck below its 25-threshold and thus pointing to a trendless market in EURUSD. More importantly, the stochastic oscillator is hovering at its oversold territory (OS). It can stay there for a while before attempting to climb higher.
Should the bears remain confident, they could try to push EURUSD decisively towards the 1.0727-1.0735 area, which is populated by the December 15, 2022 high and the 23.6% Fibonacci retracement of the September 28, 2022 – July 18, 2023 uptrend. If successful, they could then have the chance to record a new 2024 low and possibly target the next likely support area at 1.0635.
On the flip side, the bulls are desperately trying to regain market control and push EURUSD back above the 1.0800-1.0873 area where the 50-, 100- and 200-day SMAs currently reside. They could then have a go at retesting the resistance set by December 28, 2023 descending trendline. If they manage to overcome this trendline, they could then set sail for the key 1.1032-1.1095 range.
To sum up, EURUSD bears have taken advantage of the recent newsflow but their efforts could prove inadequate if they fail to record a new 2024 low soon.
EUR/USD Daily Outlook
Daily Pivots: (S1) 1.0772; (P) 1.0789; (R1) 1.0810; More...
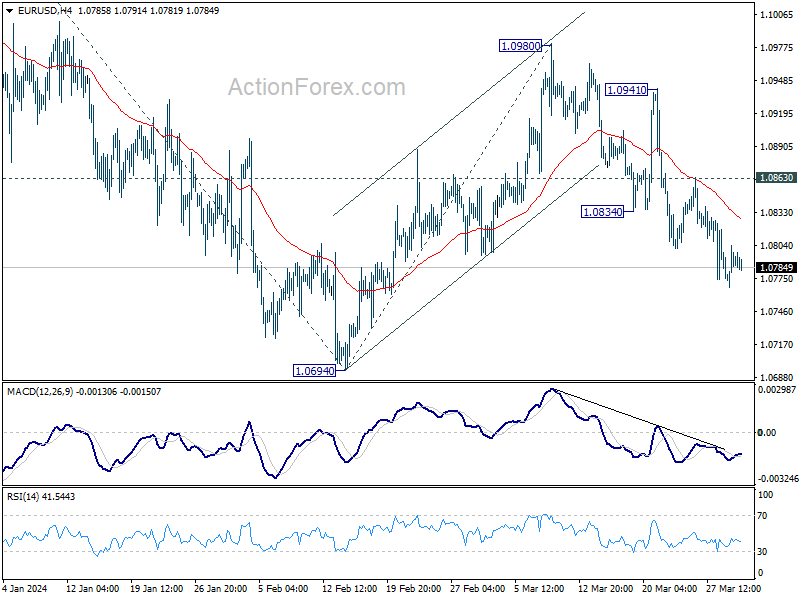
Intraday bias in EUR/USD remains on the downside for the moment. Fall from 1.0980 should target 1.0694 support first. Break there will resume the whole decline from 1.1138 and target 100% projection of 1.1138 to 1.0694 from 1.0980 at 1.0536. Nevertheless, break of 1.0863 minor resistance will turn intraday bias neutral again.
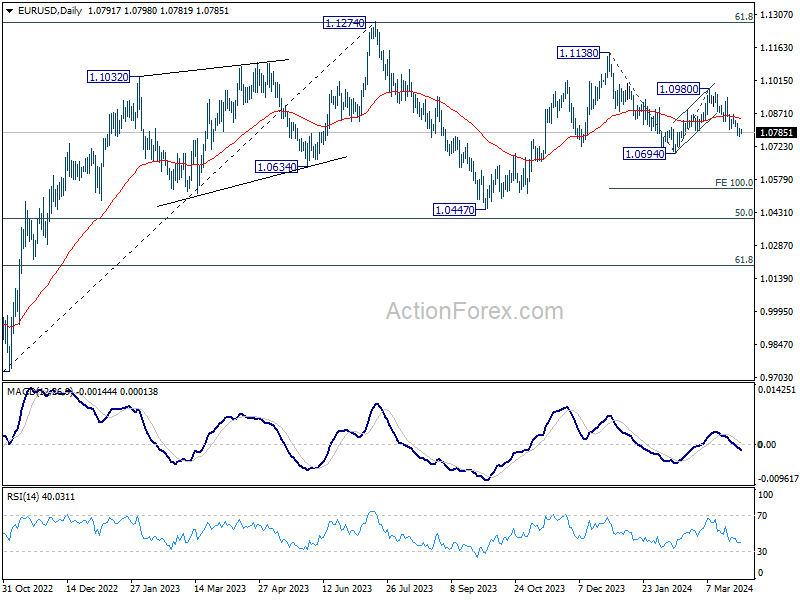
In the bigger picture, price actions from 1.1274 are viewed as a corrective pattern to rise from 0.9534 (2022 low). Rise from 1.0447 is seen as the second leg. While further rally could cannot be ruled out, upside should be limited by 1.1274 to bring the third leg of the pattern. Meanwhile, sustained break of 1.0694 support will argue that the third leg has already started for 1.0447 and possibly below.
USD/JPY Daily Outlook
Daily Pivots: (S1) 151.18; (P) 151.34; (R1) 151.51; More...
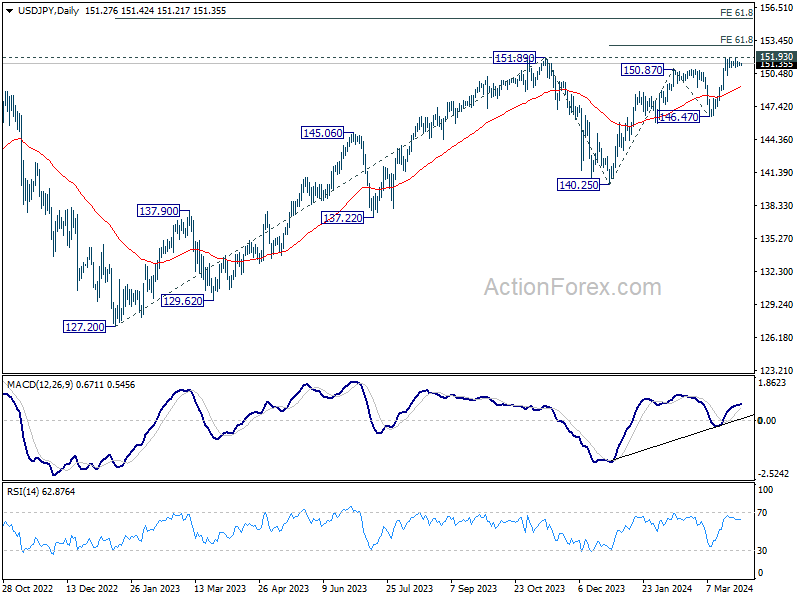
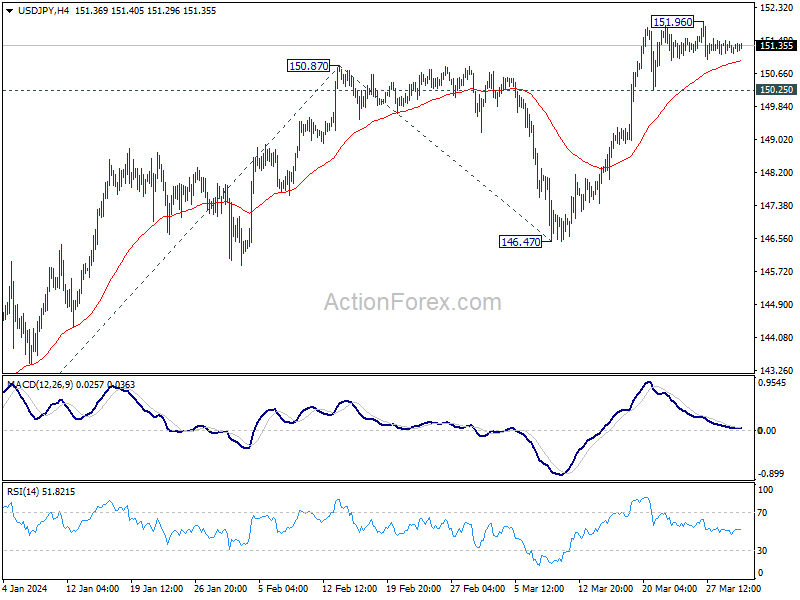
Intraday bias in USD/JPY remains neutral as range trading continues below 151.96. On the downside, break of 150.25 support should confirm short term topping, and turn bias back to the downside for 55 D EMA (now at 149.25). Nevertheless, sustained break of 151.93 key resistance will confirm long term up trend resumption. Next near term target will be 61.8% projection of 140.25 to 150.87 from 146.47 at 153.03.
In the bigger picture, correction from 151.87 (2023) high could have completed at 140.25 already. Rise from 127.20 (2023 low), as part of the long term up trend, is probably ready to resume. Decisive break of 151.93 resistance (2022 high) will confirm this bullish case. Next medium term target will be 61.8% projection of 127.20 to 151.89 from 140.25 at 155.20. This will remain the favored case as long as 146.47 support holds, in case of another pullback.