Sample Category Title
Dominant US Dollar Turns to Another Round of Data
The US dollar will be in the spotlight this week with the Fed’s favorite inflation measure on Thursday ahead of the ISM manufacturing PMI on Friday. Concerns about rampant inflation have been overshadowed by fears of a recession, so these releases could be crucial in shaping the narrative around the Fed. Overall, the dollar is unlikely to lose its shine while energy prices remain so high, torturing the euro and yen.
Inflation or recession?
The narrative in financial markets has shifted lately. Concerns around inflation running wild have taken a back seat, replaced by worries that economic growth is about to slow down dramatically. The risk of recession is the new public enemy.
Such concerns were reflected in the latest S&P Global PMI surveys, which showed a “remarkable drop in demand for goods and services” alongside a very sharp decline in business confidence. Several major retailers have also been complaining about having inventory they cannot unload, the housing market is feeling the burn of soaring mortgage rates, and hiring has slowed.
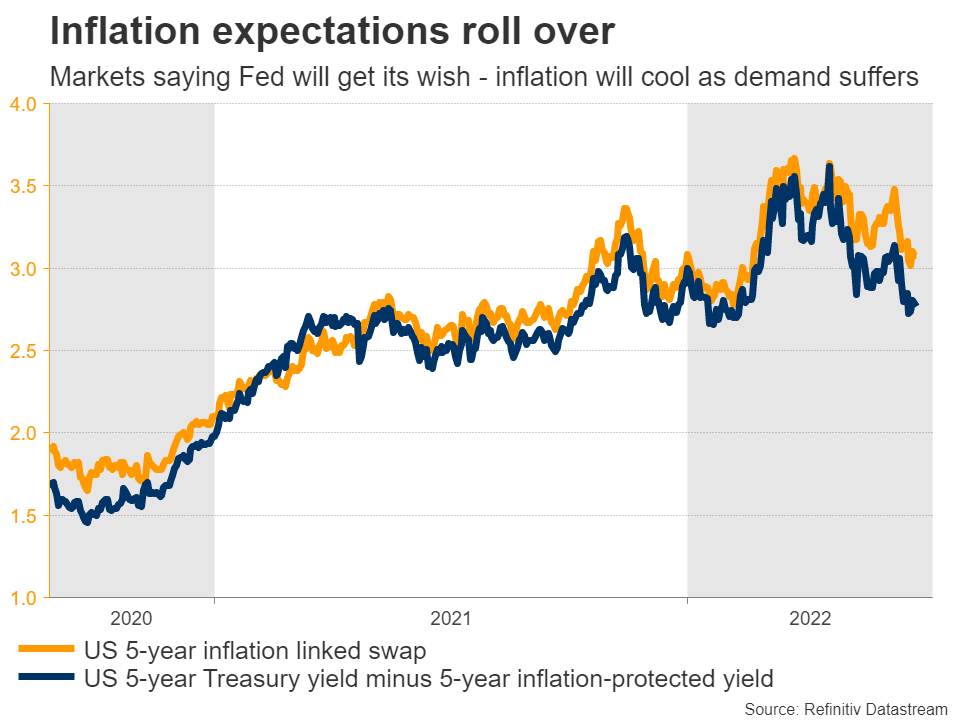
Traders are well aware of all this. Various commodity prices have taken heavy damage lately, market-based measures of inflation expectations have rolled over, and the terminal level of interest rates has been pushed lower - all consistent with a weakening economic data pulse.
Market participants are essentially saying the Fed will get its wish - inflation is going to cool, but only because the economy will struggle.
Upcoming data
Bearing all this in mind, the upcoming batch of data could be crucial as markets grapple with how much the Fed is going to raise interest rates over the coming months. The show will get started on Thursday with the core PCE price index for May, alongside personal consumption and income numbers for the same month.
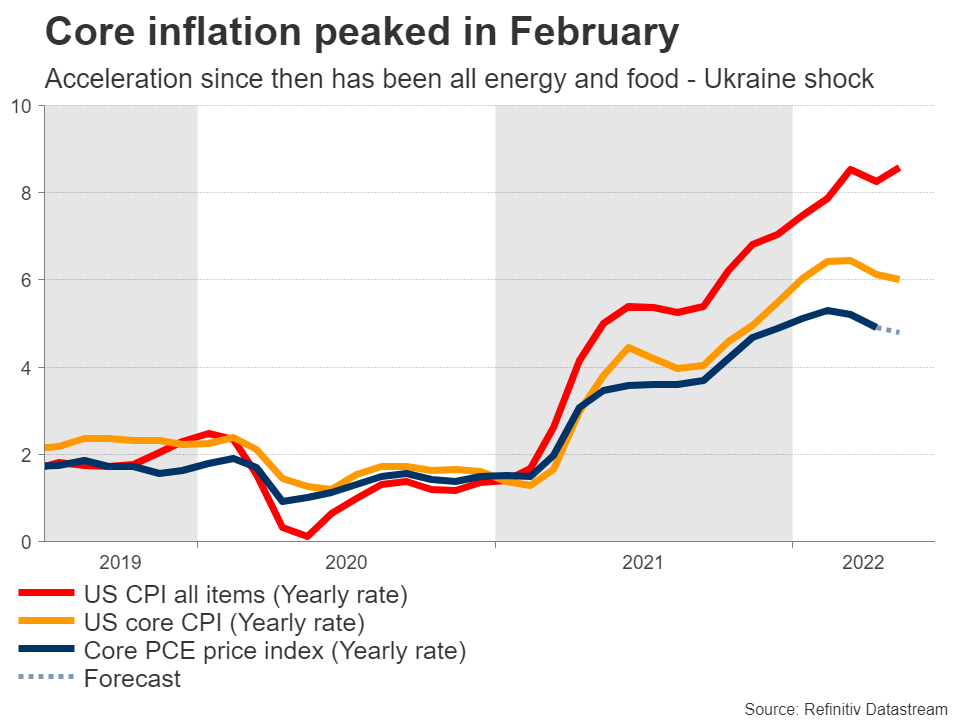
The core PCE price index is expected to have inched lower in yearly terms, falling to 4.8% from 4.9% in the previous month. It has been falling steadily since February, confirming that most of the acceleration in inflation we have seen since then boils down to energy and food prices going berserk after Ukraine was invaded.
Then on Friday, the ISM manufacturing index for June will hit the markets. This is likely to attract the most attention, as some of its components like new orders are considered forward-looking indicators of economic activity. If it echoes a similarly gloomy outlook as the other PMI surveys, bets for Fed rate increases could be dialed back further, spelling bad news for the dollar.
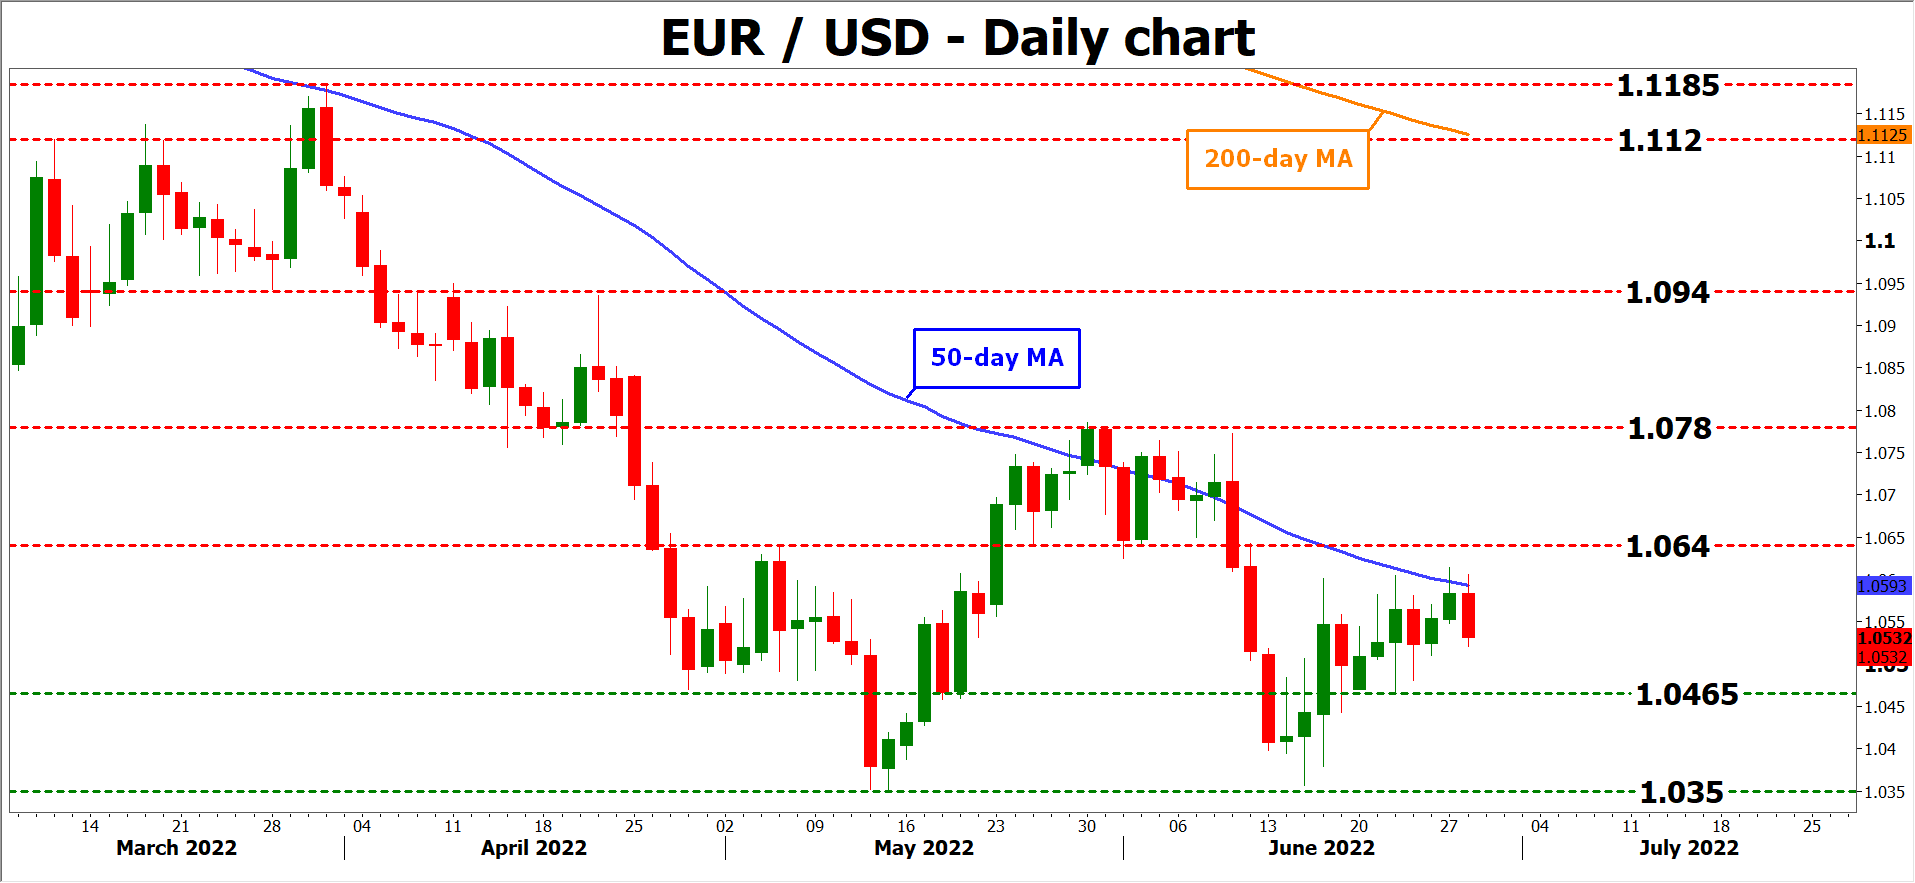
In this scenario, euro/dollar could violate its 50-day moving average and move higher for a test of the 1.0640 region.
On the other hand, a surprisingly strong batch of data could send the pair lower, with the 1.0465 likely to act as an initial support barrier.
No trend reversal yet
In the bigger picture, it is difficult to call for any reversal in the dollar while it is the only major currency that offers both attractive interest rates and safety thanks to its reserve currency status.
That is especially true when other major currencies are battling their own demons. Surging energy prices have devastated both the euro and the yen, by depriving them of their biggest historical advantage - a massive trade surplus. Both the Eurozone and Japan are running large trade deficits now, since they have to pay so much more to import energy products.
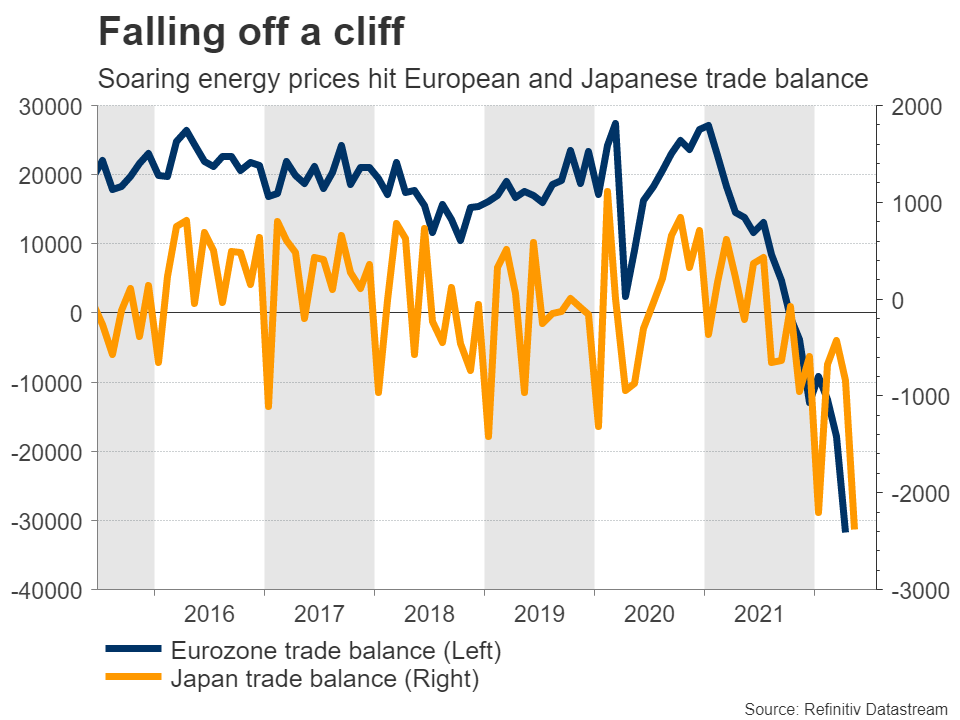
As such, the trajectory of oil prices might be the most important determinant for the FX market moving forward. A sustained decline in oil prices could simultaneously revive the euro and yen, and hamstring the dollar since the Fed wouldn’t need to be so aggressive with rate increases.
This is the missing piece for a trend reversal in the FX arena - lower energy prices. Until that happens, the mighty dollar is unlikely to lose its crown.
Technical Outlook and Review
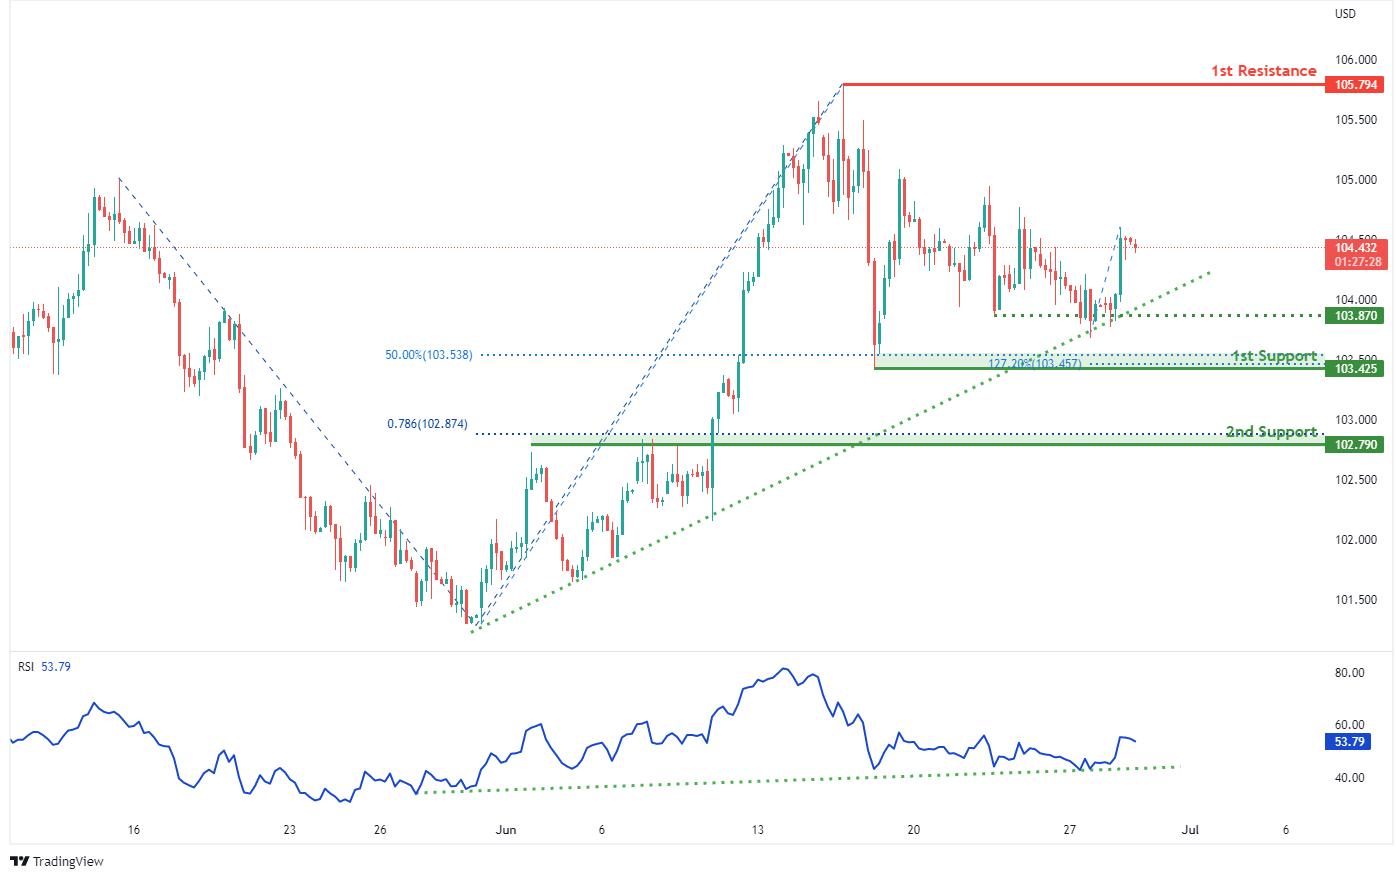
DXY:
On the H4, with RSI moving along an ascending trendline and prices moving along the ascending trendline, we have a bullish bias that bullish momentum will carry prices from our 1st support at 103.425 where the 127.2% fibonacci extension, 50% fibonacci retracement and swing low support are, after price has dropped to the 1st support level, to our 1st resistance at 105.794 in line with the horizontal swing high resistance. Take note of intermediate support at 103.870 where the swing low support is. Alternatively, price may break 1st support structure and head for 2nd support at 102.790 where the horizontal overlap support and 78.6% fibonacci projection are.
Areas of consideration:
- H4 time frame, 1st resistance at 105.794
- H4 time frame, 1st support at 103.425
XAU/USD (GOLD):
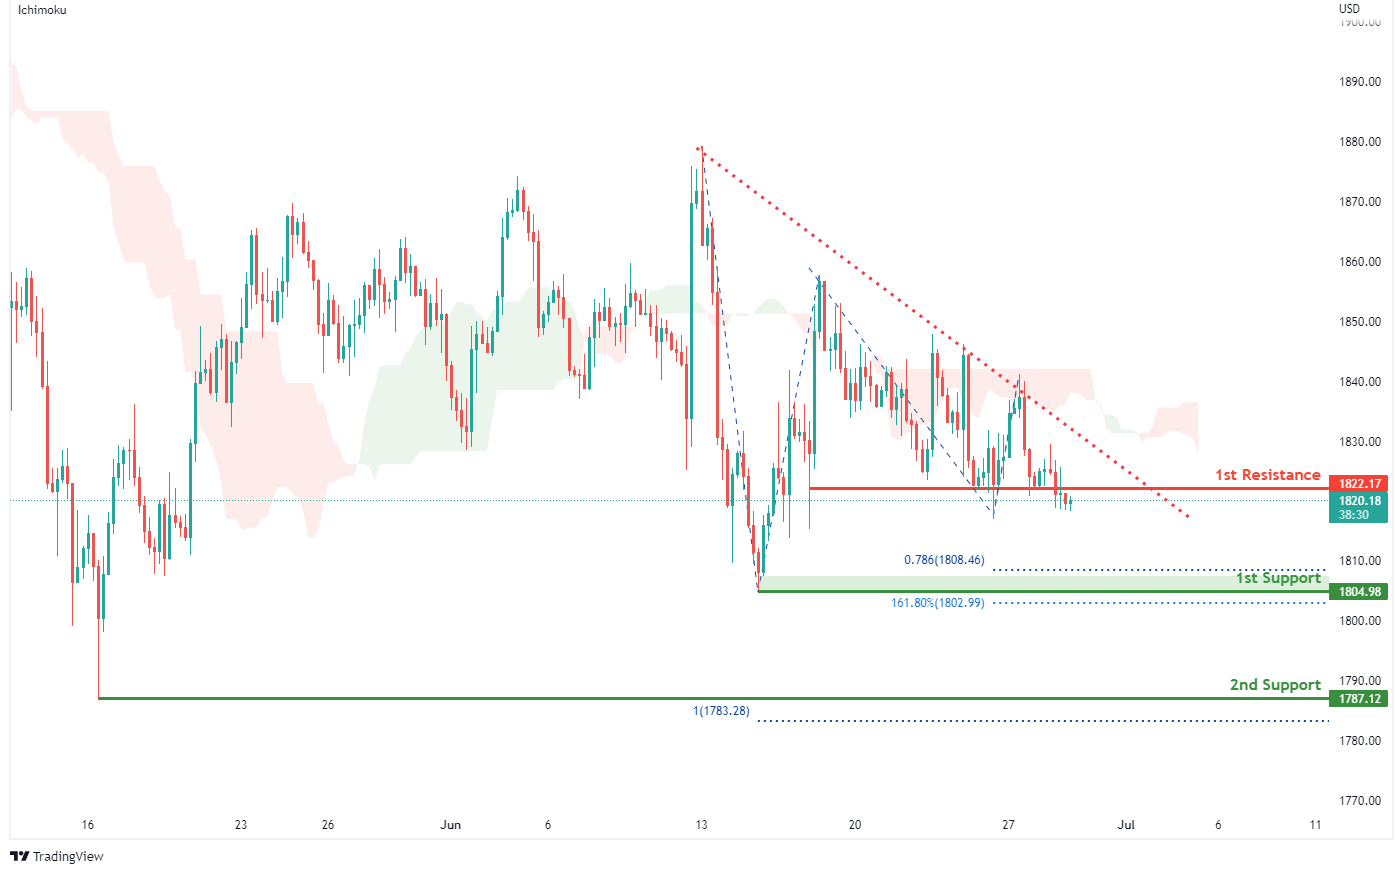
On the H4, with prices moving below the ichimoku indicator and along a descending trendline, we have a bearish bias that prices will drop to our 1st support at 1804.98 where the horizontal swing low support, 161.8% fibonacci extension and 78.6% fibonacci projection are. Once we have downside confirmation, we would expect bearish momentum to carry price to 2nd support at 1787.12 in line with swing low support and 100% fibonacci projection. Alternatively, price could rise to our 1st resistance at 1822.17 in line with overlap resistance.
Areas of consideration:
- H4 time frame, 1st Resistance at 1822.17
- H4 time frame, 1st Support at 1804.98
GBP/USD:
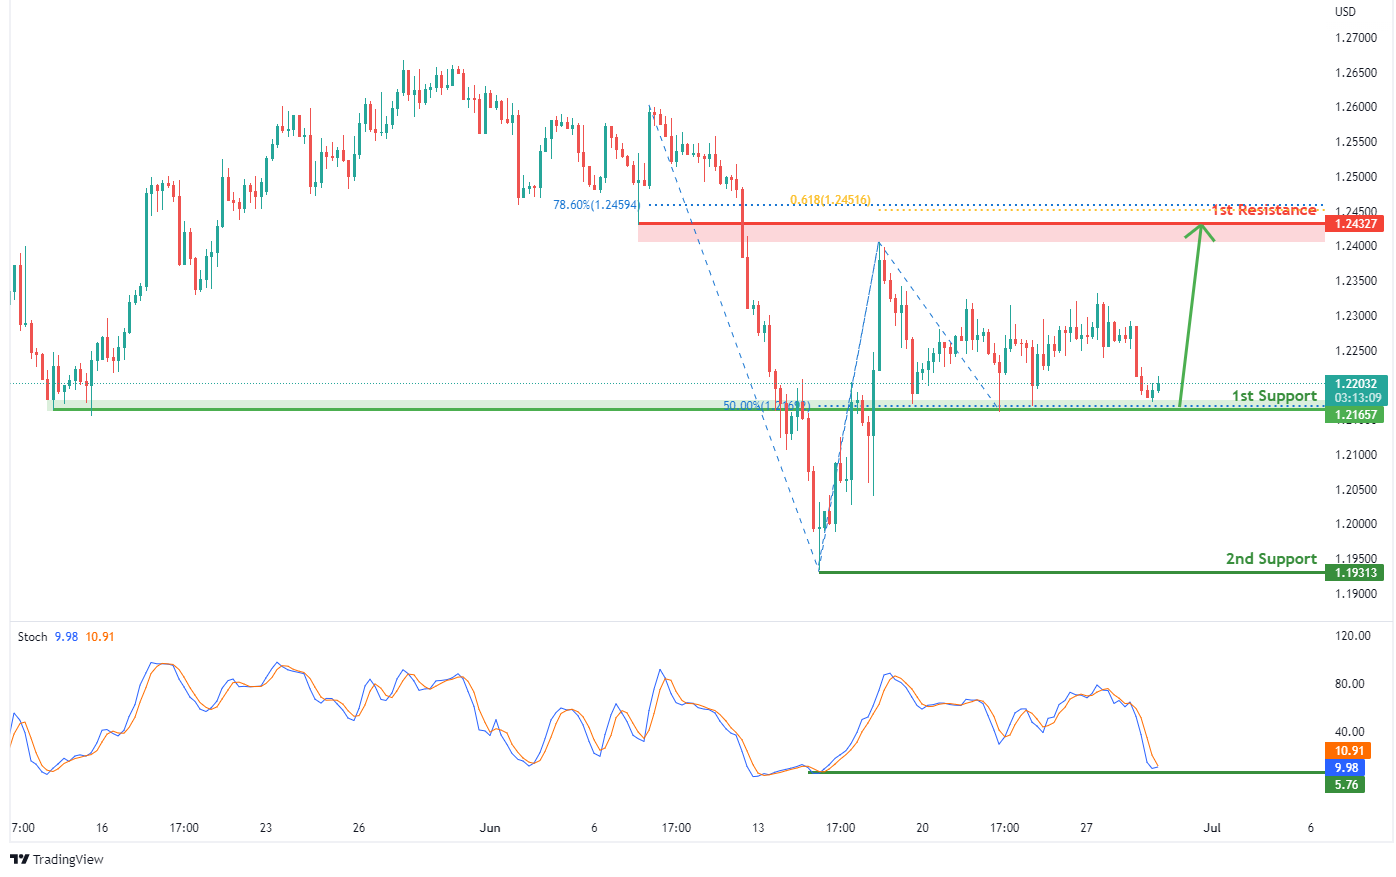
On the H4, with prices expected to bounce off the stochastic support, we have a bullish bias that price will drop and rise from our 1st support at 1.21657 where the horizontal overlap support and 50% fibonacci retracement are to our 1st resistance at 1.24327 in line with the 61.8% fibonacci projection, 78.6% fibonacci retracement and pullback resistance. Alternatively, price may break 1st support structure and head for 2nd support at 1.19313 where the horizontal swing low support is.
Areas of consideration:
- H4 1st resistance at 1.24327
- H4 1st support at 1.21846
USD/CHF:
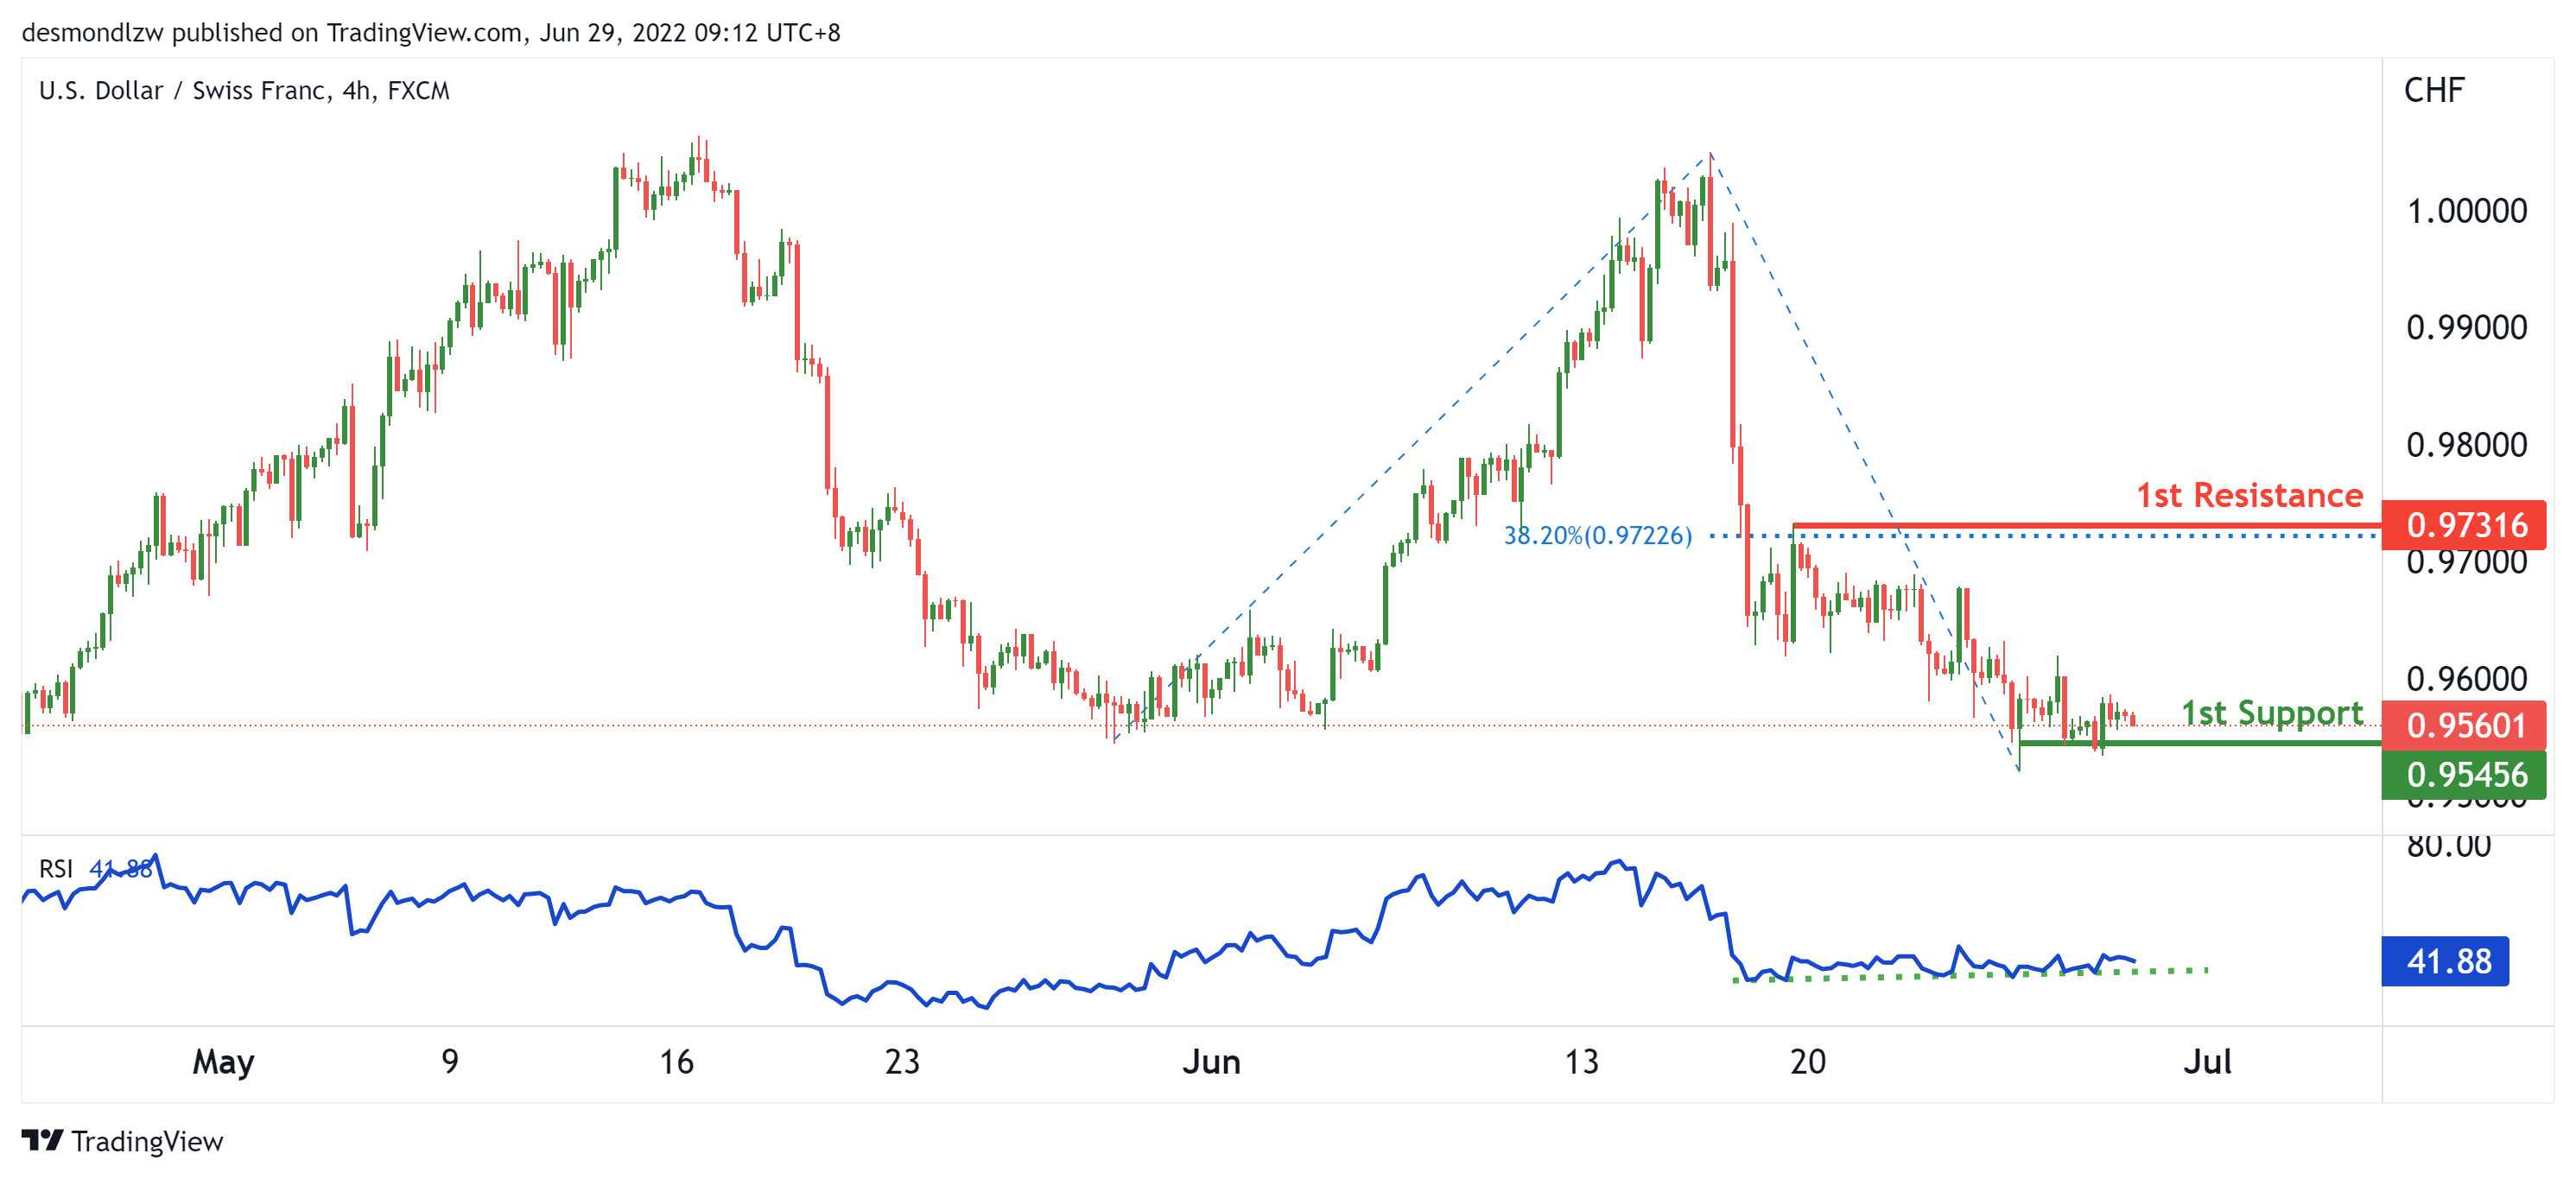
On the H4, with bullish divergence on the RSI, we have a bullish bias that price will rise from our 1st support at 0.95566 where the horizontal swing low support is to our 1st resistance at 0.97231 in line with the horizontal swing high resistance and 38.2% Fibonacci retracement. Alternatively, price may break structure and head for 2nd support at 0.94144 where the 127.2% Fibonacci extension is.
Areas of consideration
- 1st support level at 0.95566
- 1st resistance level at 0.97231
EUR/USD :
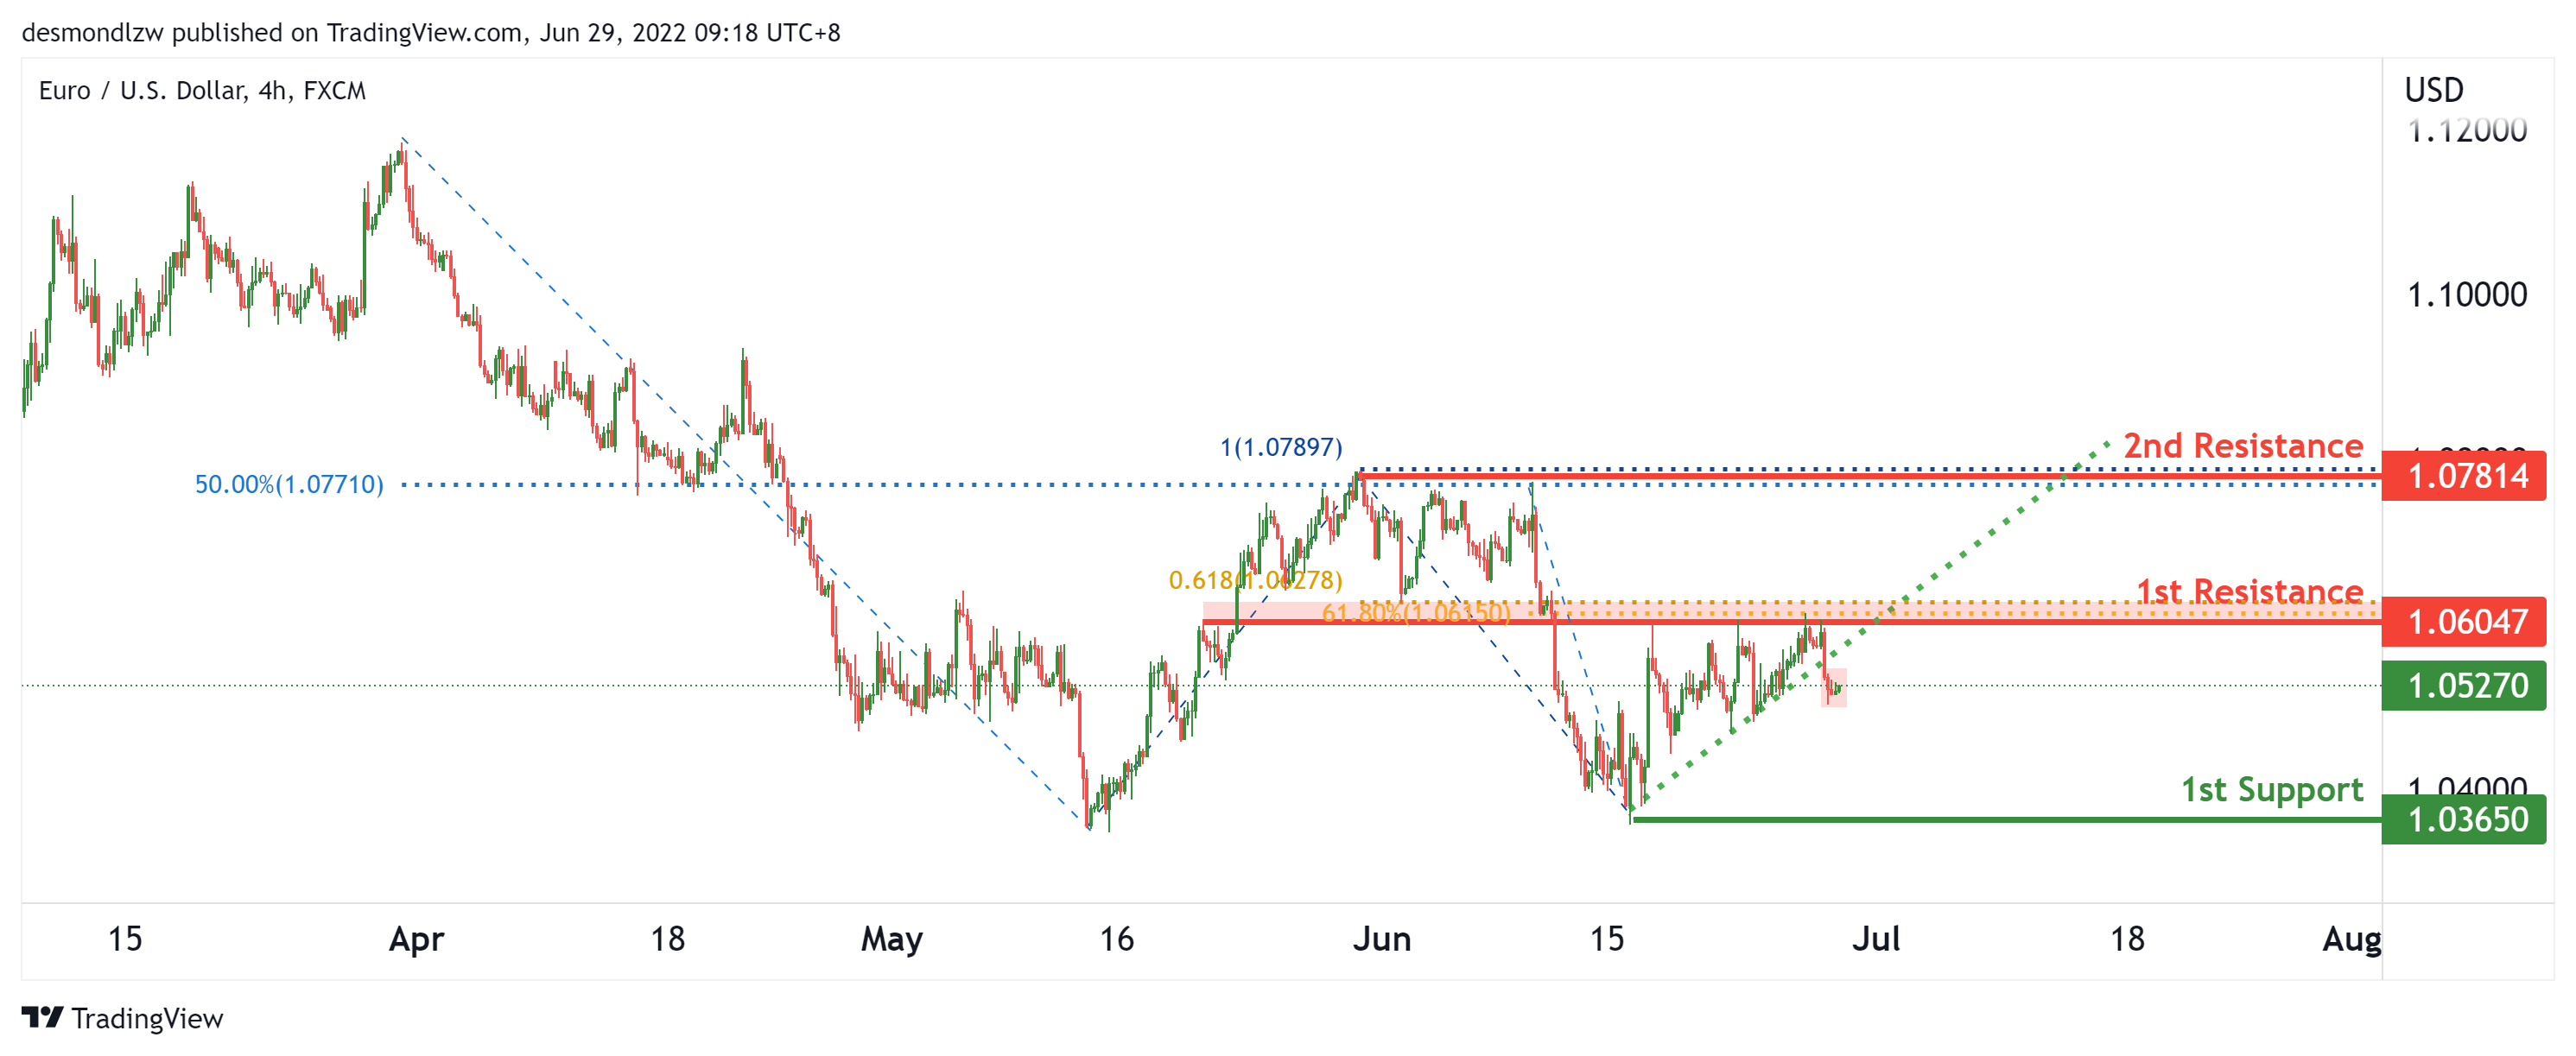
On H4, with price recently breaking the ascending trendline, we have a bearish bias that price will continue to drop from the 1st resistance at 1.06047 at the pullback resistance in line with the 61.8% fibonacci projection and 61.8% fibonacci retracement to the 1st support at 1.03541 in line with the multiple horizontal swing lows. Alternatively, price may reverse off the 1st resistance and rise to the 2nd resistance at 1.07814 at the horizontal swing high in line with the 50% fibonacci retracement and 100% Fibonacci projection.
Areas of consideration :
- H4 1st resistance at 1.06047
- H4 1st support at 1.03541
USD/JPY:
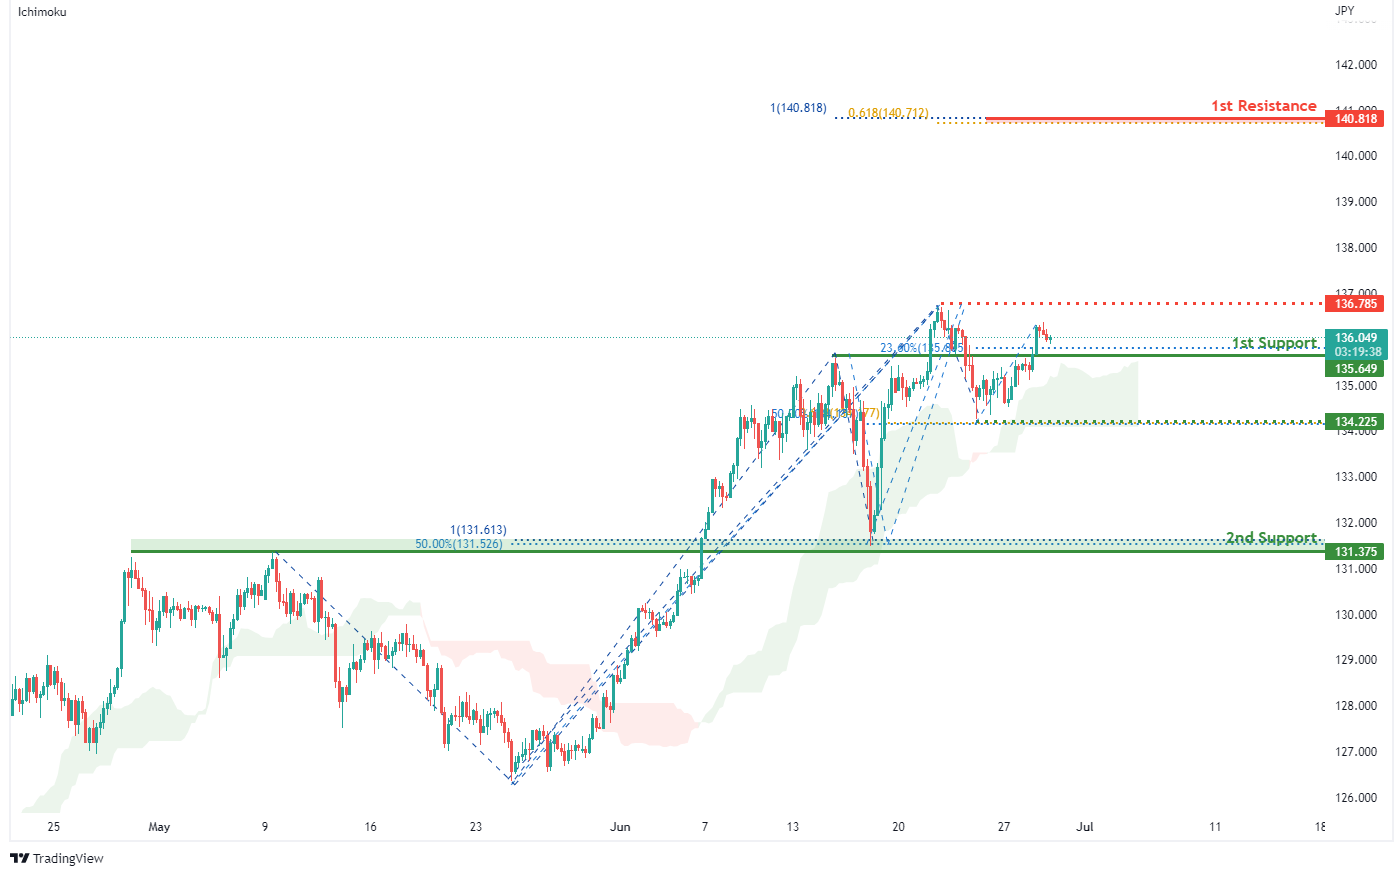
On the H4, with price moving above the ichimoku indicator, we have a bullish bias that price will drop and rise from our 1st support at 135.649 where the pullback resistance and 23.6% fibonacci retracement are to the intermediate resistance level at 136.785 where the swing high resistance is. Once there is upside confirmation, we would expect bullish momentum to carry price to our 1st resistance at 140.818 where the 100% fibonacci projection and 61.8% fibonacci projection are . Alternatively, price may break 1st support structure and drop to 2nd support at 131.375 in line with the swing low support, 100% fibonacci projection and 50% fibonacci retracement. Take note of the intermediate support at 134.225 in line with 50% fibonacci retracement and 61.8% fibonacci projection.
Areas of consideration:
- H4 time frame, 1st resistance at 140.818
- H4 time frame, 1st support at 135.649
AUD/USD:
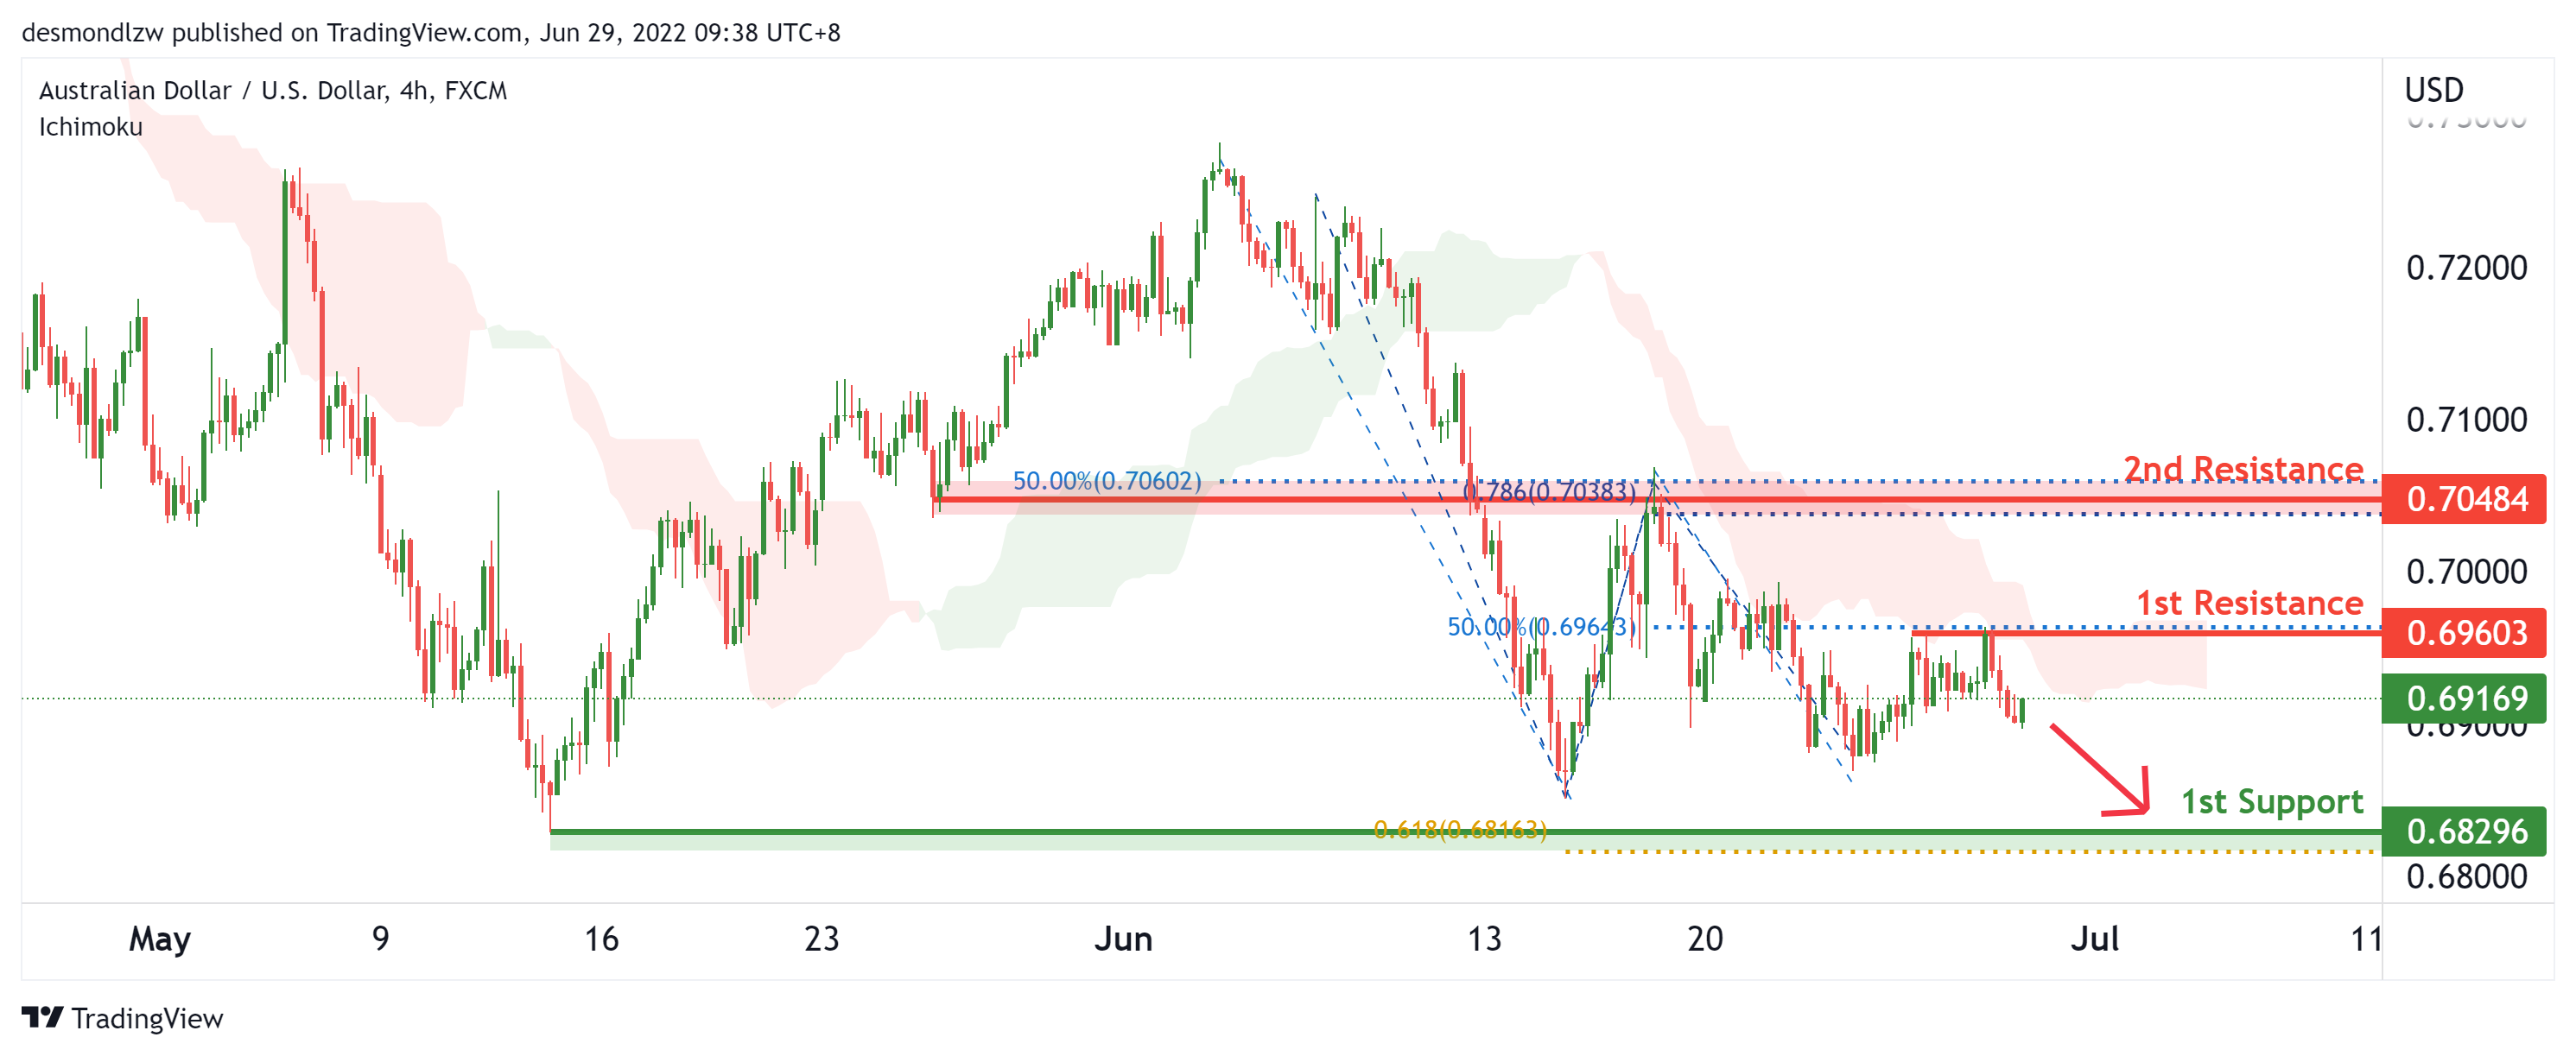
On the H4, with price moving below the ichimoku cloud , we have a bearish bias that price will continue to drop from the 1st resistance at 0.69303 in line with the 50% fibonacci retracement to the 1st support at 0.68296 in line with the horizontal swing low and 61.8% Fibonacci projection .Alternatively, price may reverse off the 1st resistance and rise to the 2nd resistance at 0.70484 in line with the overlap resistance, 78.6% Fibonacci projection and 50% Fibonacci retracement .
Areas of consideration
- H4 1st resistance at 0.68296
- H4 1st support at 0.69303
NZD/USD:
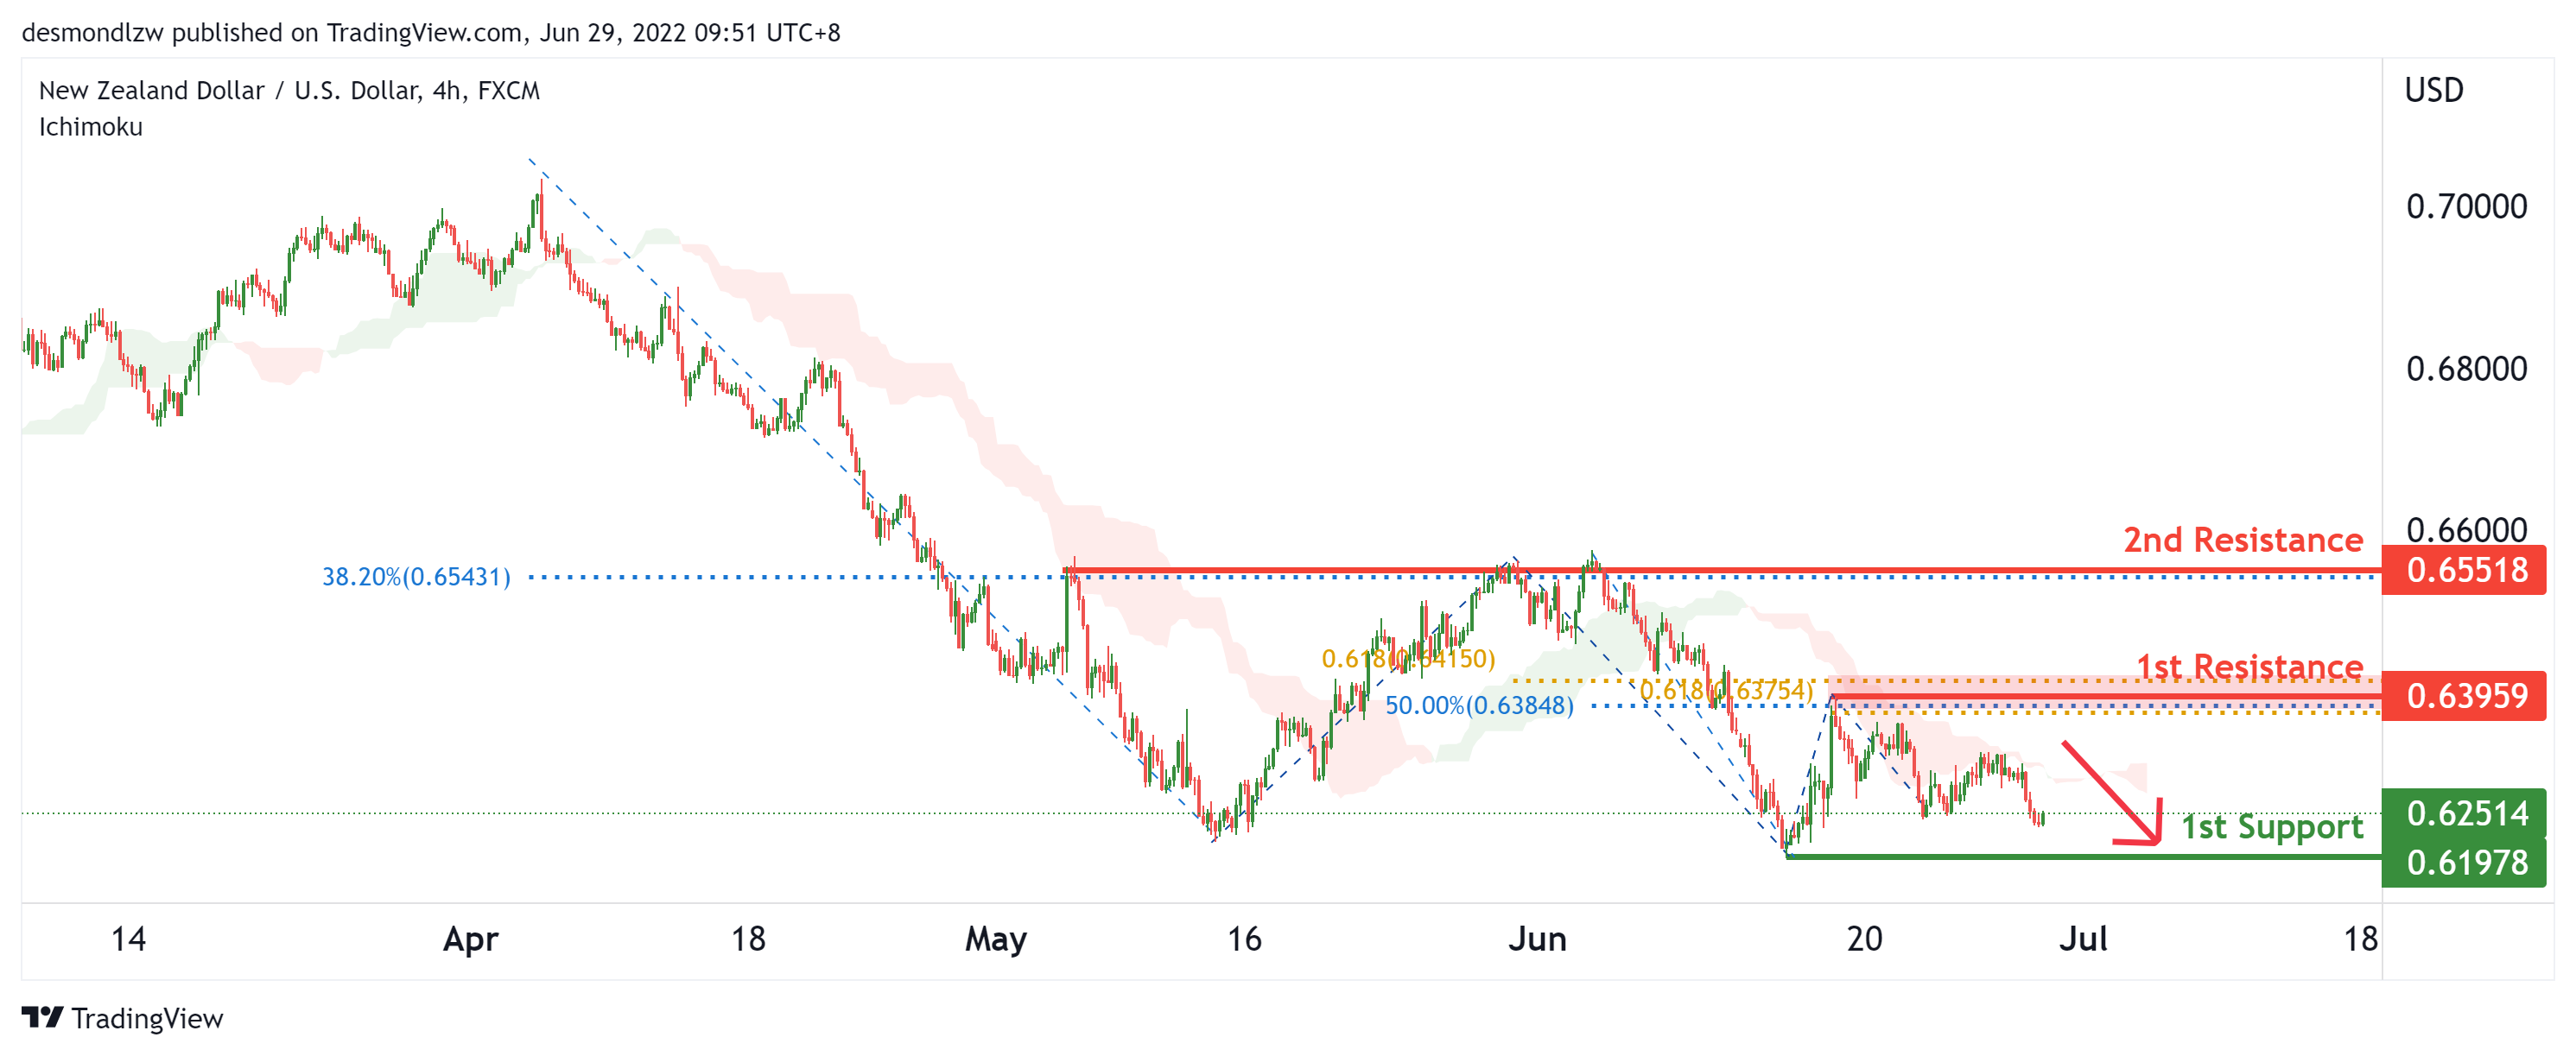
On the H4, with price moving below the ichimoku cloud , we have a bearish bias that price will continue to drop from the 1st resistance at 0.63959 in line with the two 61.8% fibonacci projections and 50% fibonacci retracement to the 1st support 0.61978 in line with the swing low. Alternatively, price may reverse off the 1st resistance and rise to the 2nd resistance at 0.65518 at the multiple swing highs and 38.2% fibonacci retracement.
Areas of consideration:
- H4 time frame, 1st support at 0.61978
- H4 time frame, 1st resistance at 0.63959
USD/CAD:
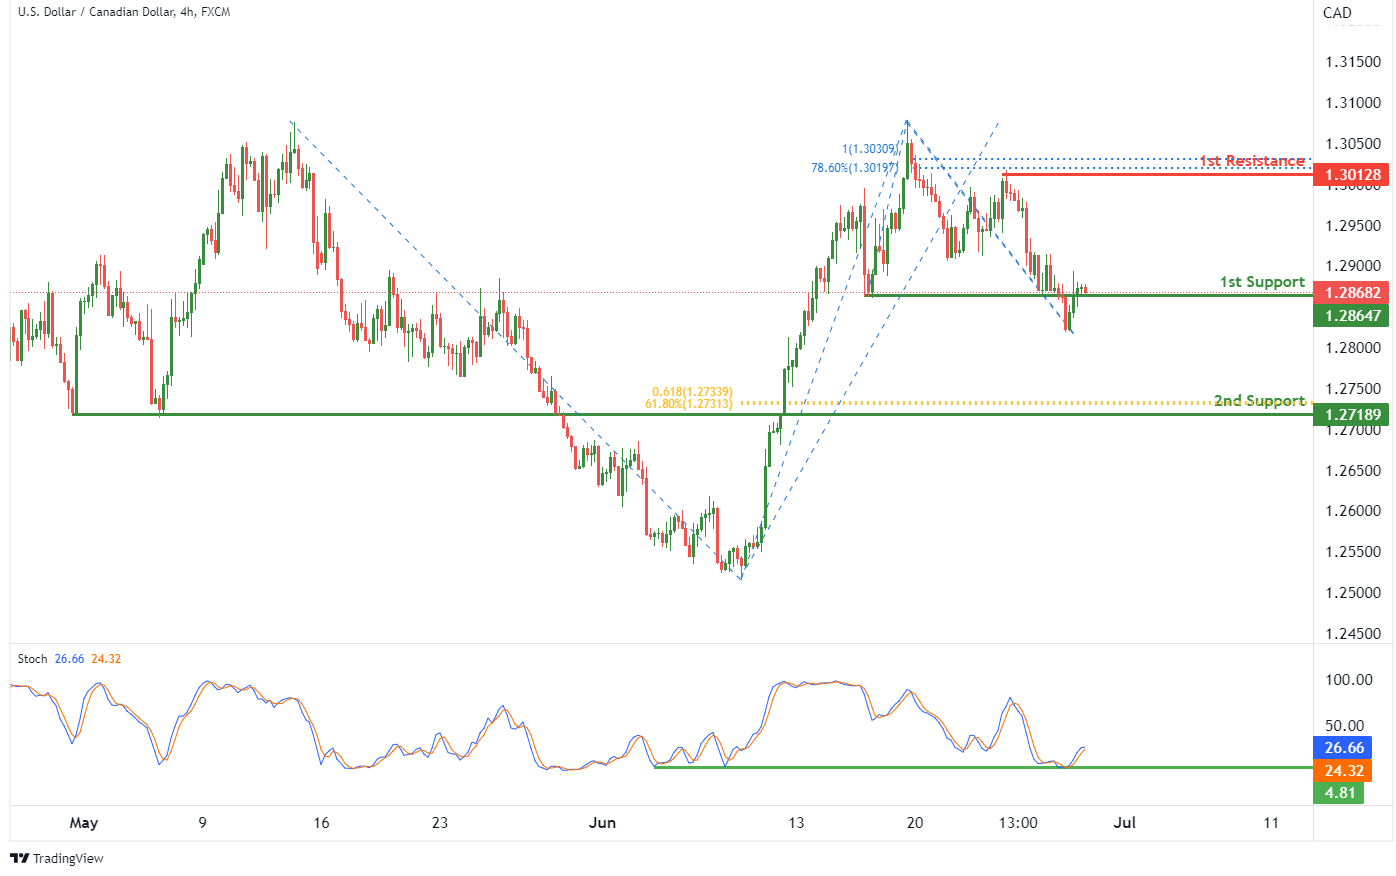
On the H4, with price bouncing off the stochastic support, we have a bullish bias that price will rise from our 1st support at 1.28647 where the horizontal pullback support is to our 1st resistance at 1.30128 in line with the horizontal swing high resistance, 100% fibonacci projection and 78.6% fibonacci retracement. Alternatively, price may break 1st support structure and head for 2nd support at 1.27189 where the horizontal overlap support, 61.8% fibonacci projection and 61.8% Fibonacci retracement are.
Areas of consideration:
- H4 time frame, 1st resistance at 1.30128
- H4 time frame, 1st support at 1.28647
OIL:
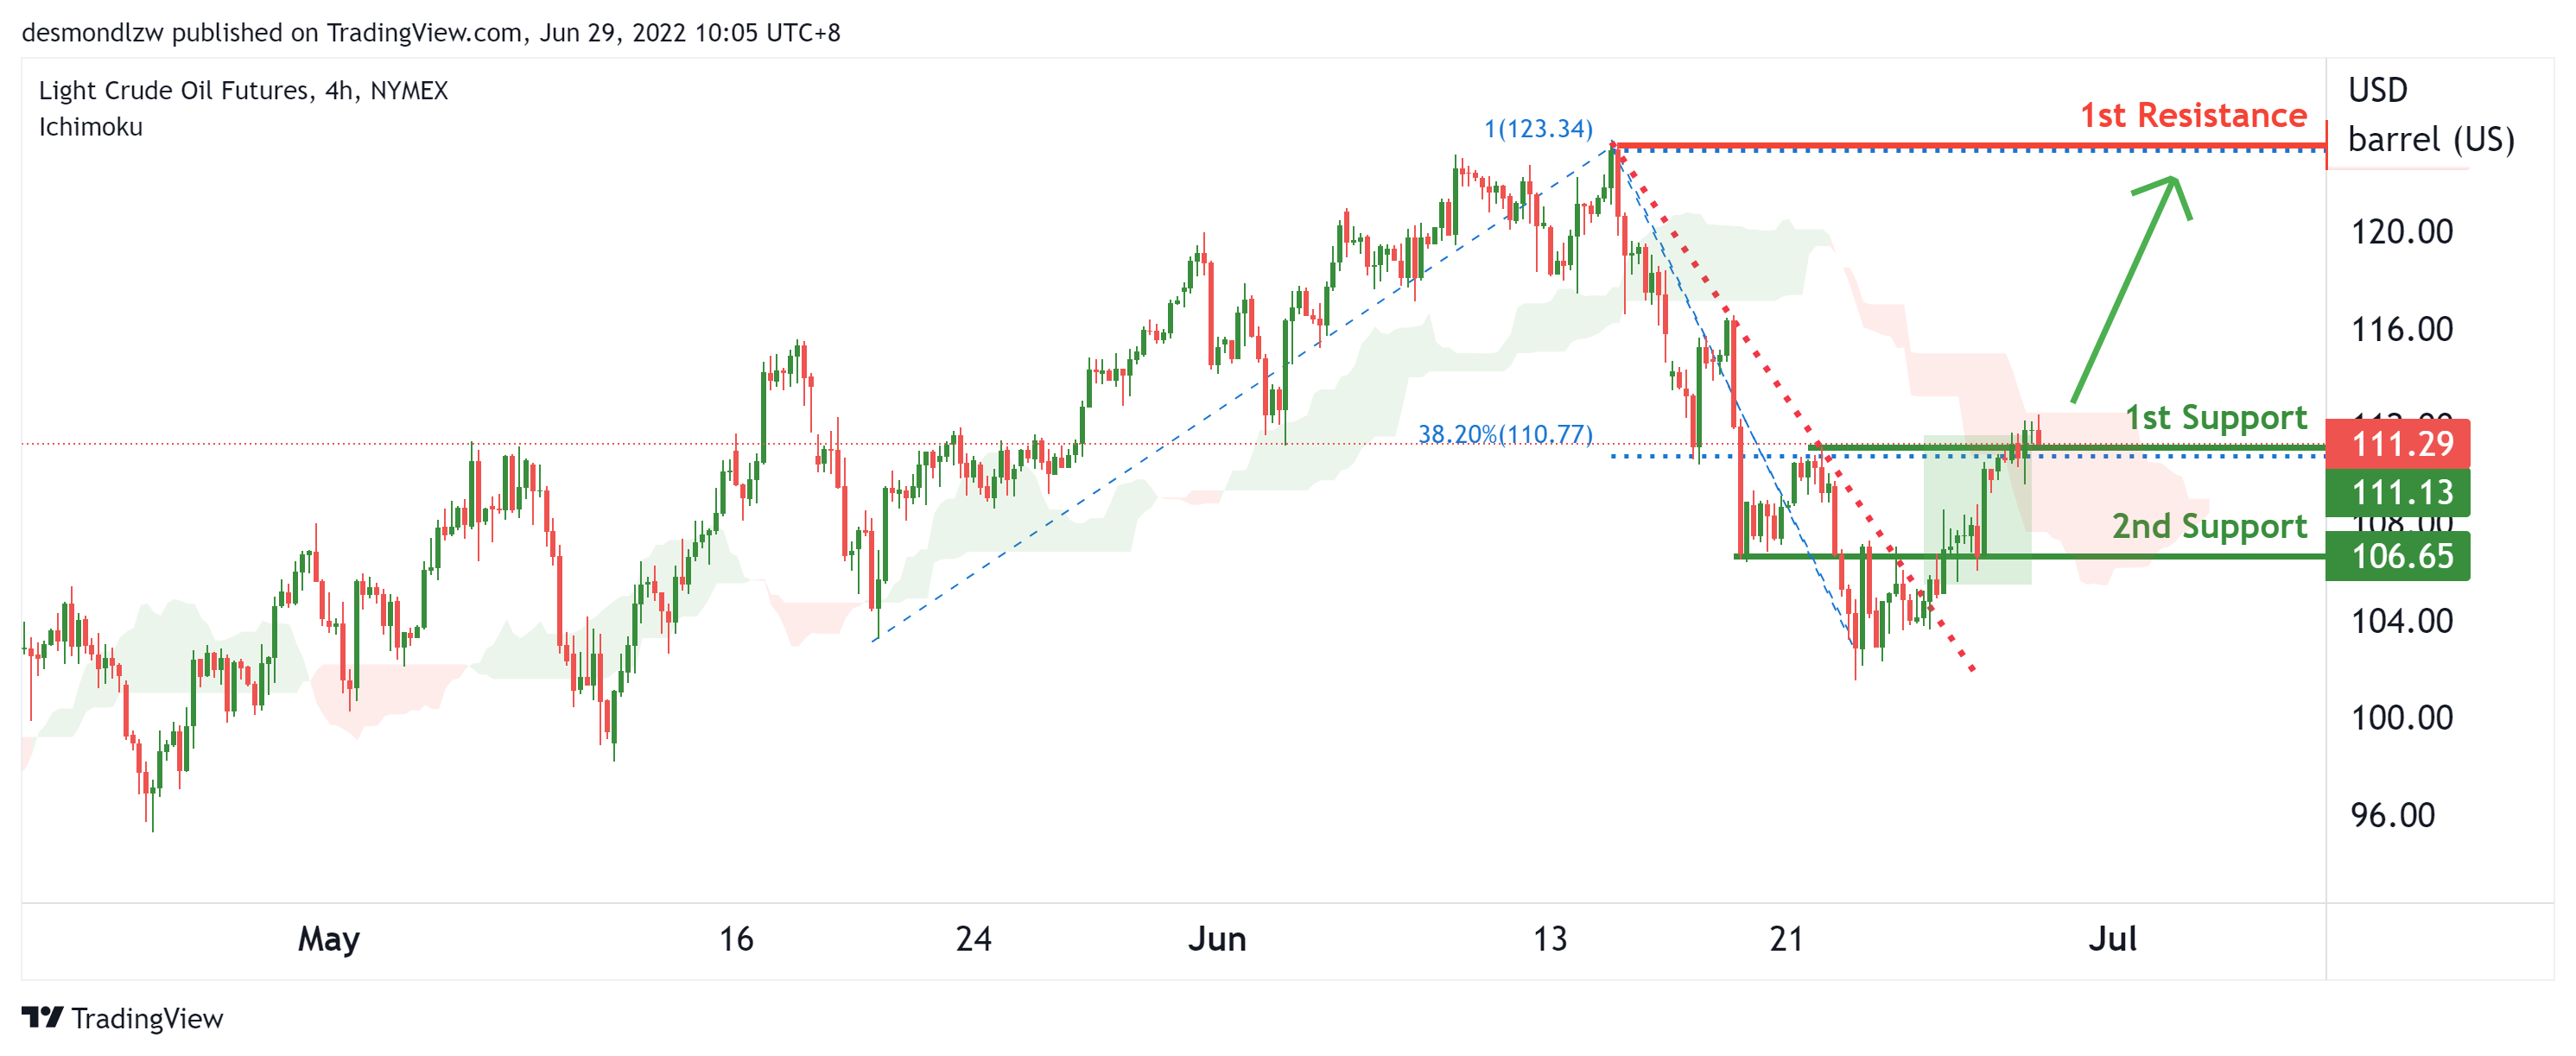
On the H4, with price bouncing off the ichimoku cloud, we have a bullish bias that price will continue to rise from the 1st support at 110.86 in line with the pullback support and 38.2% Fibonacci retracement to the 1st resistance at 123.56 at the horizontal swing high in line with the 78.6% Fibonacci projection. Alternatively, price may reverse off the 1st support and drop to the 2nd support at 106.65 in line with the pullback support and 100% Fibonacci projection.
Areas of consideration:
- H4 time frame, 1st resistance of 123.56
- H4 time frame, 1st support of 110.86
Dow Jones Industrial Average:
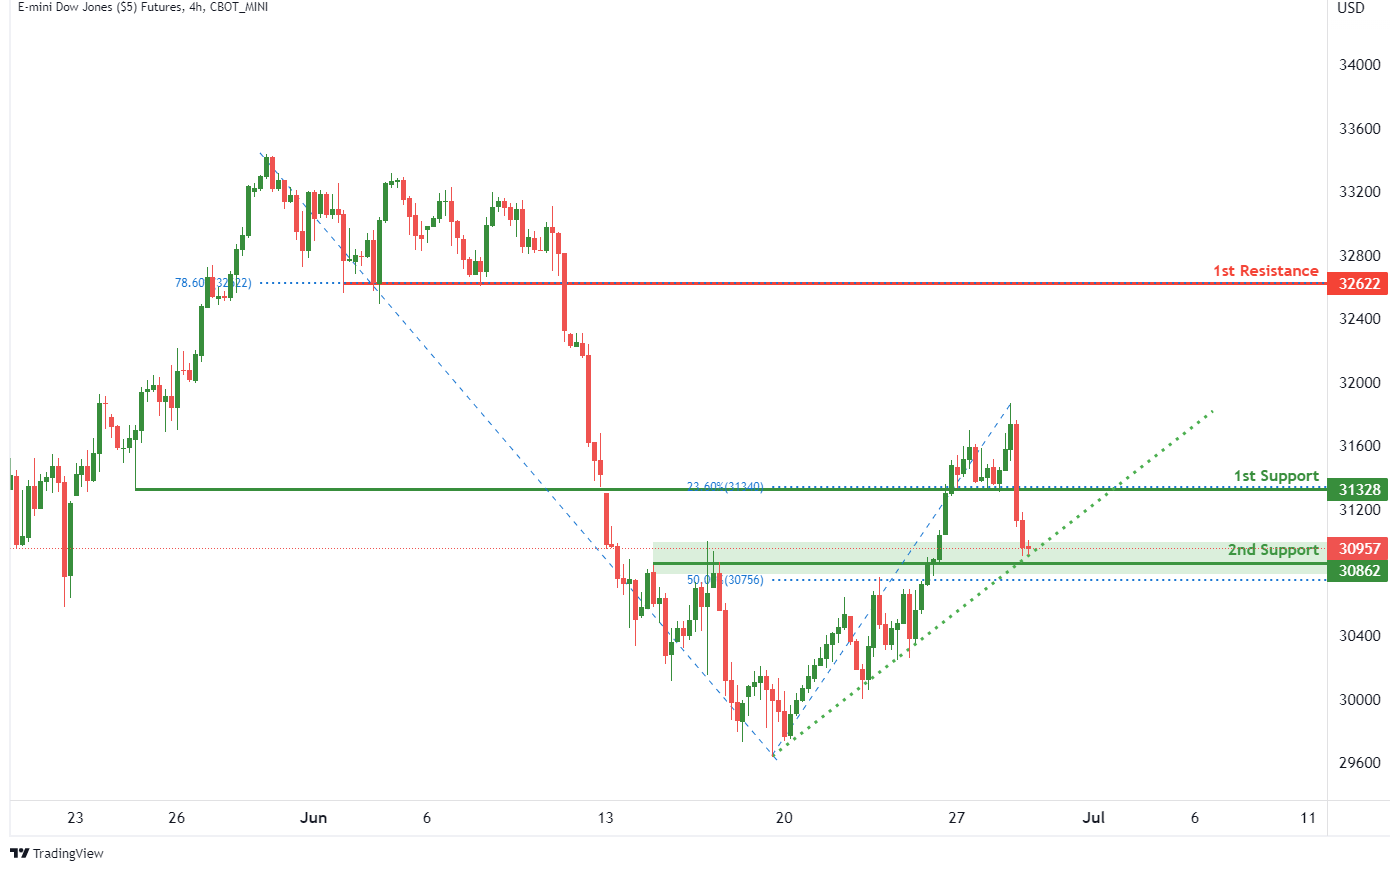
On the H4, with price moving along an ascending trendline, we have a bullish bias that price will rise from our 1st support at 31328 where the horizontal pullback support and 23.6% Fibonacci retracement are to our 1st resistance at 32622 in line with the horizontal overlap resistance and 78.6% fibonacci retracement. Alternatively, price may break 1st support and head for 2nd support at 30862 where the horizontal overlap support and 50% fibonacci retracement are.
Areas of consideration:
- H4 time frame, 1st resistance of 32622
- H4 time frame, 1st support of 31328
AUDNZD Wave Analysis
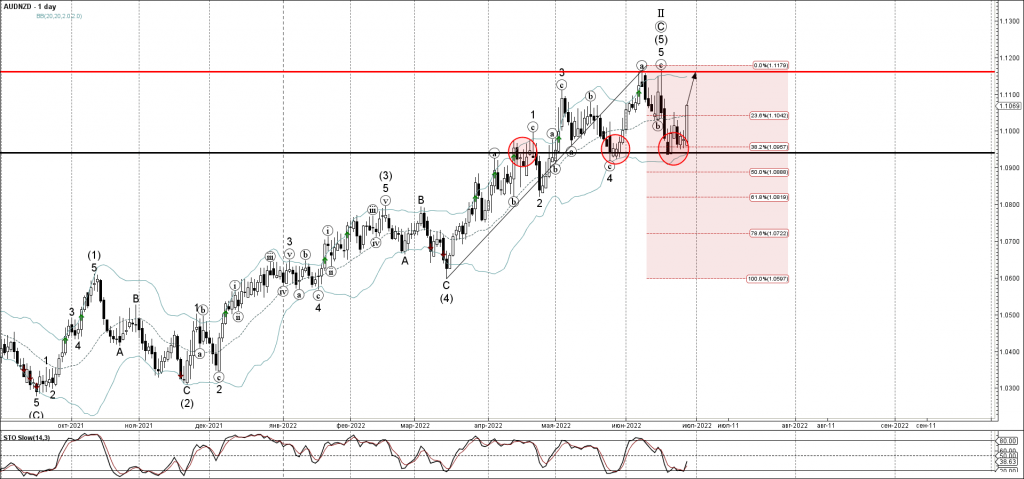
- AUDNZD reversed from support area
- Likely to rise to resistance level 1.116
AUDNZD currency pair recently reversed up from the support area located between the key support level 1.0940 (which has been reversing the pair from May), the lower daily Bollinger Band and the 38.2% Fibonacci correction of the upward impulse from March.
The upward reversal from this support area continues the active multi-month uptrend from last September.
Given the strongly bearish NZD sentiment, AUDNZD can be expected to rise further toward the next resistance level 1.116 (which stopped the earlier upward waves (a) and (c)).
GBPCAD Wave Analysis
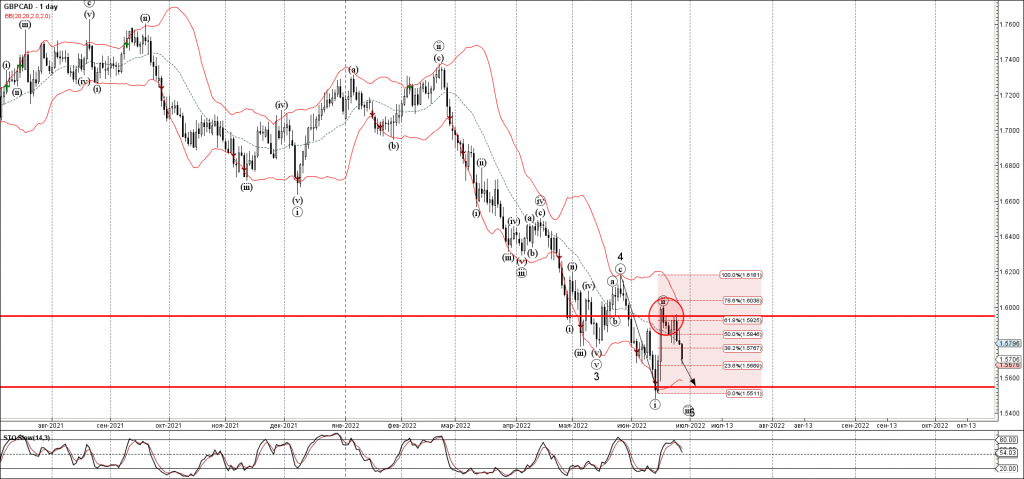
- GBPCAD falling inside impulse wave (iii)
- Likely to fall to support level 1.5550
GBPCAD continues to fall inside the short-term downward impulse wave (iii), which started recently from the resistance area located between the resistance level 1.5950, upper daily Bollinger Band and the 61.8% Fibonacci correction of the downward impulse (i) from May.
The downward reversal from this resistance area started the active minor impulse wave (iii).
Given the strong daily downtrend, GBPCAD can be expected to fall further toward the next support level 1.5550 (which stopped the earlier sharp downward impulse wave (i)).
Fed Williams: It’s a slowdown that we need, not a recession
New York Fed President John Williams told CNBC today, "A recession is not my base case right now. I think the economy is strong. Clearly financial conditions have tightened and I'm expecting growth to slow this year quite a bit relative to what we had last year."
"But that's not a recession," he noted. "It's a slowdown that we need to see in the economy to really reduce the inflationary pressures that we have and bring inflation down."
On interest rate, Williams said, "we're far from where we need to be". Rate can rise from current 1.50-1.75% to 3-3.5%. "My own baseline projection is we do need to get into somewhat restrictive territory next year given the high inflation, the need to bring inflation down and really to achieve our goals," he said. "But that projection is about a year from now. Of course, we need to be data dependent."
Sunset Market Commentary
Markets
Recent underperformance of EMU bond/interest rate markets versus the US continues. European investors kept a close eye at comments and speeches at the ECB forum in Sintra. Before and at the June 9 policy meeting, the ECB already provided quite a detailed roadmap signalling a 25 bps rate lift-off in July and (several) >25 bps steps later this year if inflation doesn’t substantially improve by then. If the consensus on Friday’s CPI release (0.7% M/M, 8.5% Y/Y) comes true, this improvement won’t materialize anytime soon. In this respect, ECB’s Lagarde reiterated the benefits of gradualism, but at the same time highlighted ‘the option to act decisively on any deterioration in medium-term inflation, especially if there are signs of a de-anchoring of inflation expectations’. Latvian ECB member Kazaks even defended the merits of frontloading a bigger rate hike already at the July meeting, but there are few signs that his view has a majority within the MPC. President Lagarde and other governors also elaborated on steps to avoid fragmentation of policy across countries. This now even is considered a necessary condition to be able to raise rates enough to address elevated inflation. A first line of defense with flexible reinvestments of proceeds from maturing bonds of the PEPP portfolio, will start as soon as July 1. On the new tool that is in the making to handle unwarranted spread widening, the ECB president said:’ The new instrument will have to be effective, while being proportionate and containing sufficient safeguards to preserve the impetus of Member States towards a sound fiscal policy’. So, some, albeit soft, conditionality will apparently be included. Some ECB members also aired the idea to sterilize the liquidity created via the new tool. The news from Sintra shouldn’t come as a big surprise for markets. Still, the idea that the new ECB toolkit makes it easier to raise rates without market fragmentation might fuel expectations for more bold ECB action if the inflation outlook worsens further. German yields are rising between 5.5 bps (2-y) and 8.5 bps (10-y). The sharp rise in the 5-y yield (+14 bps) is partially due to a benchmark change. The bottoming in EMU yields after last week’s correction clearly is taking shape. The narrowing of intra-EMU spreads versus Germany also continues (10-y Greece -7 bps, Italy -4 bps). Moves in the US bond market were again much more modest with the 2-y yield little changed while yields for longer maturities rose about 2 bps. European equites are extending a cautious rebound (Eurostoxx + 0.75%/1.0%), but the LT picture remains fragile. US equities show similar gains after the open. Oil also gains further ground (brent $ 117/b).
On FX markets, the forint rebounded to EUR/HUF 398.75 after the MNB unexpectedly raised the its policy bas rate by 185 bps to 7.75%. It will bring the 1 week deposit rate to the same level at its next week weekly tender. EUR/USD tried to regain the 1.06 handle this morning. However, additional interest rate support failed to trigger a break higher. Profit taking even brings EUR/USD back to the 1.0540 area. EUR/GBP also trades off the intraday peak levels, but is little changed in a daily perspective (0.862). USD/JPY (136.15) again near the multi-year top.
News Headlines
Polish Monetary Policy Council member Kotecki argued in favour of a rate hike of at least 100 bps at its July 7 policy meeting as he expects another sharp rise in inflation in early 2023 due to higher electricity and gas prices. Kotecki in amongst the more hawkish members on the board with governor Glapinski earlier hinting that the tightening cycle might be drawing to an end. Polish inflation numbers are on due on Friday and expected to rise by 1.5% M/M and 15.5% Y/Y. The National Bank of Poland this year applied monthly 75 bps rate hikes from March with even an 100 bps rate move in April. The base rate currently stands at 6%. Accelerating inflation and more drastic June action by the CNB (+125 bps to 6%) and MNB today (+185 bp to 7.75%) suggest that risks are clearly tilted to more aggressive action. Polish money markets discount a policy rate in excess of 8% by the end of the year and peaking at 8.5% by mid next year. The Polish zloty could use the additional support. At EUR/PLN 4.7, it remains in the danger zone of slipping back to weakest levels on record. The NBP holds a view that a strong(er) currency should be part of the equation in the current market setting (high inflation & aggressive tightening cycle)...
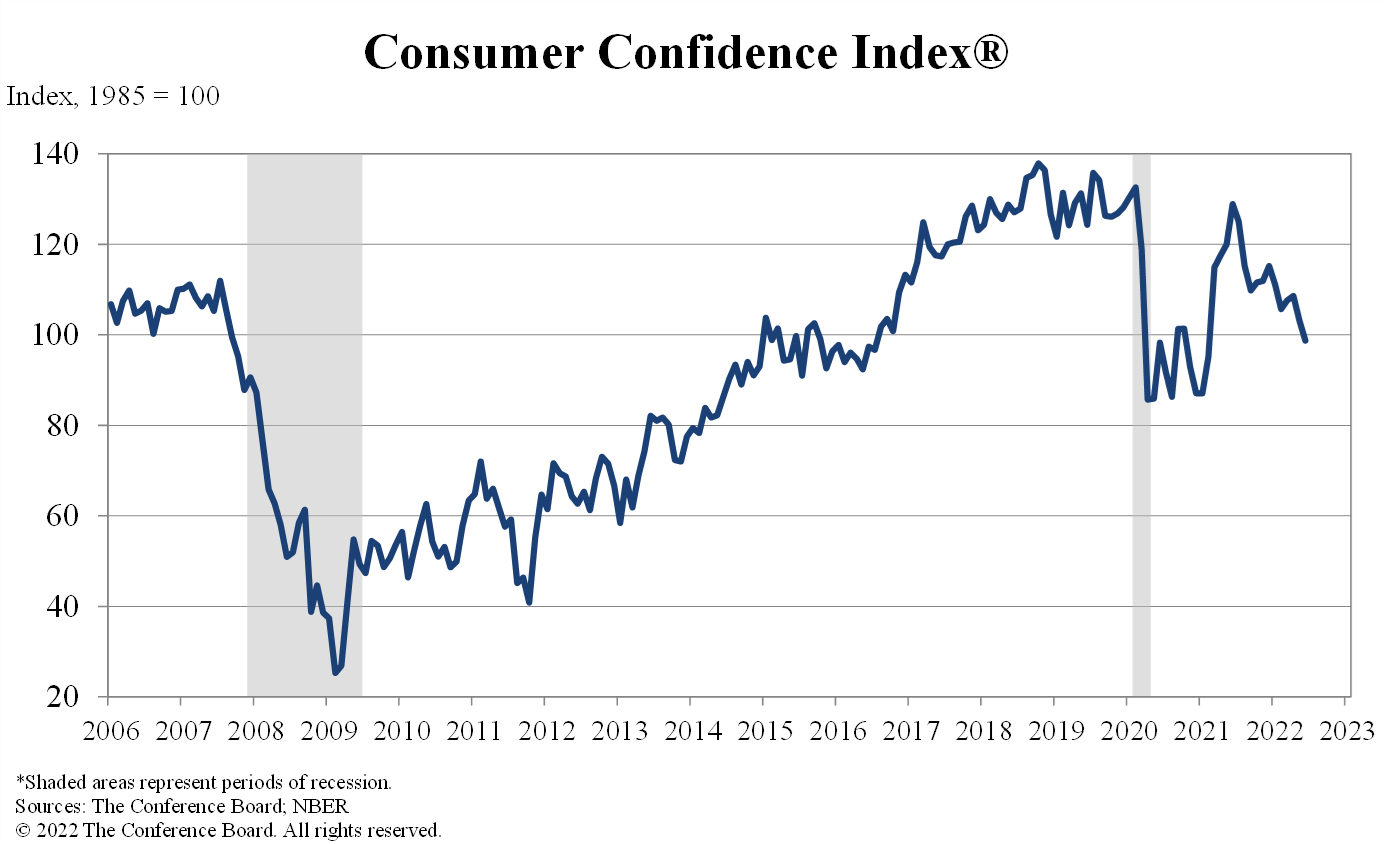
US consumer confidence dropped to 98.7 Jun, expectations tumbled to lowest since 2013
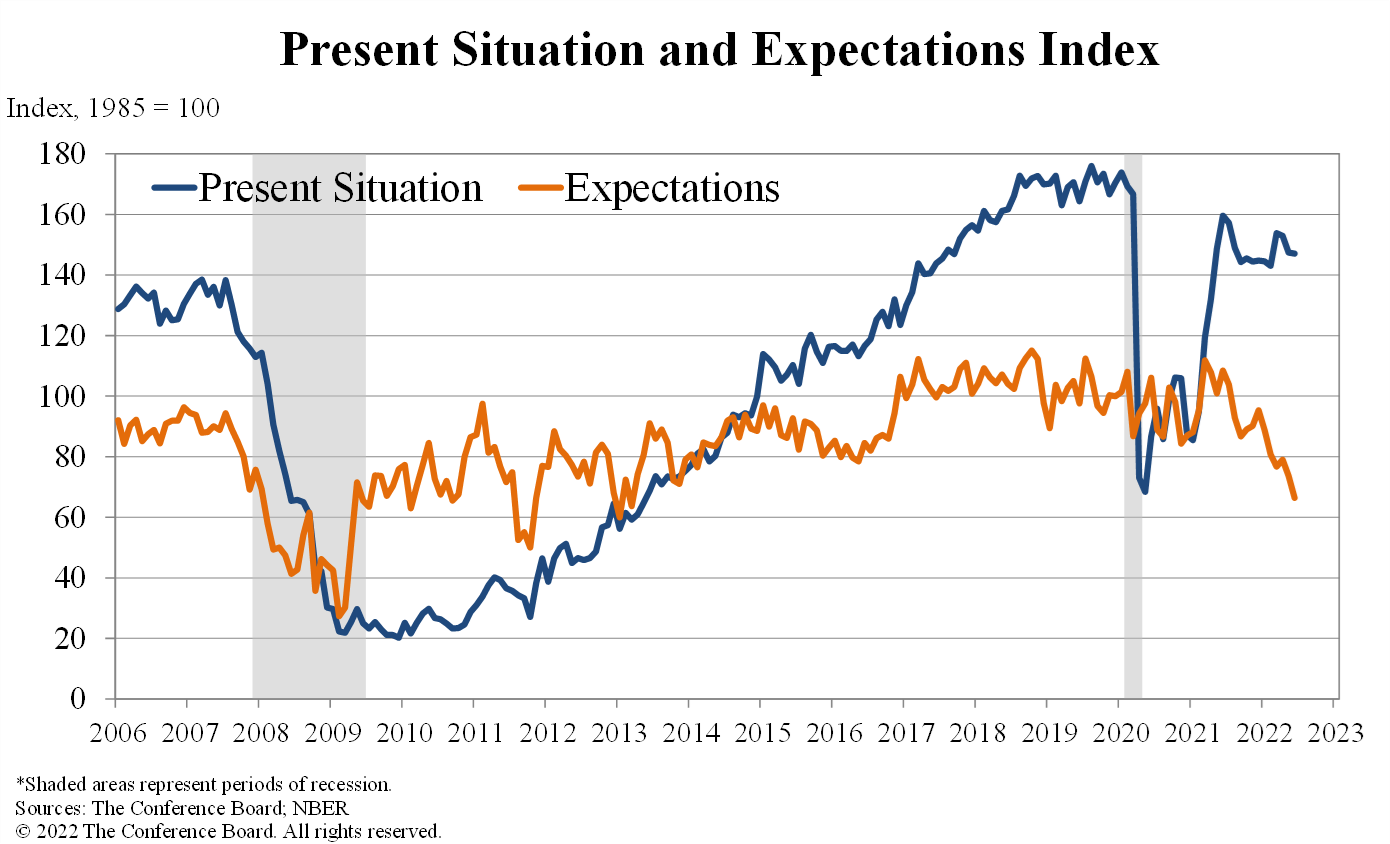
US Conference Board Consumer Confidence Index dropped from 103.2 to 98.7 in June, below expectation of 100. That's also the lowest level since February 2021 (95.2). Present Situation Index dropped slightly from 147.4 to 147.1. But Expectations Index dropped sharply from 73.7 to 66.3, lowest since March 2013.
Lynn Franco, Senior Director of Economic Indicators at The Conference Board: "Consumers' grimmer outlook was driven by increasing concerns about inflation, in particular rising gas and food prices. Expectations have now fallen well below a reading of 80, suggesting weaker growth in the second half of 2022 as well as growing risk of recession by year-end."
Bitcoin Exhibits Weakness But Holds above the 20,000 Mark
Bitcoin and other major altcoins have merely bounced back and remain comfortably above their recent lows on signs that inflation in the US is indeed cooling and the Fed might be able to scale down its monetary tightening later in the year. However, cryptocurrencies have started the week on the wrong foot as idiosyncratic risks stemming from within the crypto industry alongside the broader unfavorable macroeconomic conditions for risky assets continue to weigh on digital coins. The latest rangebound pattern observed in most cryptocurrencies is probably hinting that investors are scrutinizing the current complex market conditions and await significant macroeconomic developments to determine the direction of the next breakout.
Bitcoin’s fortunes closely aligned with stocks
The major US indices witnessed a sharp comeback last week, with the Nasdaq 100 gaining 7.5%, while the S&P 500 was up about 6.5% for the week, experiencing its biggest single-day gain in two years on Friday. This relief rally was attributed to the University of Michigan’s monthly consumer sentiment index (CSI), which was revised lower.
Cryptocurrency prices quickly caught up with the stock market’s advance, demonstrating once more the increasing correlation between cryptos and equities and shattering the idea that digital assets can act as inflation hedging tools.
Systemic risks keep popping up
Bitcoin’s year-to-date decline has come in tandem with the stock market's downfall, which has been triggered by fears over global inflation and growth outlooks. Nevertheless, the former was exacerbated by regulatory woes, idiosyncratic risks of the digital asset universe and operational crackdowns among crypto financial service providers. On Friday, hackers stole the equivalent of $100 million in crypto assets from Harmony, a California-based cryptocurrency firm. After this latest theft, a blockchain analytics firm called Elliptic estimates that over $1 billion have been stolen so far in 2022.
Additionally, the Australian crypto exchange Banxa announced that it plans to cut over 70 jobs in anticipation of a steep market downturn, joining the gang of crypto firms that have already started reducing their headcount such as Coinbase, Crypto.com, Gemini and BlockFi. To make matters worse, numerous crypto companies are slashing their marketing and advertising budgets, even though the need to regain investors’ confidence in blockchain technology is more essential than ever.
Mining activity remains a catalyst
At the current price levels, crypto mining is not attractive, and miners have started offloading their holdings on exchanges to cover rising costs in anticipation of lower prices. According to a Reuters report, the number of miners selling coins to crypto exchanges has been steadily climbing since June 7, which combined with the increasing liquidation of leveraged positions has accelerated the latest sell-off.
Furthermore, the amount of electricity consumed by the largest cryptocurrency networks has fallen by nearly 50% according to Digiconomist’s estimates as the crypto winter continues to erode miners' income and financial contagion spreads further throughout the sector. On the one hand, less supply could boost prices, but investors watching miners go out of business could also harm their sentiment toward cryptos’ growth prospects.
Technical picture remains worrisome
Although Bitcoin's price managed to recover from its fresh 18-month low of 17,588, it remains below the 200-week simple moving average (SMA), which is essentially the bottom of all its previous bear market cycles.
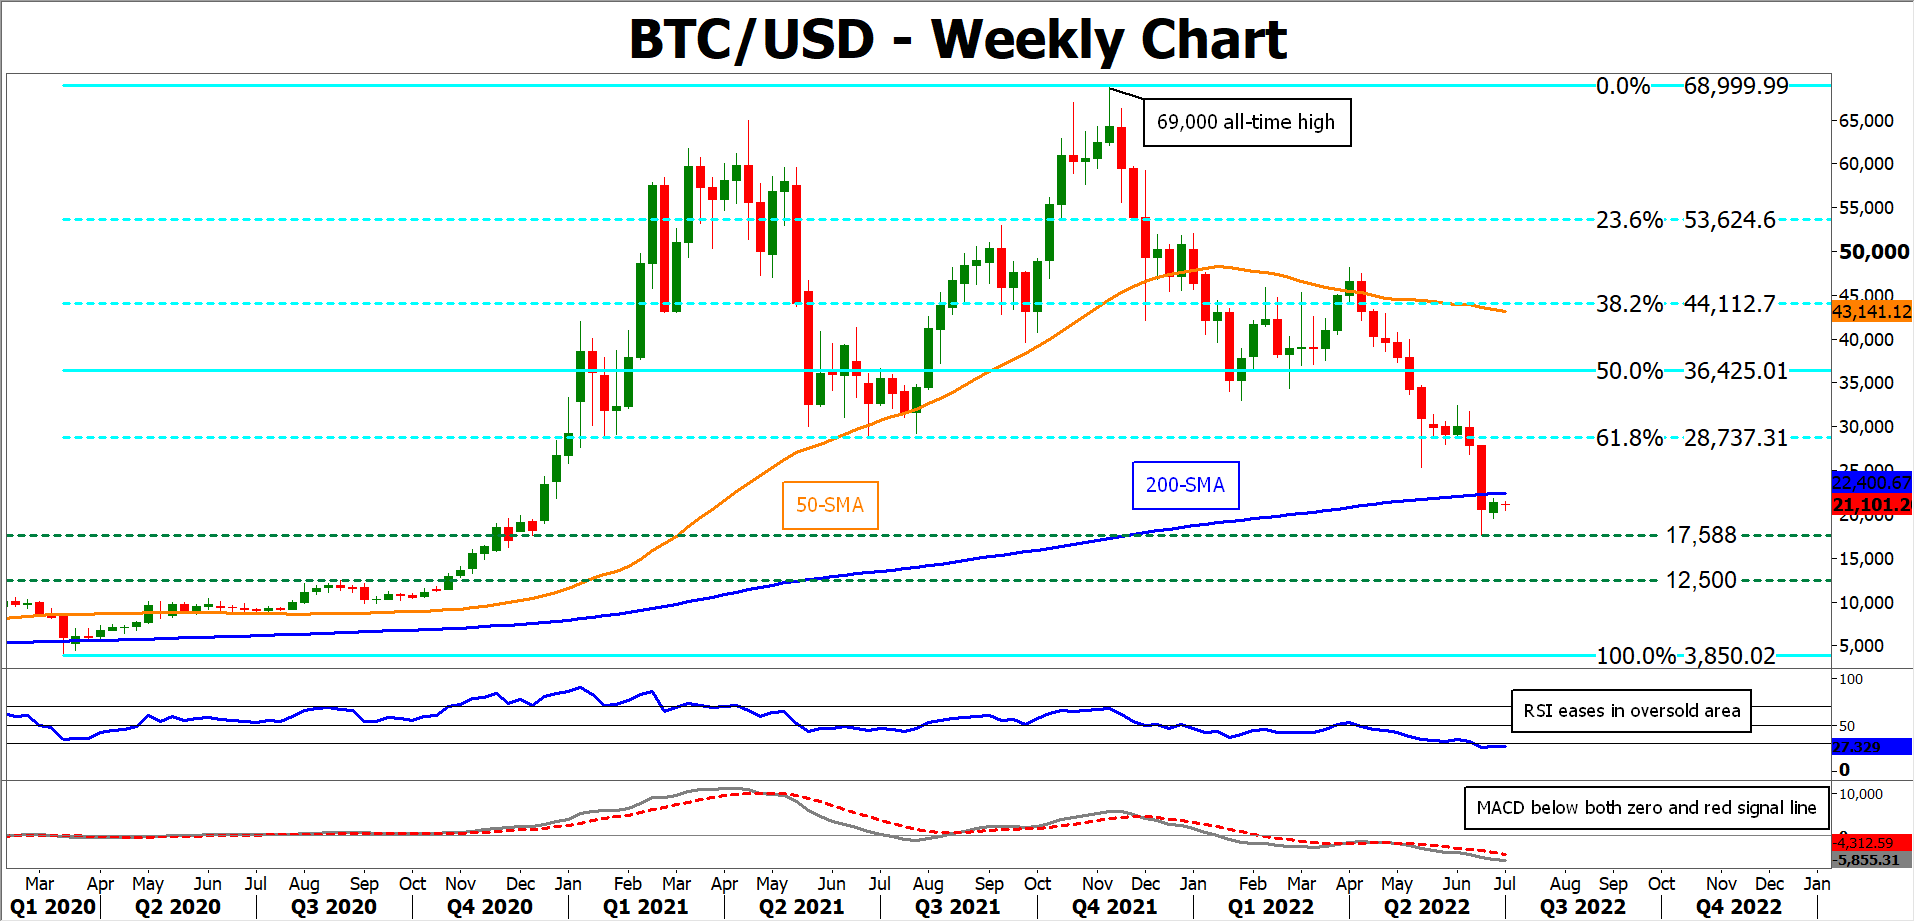
Should selling pressure intensify, the 2022 low of $17,588 may act as the first line of defense. Failing to halt there, the price would descend to form fresh multi-year lows and the next crucial barrier could be found at the August 2020 resistance of $12,500.
To the upside, bullish actions might encounter initial resistance at the 200-week SMA, currently at $22,400. An upside violation of the latter may open the door for the $28,737 level, which is the 61.8% Fibonacci retracement of the 3,850-68,999 upleg.
AUD/USD: Aussie Remains Capped by 10DMA, Keeping Bearish Bias
The Aussie dollar eases from one-week high on Tuesday after failing to benefit more from positive news that China slashed Covid quarantine for international travelers.
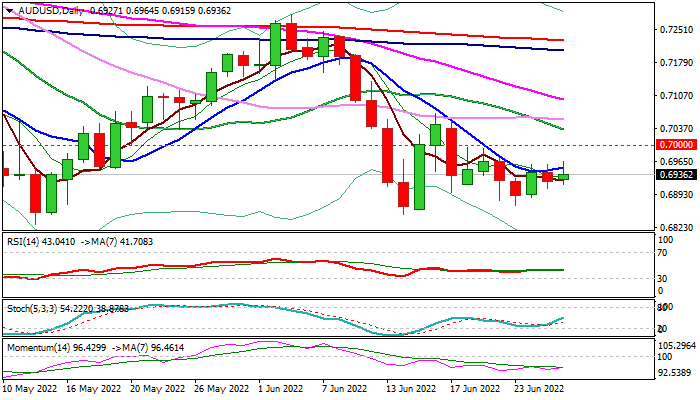
The price action fell back below 10DMA (0.6951) which caps the price since June 9 and maintains negative bias, with repeated daily close below to add to fragile near-term structure.
Daily technical studies remain in full bearish setup and keep negative outlook for retest of key supports at 0.6850/28 (June 14 / May 12 lows).
The upside is expected to remain well protected by 10DMA and psychological 0.70 barriers.
Res: 0.6951; 0.7000; 0.7035; 0.7055
Sup: 0.6907; 0.6869; 0.6850; 0.6828