Sample Category Title
BCC: UK inflation to hit 10% in Q4, no GDP growth in Q2 & Q3 with contraction in Q4
In the new economic forecasts, British Chambers of Commerce projected that UK inflation rate will reach 10% in Q4 this year, "comfortably outpacing average earnings growth". That would be the highest since CPI records began in 1989. CPI is only expected to finally fall back to BoE's target of 2% by the end of 2024. BoE interest rate is expected to rise to 2% in 2022, and 3% in 2023.
GDP growth in 2022 was downgraded slightly from 3.6% to 3.5%. Quarter on quarter GDP growth is expected to " flatline with no growth expected in Q2 and Q3 before contracting by 0.2% in Q4". Growth is expected to slow sharply to just 0.6% for 2023, before recovering slightly to 1.2% in 2024.
Alex Veitch, Director of Policy at the British Chambers of Commerce, said: "Our latest forecast indicates that the headwinds facing the UK economy show little sign of reducing with continued inflationary pressures and sluggish growth. The war in Ukraine came just as the UK was beginning a Covid recovery; placing a further squeeze on business profitability."
IMF: Recent Yen depreciation reflect fundamentals
IMF Japan mission chief Ranil Salgado said Yen's recent movements "reflect fundamentals", adding, "we see both positive and negative effects in yen depreciation."
He noted that risks to inflation in Japan are on the upside. But, "inflation in the medium-term will remain well below the BOJ's target once the cost-push factors go away," he said.
"We consider it appropriate for the BOJ to maintain monetary easing until inflation is achieved in a stable and durable manner."
Technical Outlook and Review
DXY:
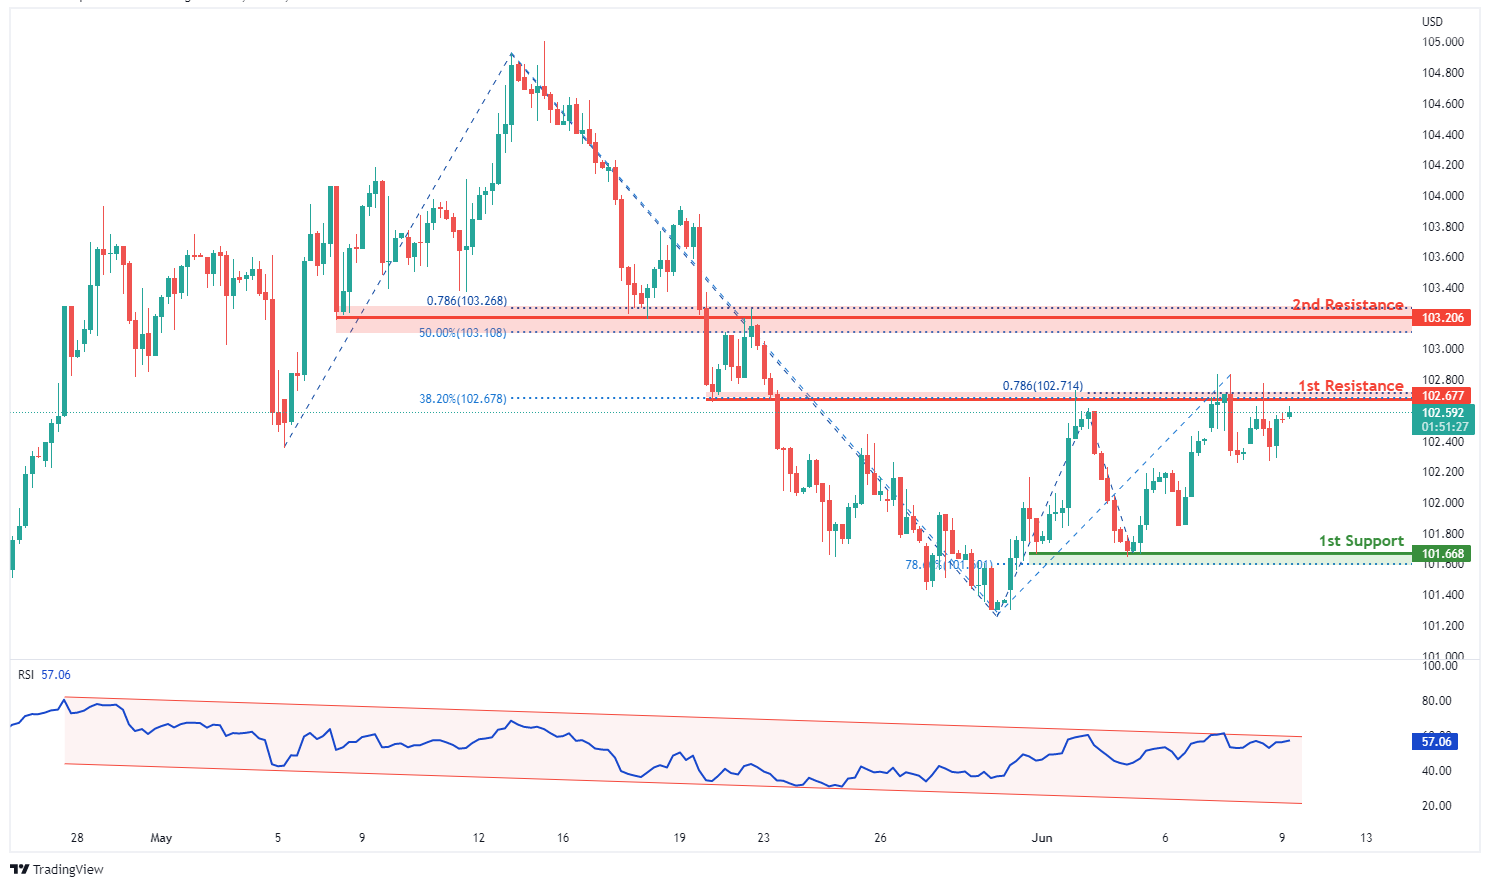
On the H4, with RSI moving in a descending channel, we have a bearish bias that price will drop to our 1st support at 101.668 where the horizontal swing low support and 78.6% fibonacci retracement are from our 1st resistance at 102.677 in line with the horizontal overlap resistance, 38.2% fibonacci retracement and 78.6% fibonacci projection. Alternatively, price may break 1st resistance structure and head for 2nd resistance at 103.206 where the horizontal overlap resistance, 78.6% fibonacci projection and 50% fibonacci retracement are.
Areas of consideration:
- H4 time frame, 1st resistance at 102.677
- H4 time frame, 1st support at 101.668
XAU/USD (GOLD):
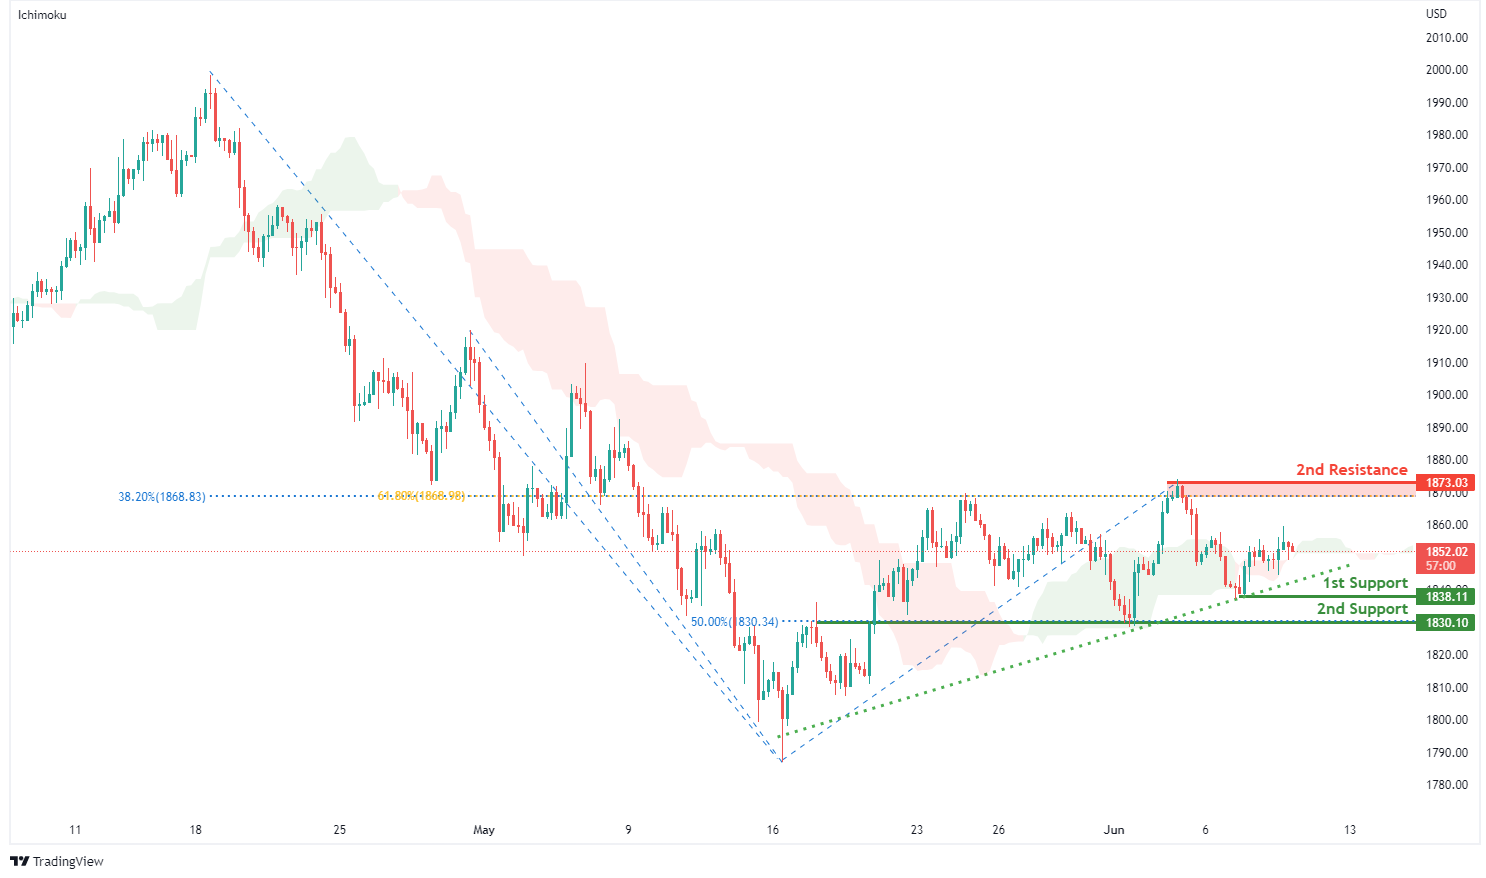
On the H4, with prices bouncing off ichimoku indicator, we have a bullish bias that price will rise from our 1st support at 1838.11 where the horizontal swing low support is to our 1st resistance at 1873.03 in line with swing high resistance, 61.8% fibonacci retracement and 38.2% fibonacci retracement. Alternatively, price may break 1st support structure and head for 2nd support at 1830.10 in line with overlap support and 50% fibonacci retracement.
Areas of consideration:
- H4 time frame, 1st Resistance at 1873.03
- H4 time frame, 1st Support at 1838.11
GBP/USD:
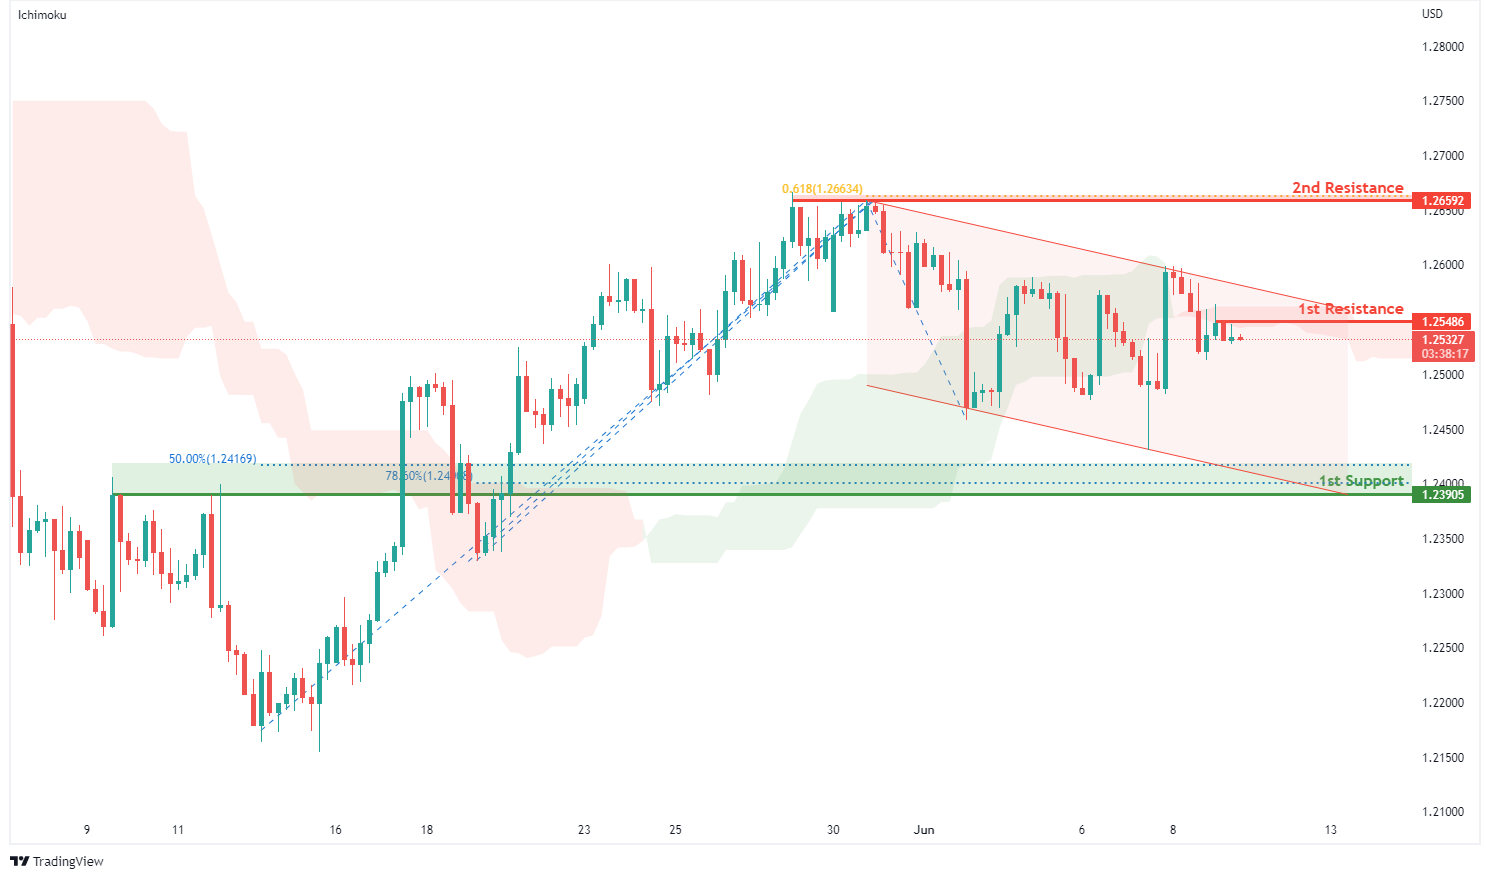
On the H4, with prices moving below the ichimoku indicator, we have a bearish bias that price will drop from our 1st resistance at 1.25486 where the horizontal swing high resistance is to our 1st support at 1.23905 in line with the 50% Fibonacci retracement, 78.6% fibonacci retracement and overlap support. Alternatively, price may break 1st resistance structure and head for 2nd resistance at 1.26592 where the horizontal swing high resistance and 61.8% fibonacci projection are.
Areas of consideration:
- H4 1st resistance at 1.25486
- H4 1st support at 1.23905
USD/CHF:
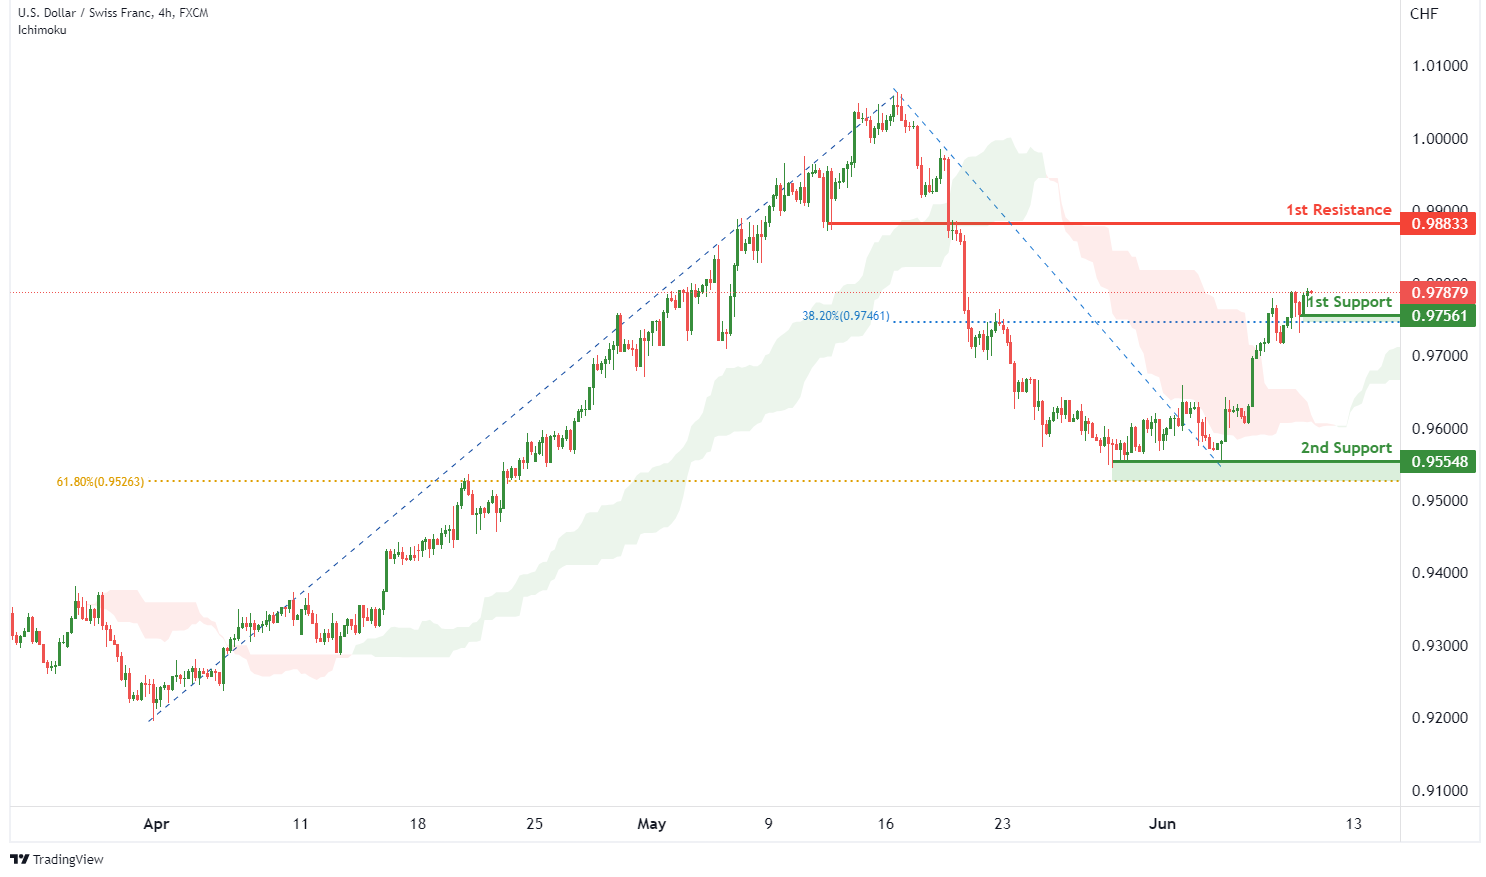
On the H4, with price moving above the ichimoku cloud, we have a bullish bias that price will rise to our 1st resistance at 0.98833 where the pullback resistance is from our 1st support at 0.97561 in line with the swing low support and 38.2% Fibonacci retracement. Alternatively, price may break 1st support structure and head for 2nd support at 0.95548 where the swing low support and 61.8% fibonacci retracement are..
Areas of consideration
- 1st support level at 0.97561
- 1st resistance level at 0.98833
EUR/USD :
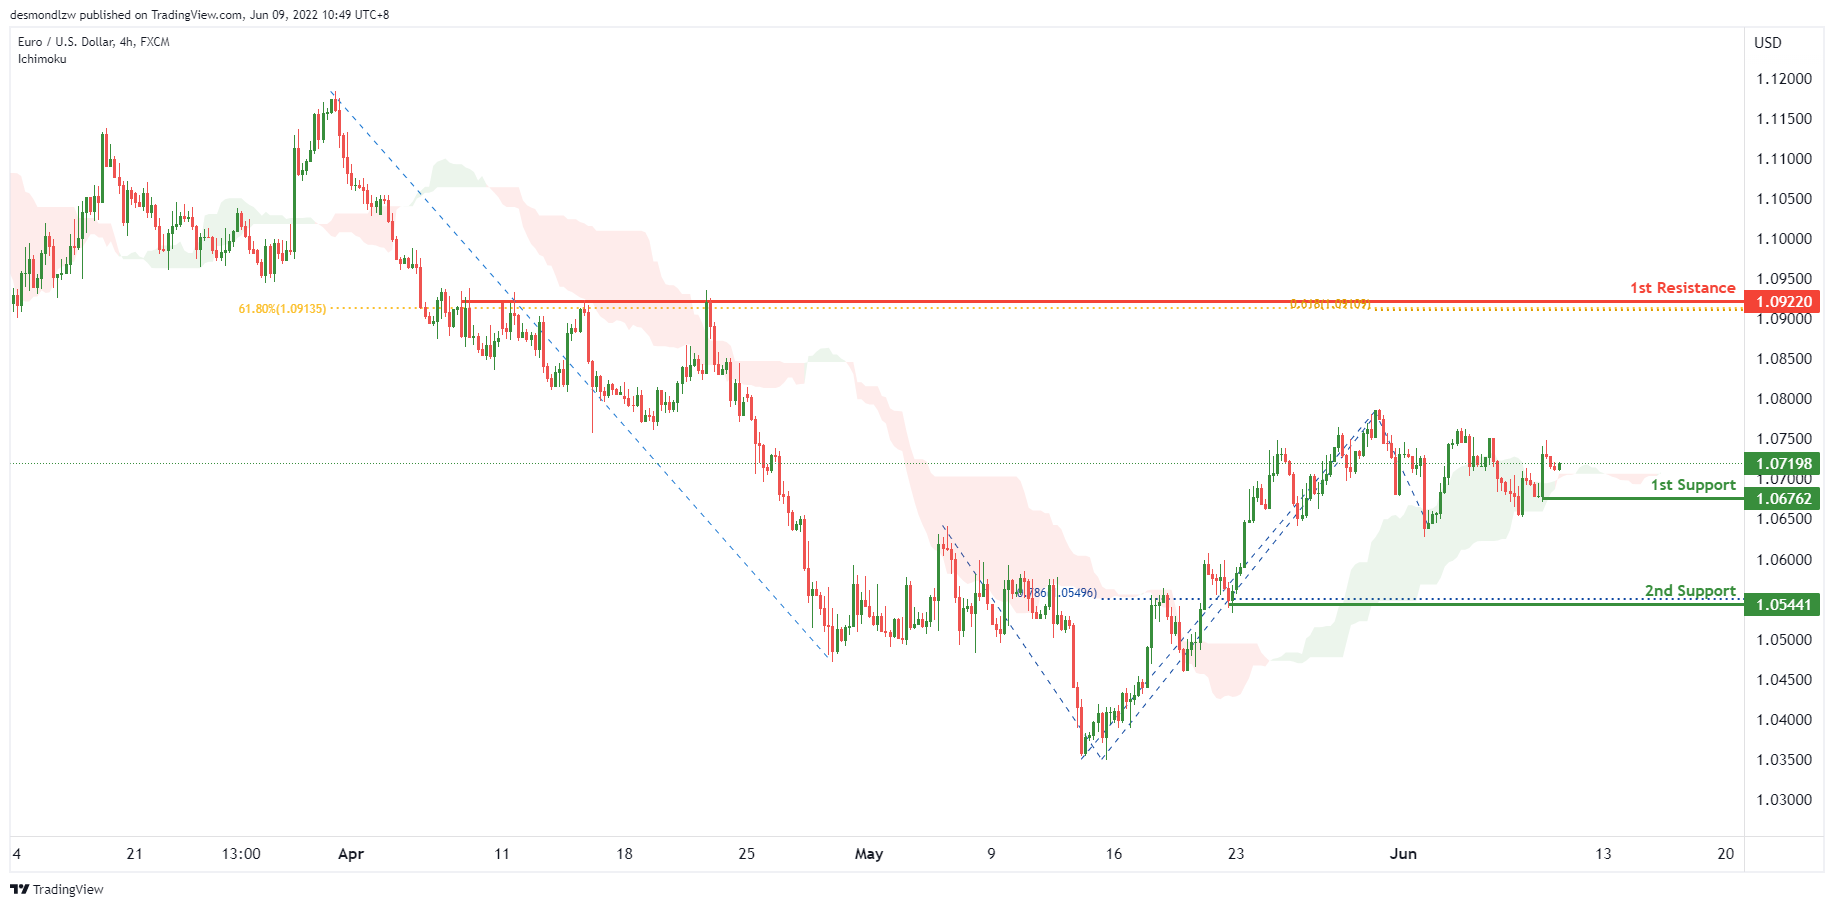
On the H4, with price bouncing off the ichimoku cloud, we have a bullish bias that price will rise from the 1st support at 1.06762 in line with the to the pullback support to the 1st resistance at 1.09220 in line with the 61.8% fibonacci retracement and 61.8% fibonacci projection. Alternatively, price may break support structure at the 1st support and drop to the 2nd support at 1.05441 at the swing low in line with the 78.6% fibonacci retracement.
Areas of consideration :
- H4 1st resistance at 1.09220
- H4 1st support at 1.06762
USD/JPY:
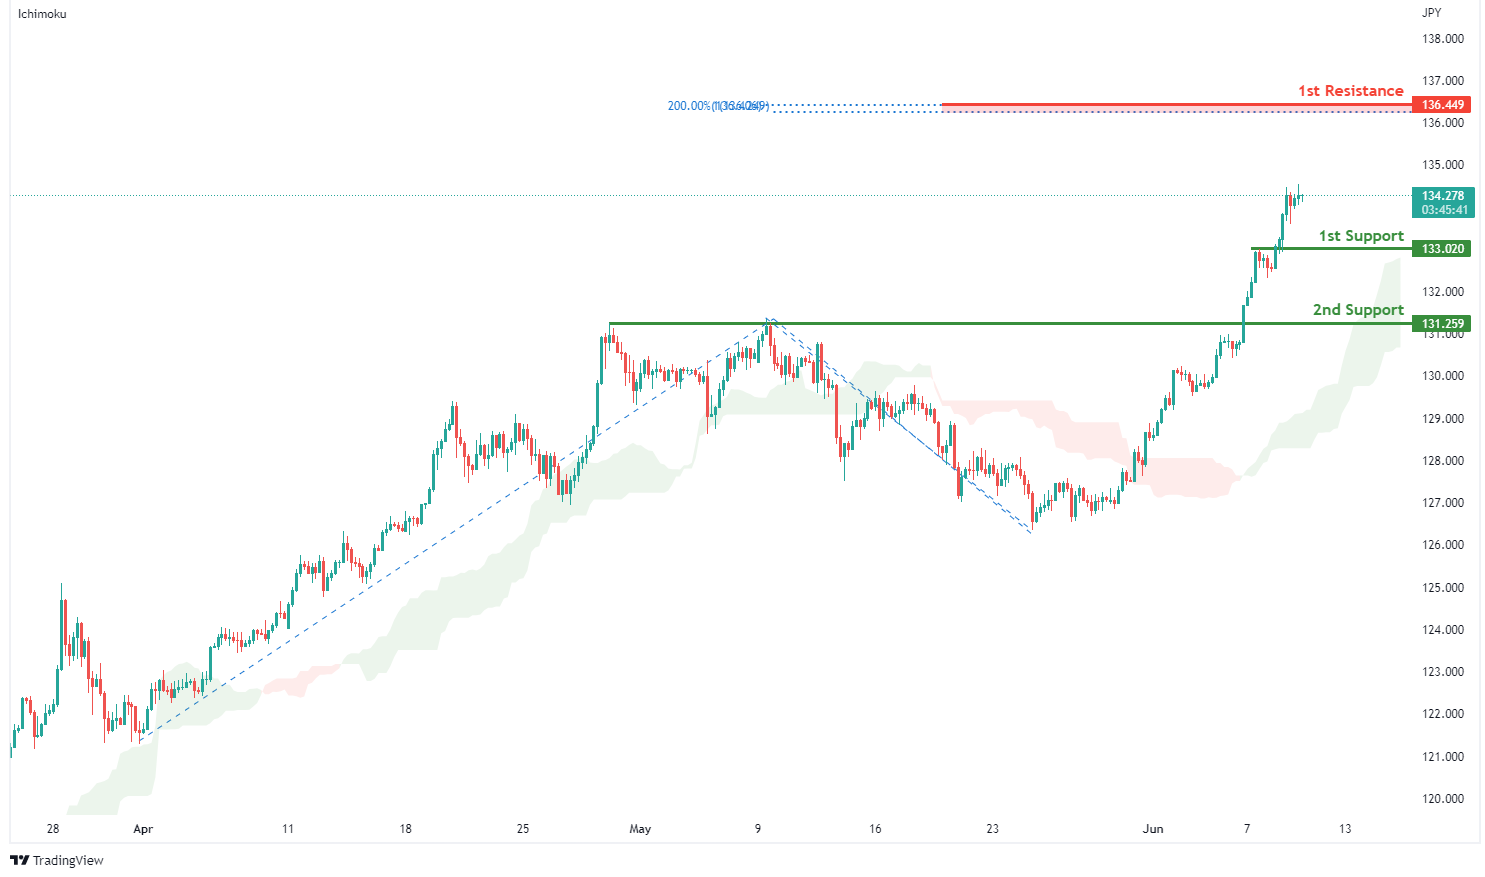
On the H4, with prices moving above the ichimoku indicator, we have a bullish bias that price will rise from our 1st support at 133.020 where the horizontal pullback support is to our 1st resistance at 136.449 in line with the 200% fibonacci extension and 100% fibonacci projection. Alternatively, price may break 1st support structure and head for 2nd support at 131.259 where the horizontal overlap support is.
Areas of consideration:
- H4 time frame, 1st resistance at 136.449
- H4 time frame, 1st support at 133.020
AUD/USD:
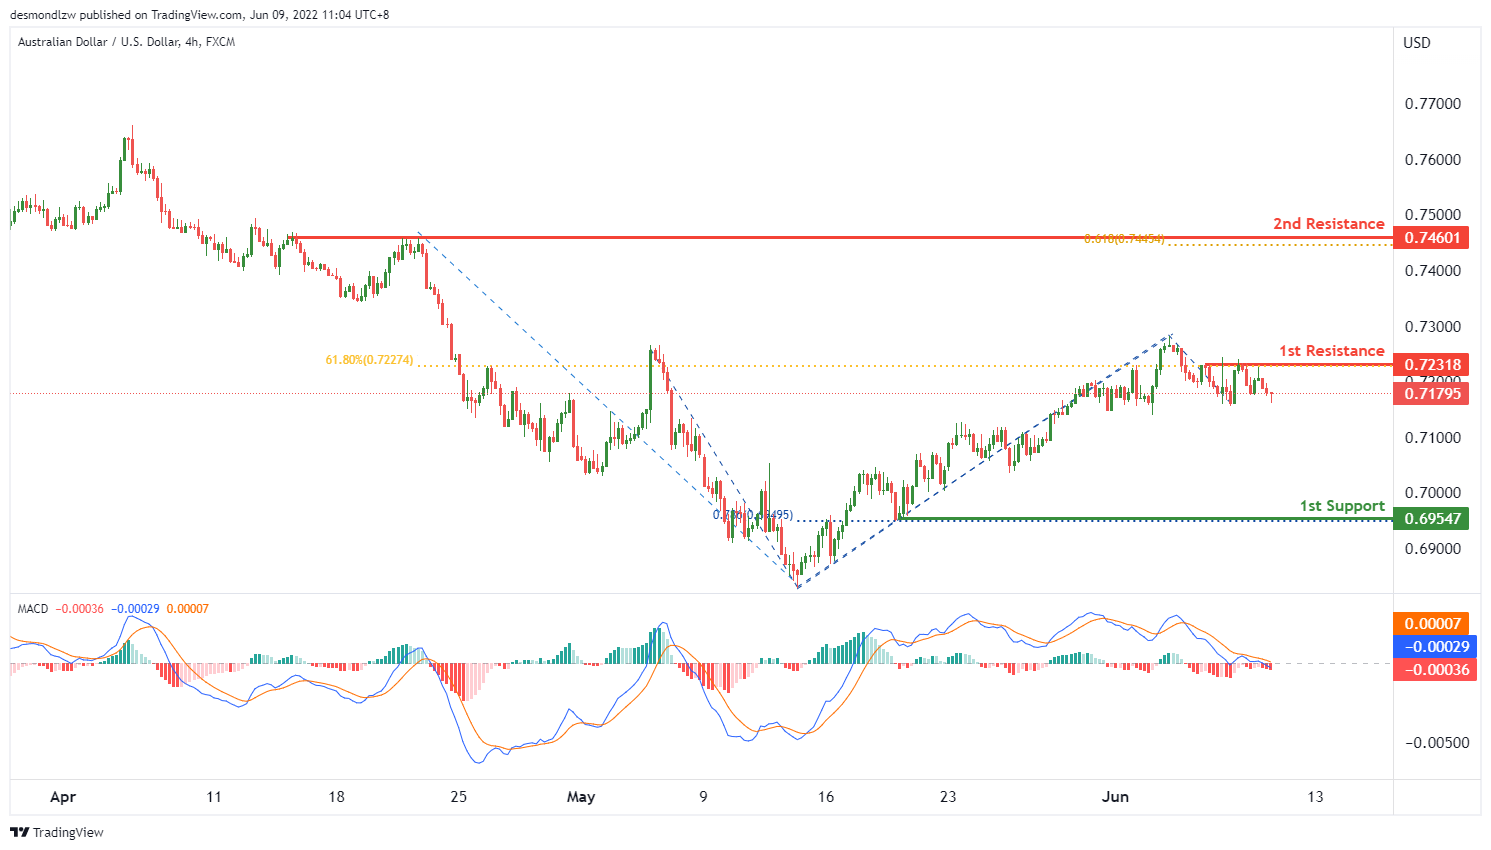
On the H4, with price moving into a bearish pressure area on the MACD indicator, we have a bearish bias that price will drop from the 1st resistance at 0.72318 at the multiple swing highs in line with the 61.8% fibonacci retracement to the 1st support at 0.69547 at the swing low in line with the 78.6% fibonacci projection. Alternatively, price may rise from the 1st resistance to the 2nd resistance at 0.74601 in line with the 61.8% fibonacci projection and multiple swing highs.
Areas of consideration
- H4 1st resistance at 0.72318
- H4 1st support at 0.69547
NZD/USD:
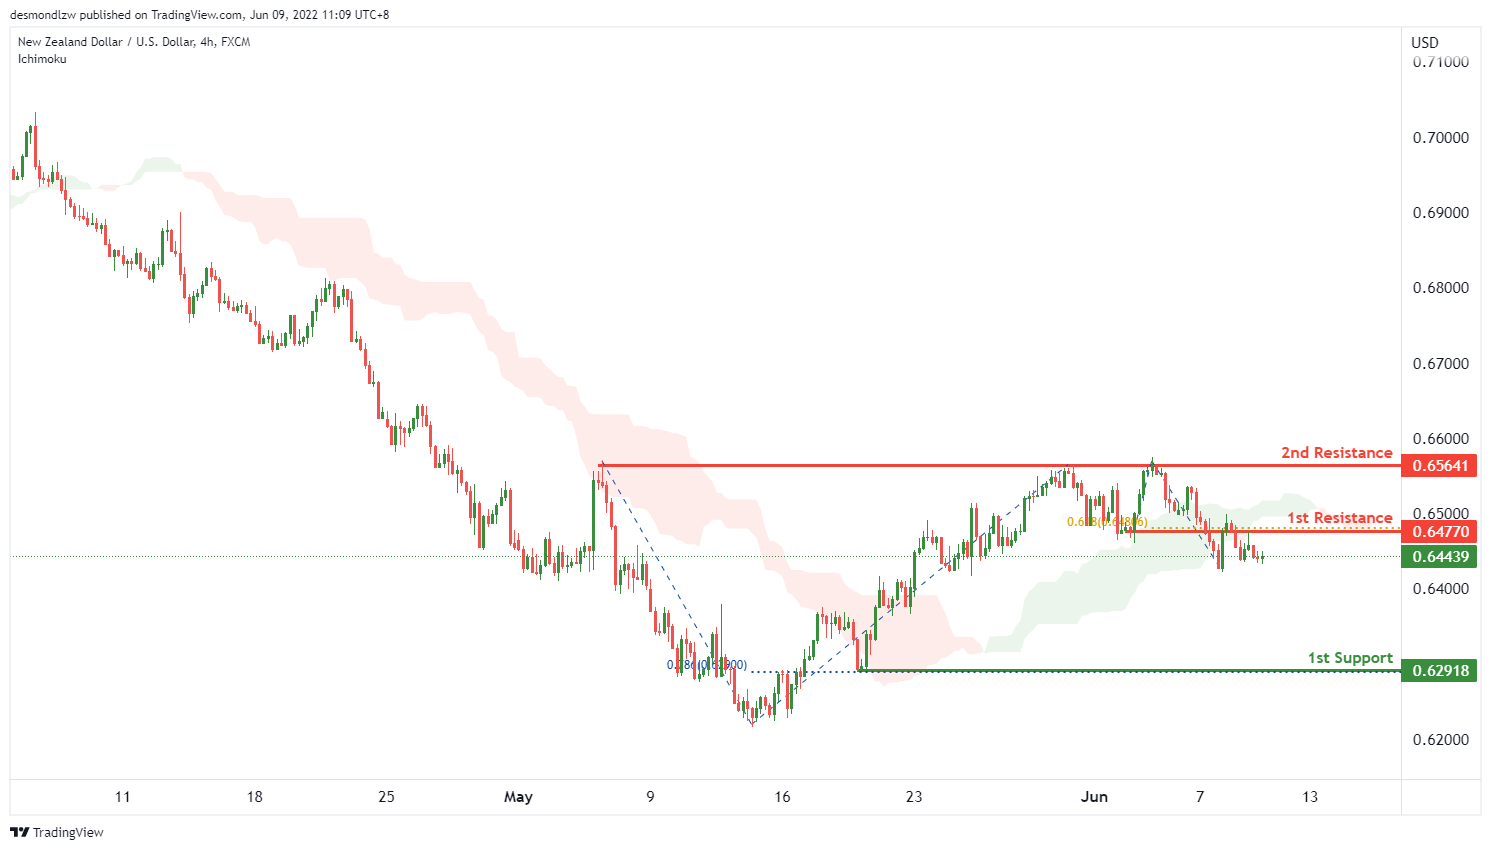
On the H4, with price moving below the ichimoku cloud, we have a bearish bias that price will drop from the 1st resistance at 0.64770 in line with the 61.8% fibonacci projection to the 1st support at 0.62918 in line with the 78.6% fibonacci retracement. Alternatively, price may bounce off the 1st resistance and rise to the 2nd resistance at 0.65641 in line with the overlap swing high.
Areas of consideration:
- H4 time frame, 1st support at 0.62918
- H4 time frame, 1st resistance at 0.64770
USD/CAD:
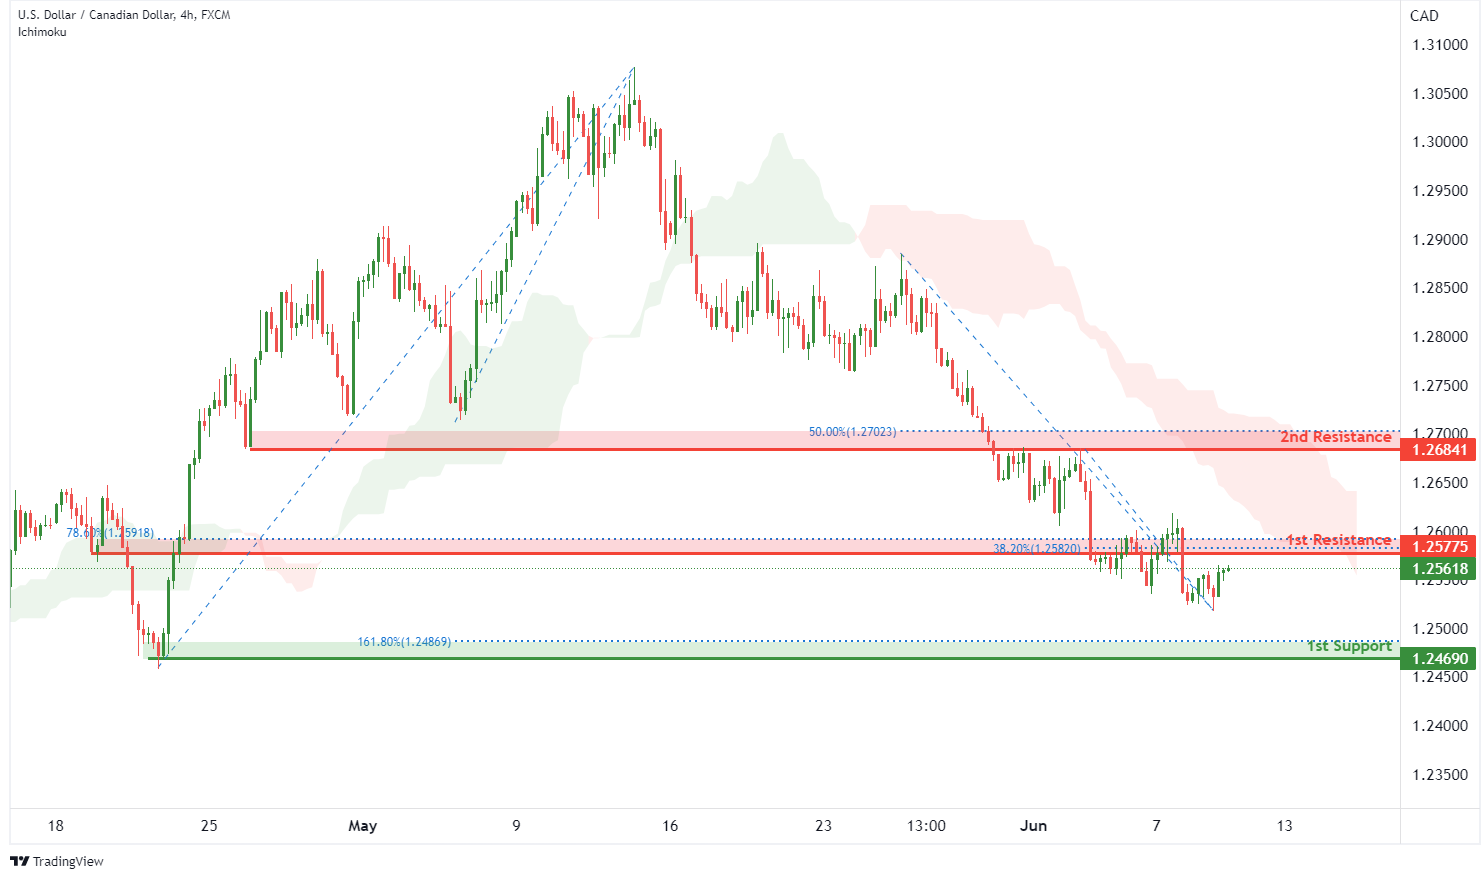
On the H4, with price moving below our ichimoku cloud, we have a bearish bias that price will drop to our 1st support at 1.24690 in line with the horizontal swing low support and the 161.8% Fibonacci extension from our 1st resistance at 1.25775 where the pullback resistance, 78.6% fibonacci retracement and 38.2% fibonacci retracement are. Alternatively, price may break structure and head for our 2nd resistance at 1.26841 in line with overlap resistance and 50% fibonacci retracement.
Areas of consideration:
- H4 time frame, 1st resistance at 1.25775
- H4 time frame, 1st support at 1.24690
OIL:
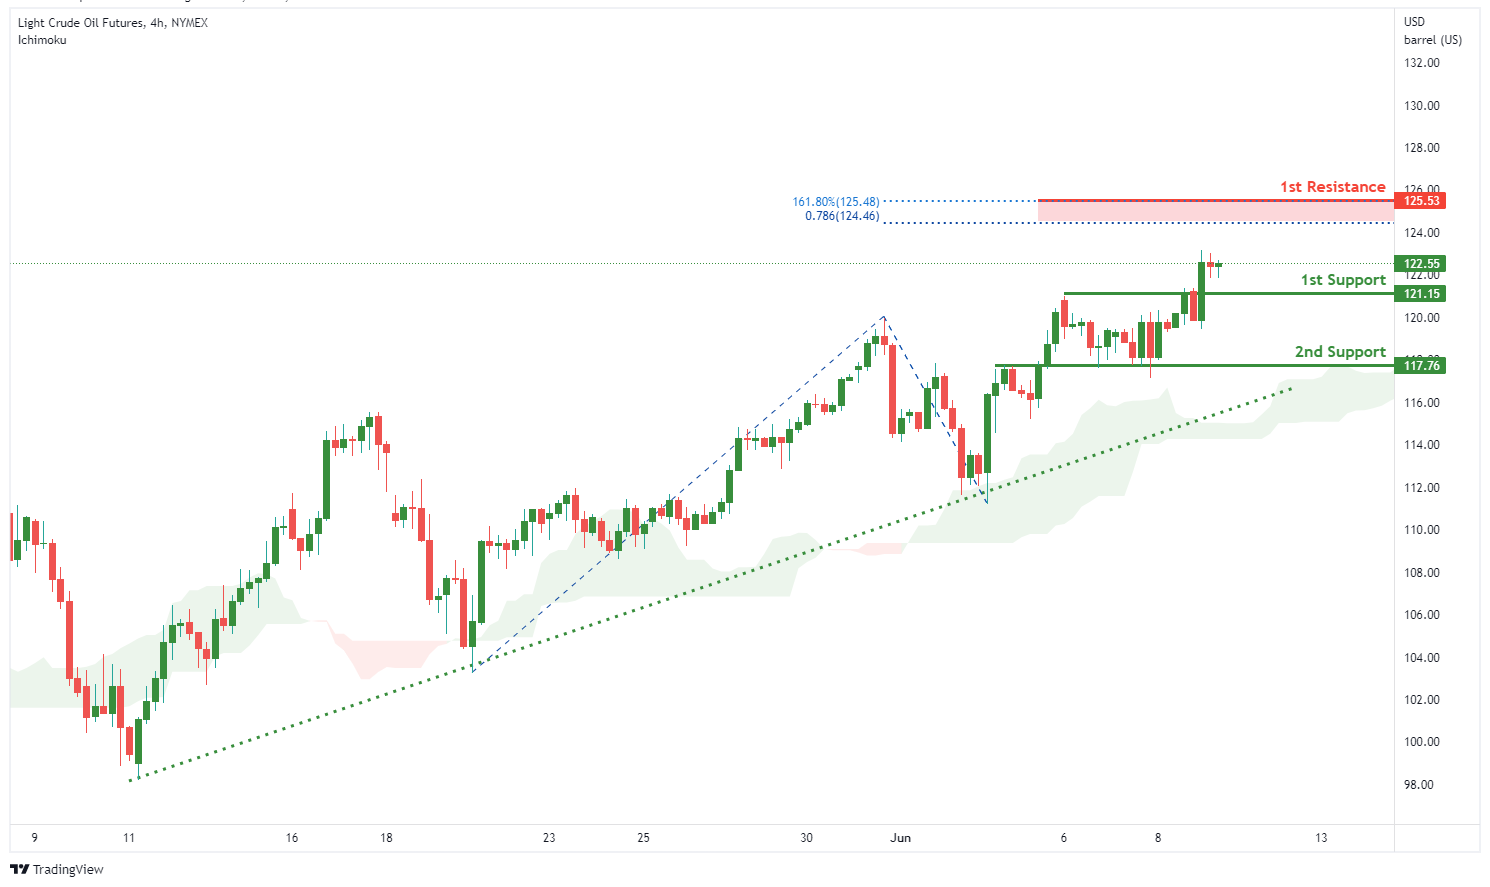
On the H4, with price moving above the ichimoku cloud, we have a bullish bias that price will rise from our 1st support at 121.15 where the horizontal pullback support is to our 1st resistance at 125.53 in line with the 78.6% fibonacci projection and 161.8% Fibonacci extension. Alternatively, price may break structure and head for 2nd support at 117.76.
Areas of consideration:
- H4 time frame, 1st resistance of 125.53
- H4 time frame, 1st support of 121.15
Dow Jones Industrial Average:
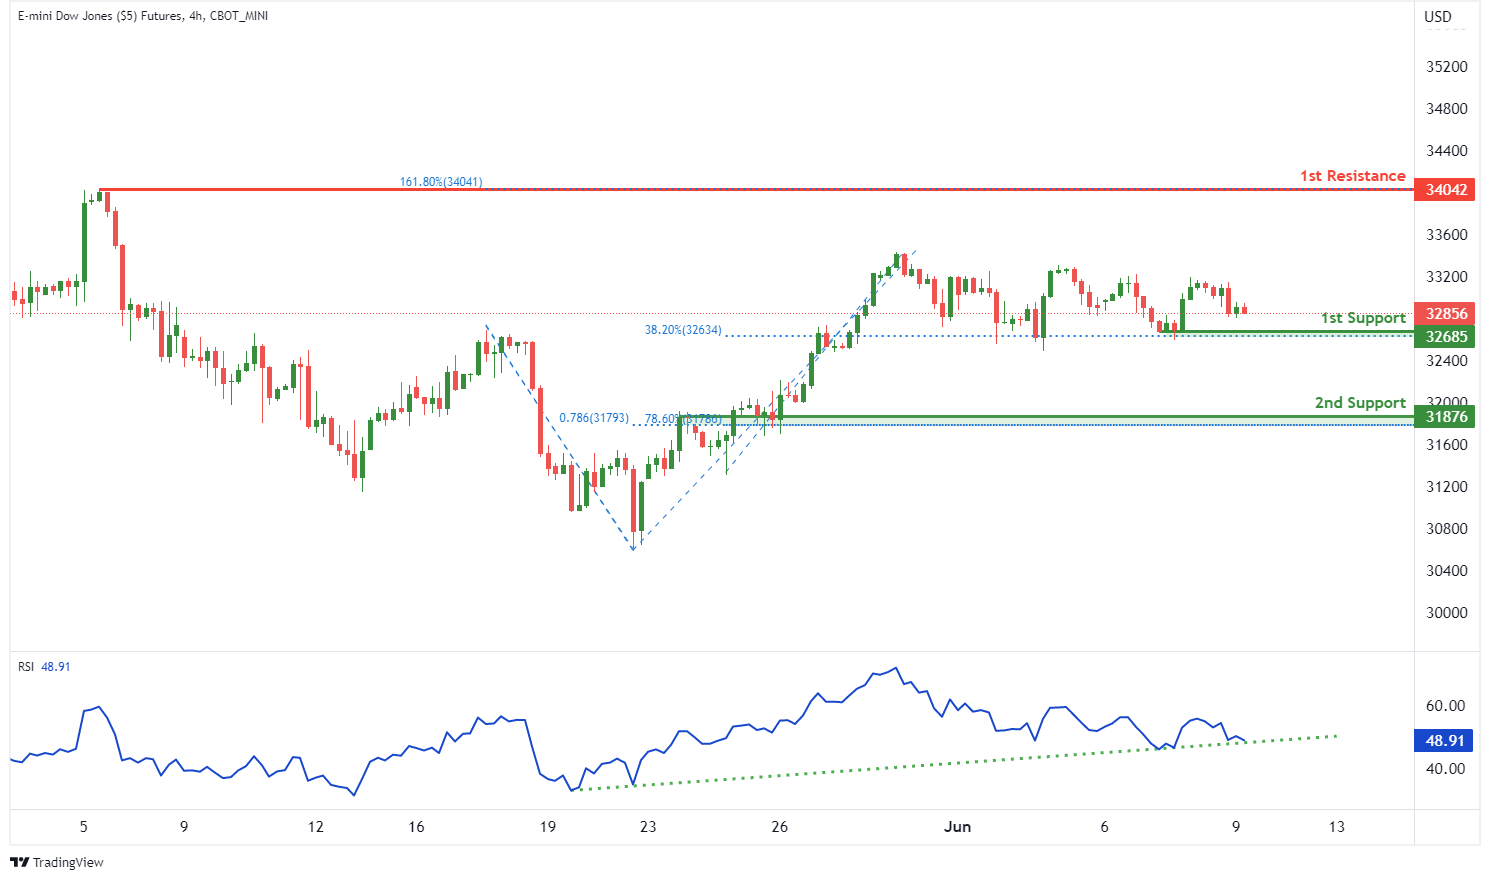
On the H4, with RSI moving in an ascending trendline, we have a bullish bias that price will rise from our 1st support at 32685 where the horizontal swing low support and 38.2% fibonacci retracement are to our 1st resistance at 34042 in line with the swing high resistance and 161.8% Fibonacci extension. Alternatively, price may break structure and head for 2nd support at 31876 where the pullback support, 78.6% fibonacci projection and 78.6% fibonacci retracement are.
Areas of consideration :
- H4 time frame, 1st resistance at 34042
- H4 time frame, 1st support at 32685
Elliott Wave View: DAX Looking to Start a New Bullish Cycle
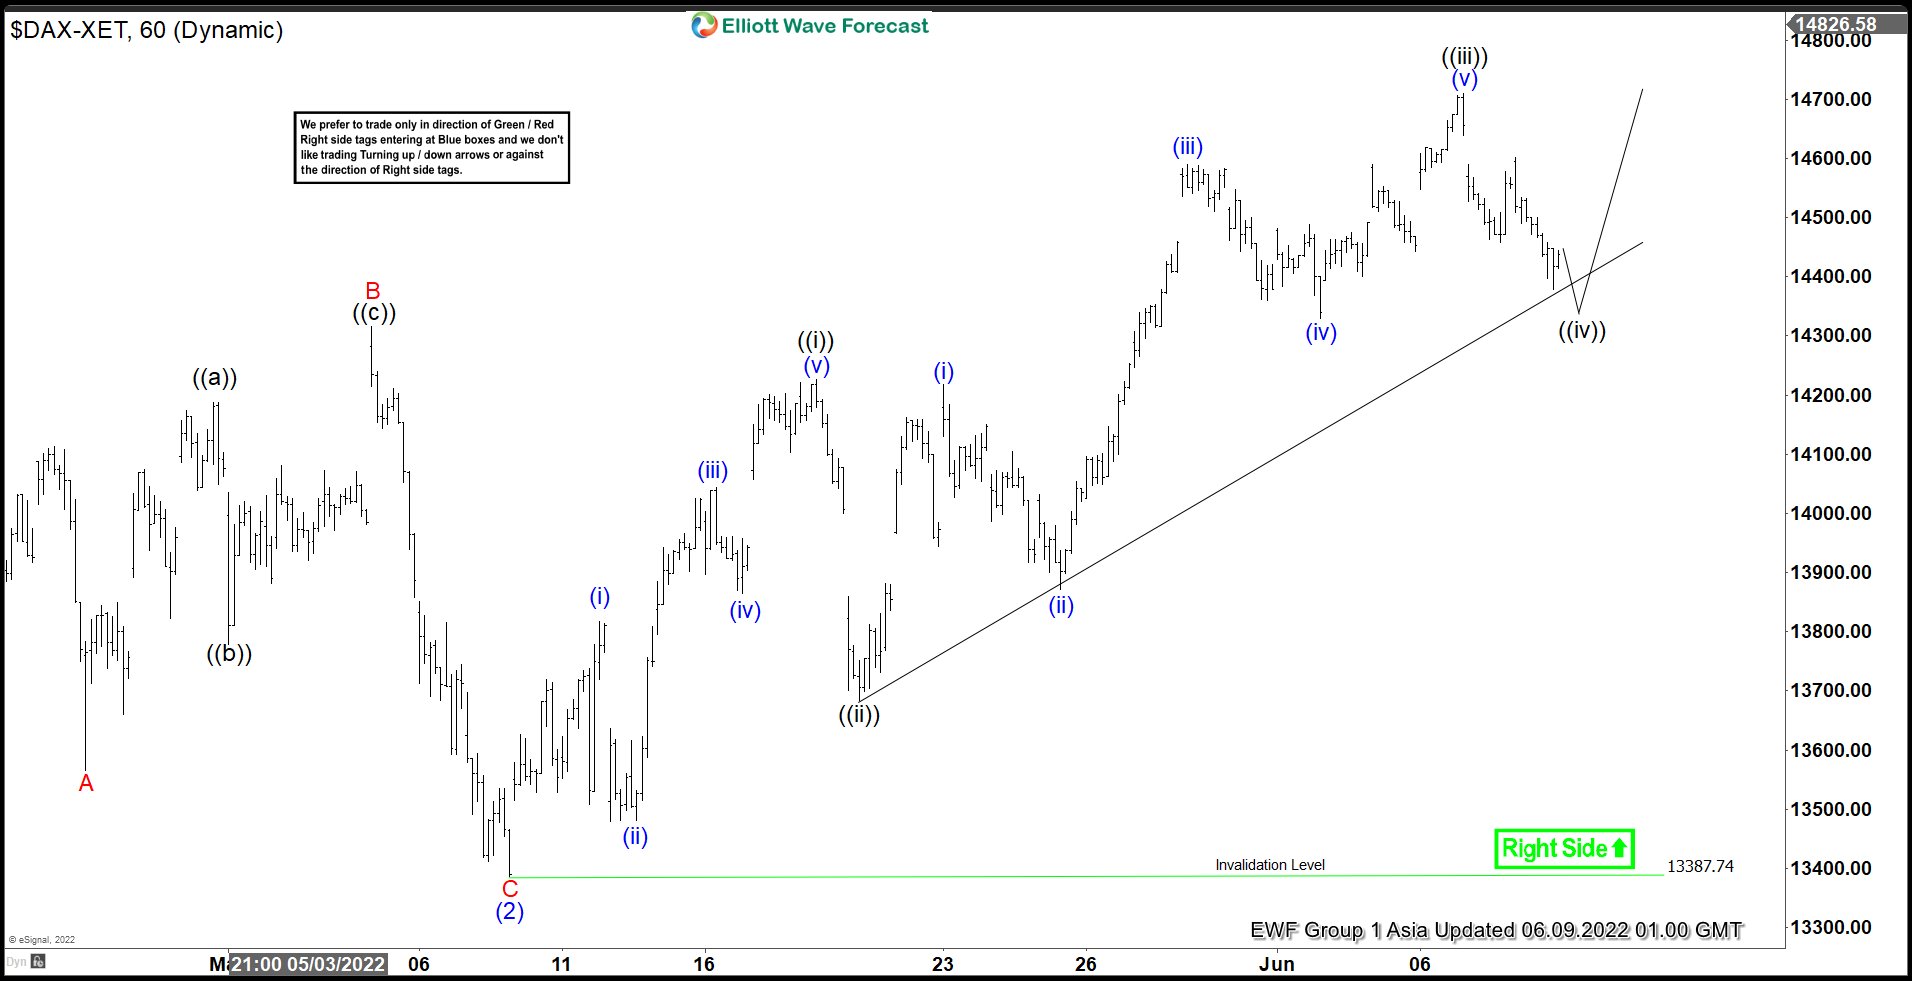
The 3/7/2022 low of 12438.85 in $DAX completed correction to the cycle from March 2020 low (Covid-19 low). From 3/7/2022 low, DAX has turned higher in a 5 waves impulse Elliott Wave structure. Up from 3/7, wave (1) ended at 14925.25 and pullback in wave (2) ended at 13387.74 as the 1 hour chart below shows. Internal of wave (2) unfolded as a zigzag where wave A ended at 13566.2, wave B ended at 14315.24, and wave C ended at 13386.32.
The Index has turned higher in wave (3) with the internal as another 5 waves in lesser degree. Up from wave (2) low at 13387.74, wave ((i)) ended at 14226.47 and dips in wave ((ii)) ended at 13683.59. Index then extends higher in wave ((iii)) towards 14709.38. Expect wave ((iv)) pullback to end soon and Index to make 1 more push higher in wave ((v)) to end wave 1. Afterwards, it should pullback in wave 2 to correct cycle from 5/9/2022 low before the rally resumes. Near term, as far as 5/9/2022 pivot low at 13387.74 stays intact, expect dips to find support in 3, 7, or 11 swing for further upside.
DAX 60 Minutes Elliott Wave Chart
Lira’s Fall Accelerates for Likely Retest of All-time Low
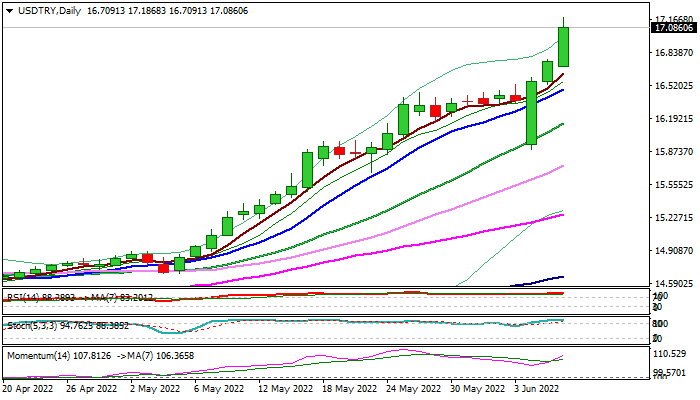
The USDTRY is in strong bullish acceleration for the third straight day (advancing 2.2% only today, as lira came under fresh and increased pressure on worries about skyrocketing inflation (73.5% in May), exhausted country’s reserves and persisting initiative by President Erdogan on further rate cuts.
Turkish lira lost around 27% of its value in the five months of 2022, as larger lira’s downtrend against the dollar since 2013, accelerated in early 2121 and hit a record low in December.
Bulls rose above pivotal Fibo resistance at 16.4182 (76.4% of 18.3387/10.2021 pullback) and on track for weekly close above this level that will confirm bullish signal and open way for retest of all-time high, with possibilities of further advance on break, as fundamental outlook in light of a record inflation, surging energy prices and a number of negative impacts from the conflict in Ukraine.
Overextended studies on all larger timeframes suggest bulls should take a breather, but these signals have so far been ignored, though the price action is very likely to face strong headwinds on approach to new record high.
Res: 17.1868; 17.2204; 17.3520; 175650
Sup: 17.0074; 16.7944; 16.7286; 16.6628
Australia Dollar Dips as Rate Rally Fizzles
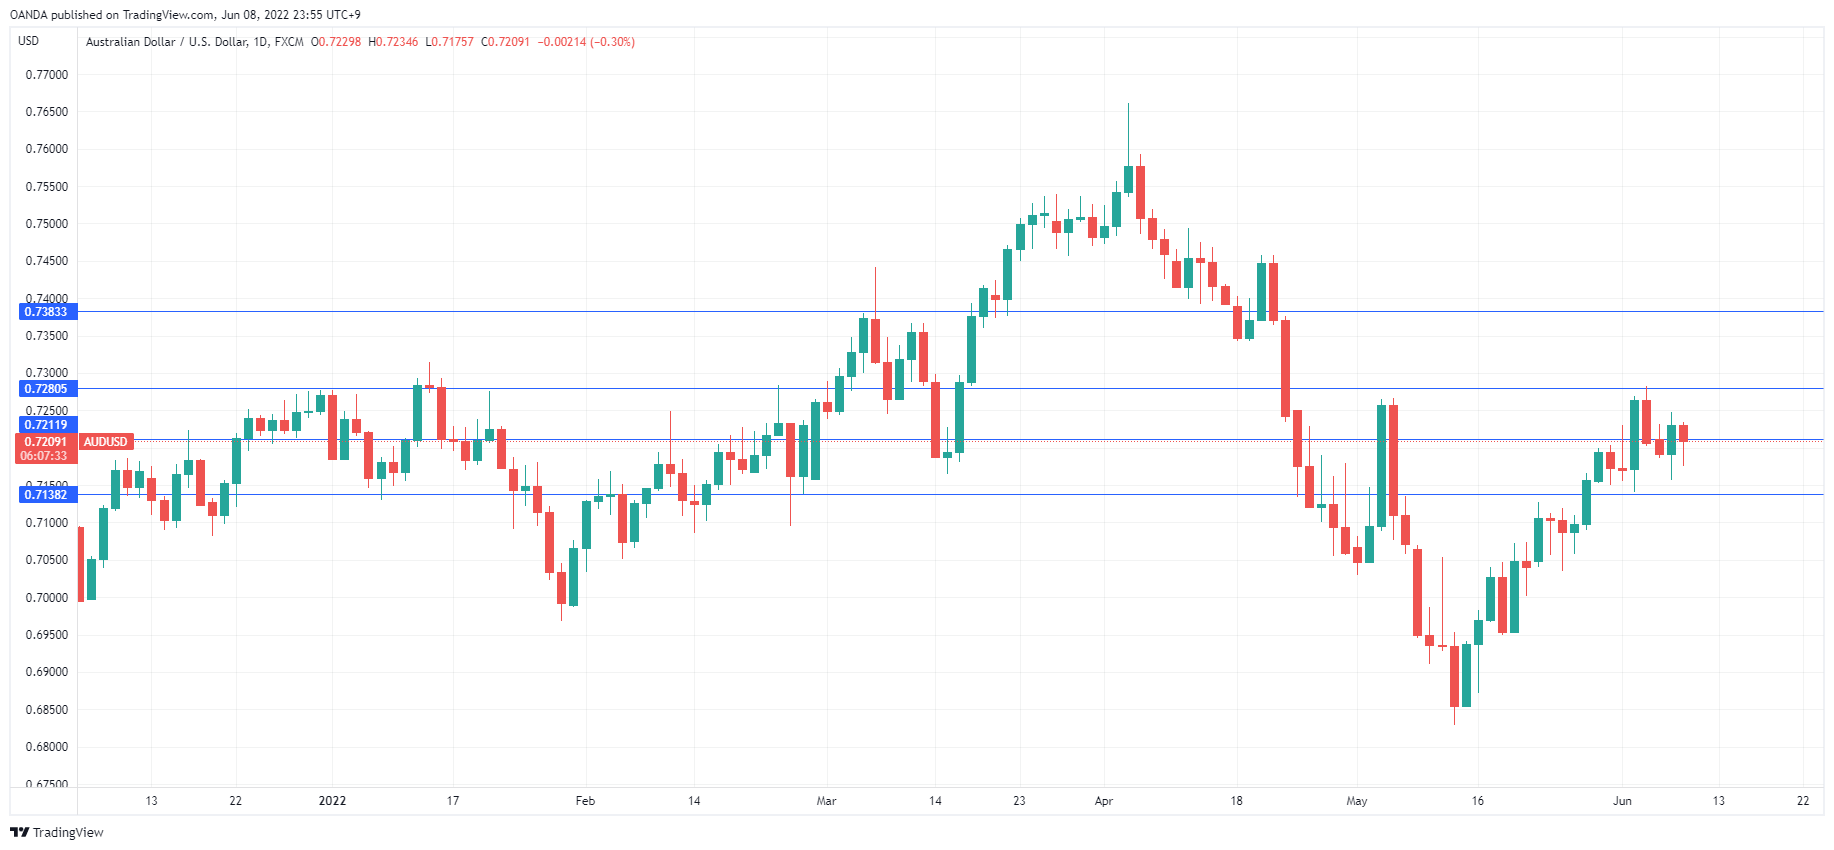
The Australian dollar has reversed directions on Wednesday and is slightly lower. AUD/USD is trading at 0.7209, down 0.28% on the day.
Aussie runs out of steam
The RBA surprised the markets with a supersize rate hike of 50bp yesterday, double what most analysts had predicted. The Australian dollar responded with a swing of close to 100 points and held onto half of those gains. However, any hopes of a sustained post-RBA rally proved to be short-lived, as the Aussie has dipped lower today. The RBA left no doubt that it plans to be aggressive in its battle to curb soaring inflation, and we could see further 50bp hikes down the road if inflation remains stubbornly high. However, the central bank does run the risk of appearing to be in panic mode with such a large hike and runs the risk of losing credibility if inflation doesn’t peak soon.
The RBA’s aggressive hike shows that it “means business”, but the rate statement didn’t come across as particularly hawkish. Policy makers noted that inflation was higher than expected and was projected to accelerate before declining in 2023. The statement said that the rate hike would contribute to inflation falling “over time”, which certainly doesn’t provide much insight – perhaps the RBA is playing a wait-and-see game when it comes to forecasting when inflation will peak.
Yesterday’s massive hike was the RBA’s largest increase since 2000. Still, it’s worth noting that the cash rate is only at 0.85%, which means that the RBA’s rate-tightening cycle is in an early stage and has plenty more room to run. Unless inflation dips dramatically, we can expect the RBA to tighten by around another 100 points by year’s end and continue into 2023. This aggressive tightening scheme will help maintain the US/Australia rate differential, with the Fed also in the midst of a rate-tightening cycle.
AUD/USD Technical
- AUD/USD is testing support at 0.7211, followed by support at 0.7138
- There is resistance at 0.7280 and 0.7353
Sunset Market Commentary
Markets
The scoreboard today doesn’t suggest we’re headed for a pivotal moment in (Europe’s) monetary history. Markets were not particularly sidelined with core bond yields shooting higher. German Bunds even underperform US Treasuries. Yields in America add 2.6 bps (2y) to 3.8 bps (30y) in a move that mainly occurred in Asian dealings. German yields rose throughout the European session to add 4.7 bps (2y) to 6.5 bps (10y). European swap yields rise up to 7.2 bps with the 10y on track for a decisive close above the 2% mark. Growth on the continent in the first quarter underwent a sharp upward revision, doubling from 0.3% q/q to 0.6% q/q or 5.4% y/y (was 5.1% in the preliminary reading). It went unnoticed on markets but may provide some comfort to the ECB in the sense that the economy heads into the normalization cycle on a stronger footing than expected. Equities are once again impressed by the sharp yield increases, shedding half a percent in Europe. The US opens mixed. The euro outperforms peers on FX markets. EUR/USD rose from 1.07 to 1.075 currently even as the dollar is in decent shape too. The trade-weighted greenback (DXY) ekes out a small gain from 102.31 to 102.44. Japan’s yen just keeps on sliding. BoJ governor Kuroda is keeping its hands of the currency, saying that it is a matter of the government. He did say a rapid slump is not desirable but those verbal warnings miss every effect. At 134.26 (up from 132.59), USD/JPY is nearing the 135.15 2002 top. EUR/JPY jumps more than two full big figures to 144.14.
At tomorrow’s policy meeting, the ECB will bid farewell to an era of one-sided monetary policy. Inflation has long undershot the 2% inflation target, calling for an ever-easy monetary policy. But this won’t be the case any more in the new inflation forecast. Price pressures will surpass the 2% mark across the policy horizon, up to 2024, serving as the rationale for removing stimulus as soon as July. Early next month, net purchases under APP will end, followed by a first rate hike later that month (25 bps). As already highlighted in Lagarde’s blog post last month, negative deposit rates end by September. We’ll be looking for clues in the Q&A session whether that means zero (meaning another 25 hike in September) or positive interest rates. Rumours circulate the ECB may also announce a new bond buying programme (oh, the irony), designed officially to “secure monetary policy transmission” across countries. In practice, it is to prevent (peripheral) yields of highly indebted countries rising too much, too fast.
News Headlines
Czech President Zeman named three new members to the governing board. He picked economic professor and previous (dovish) CNB-member Jan Frait, the head of the National Budget Council Eva Zamrazilova and analyst of the Chamber of Commerce Karin Kubelkova. Last month, he promoted Alex Michl from CNB board member to governor in a dovish rotation which will take place at the August 4 meeting. Apart from the actual nominations, it’s telling that none of the outgoing (hawkish) board members were renominated for a second term. It helps explaining why Czech rates extended this week’s increase today, in anticipation of one final hawkish adieu at the June 22 meeting. Money markets discount at least another 100-125 bps move (from 5.75%) currently. Czech swap rates add 15 to 20 bps across the curve today. The Czech koruna ends a fortnight of dull trading with EUR/CZK falling from 24.75 to 24.60.
Hungarian headline inflation accelerated by 1.7% M/M in May, to a 20-yr high of 10.7% Y/Y. Price increases were broad-based, ranging from 3.5% M/M (18.6% Y/Y) for food over 0.9% M/M (18.4% Y/Y) for consumer durables to 0.7% M/M (6.8% Y/Y) for services. The Hungarian central bank (MNB) simultaneously published its own underlying inflation indicators. Core inflation and core inflation excluding indirect tax effects both stand at 12.2% Y/Y. Indicators measuring households’ inflation expectations remain significantly above the central bank’s target range (2%-4%). Today’s inflation print strengthens our believe that the MNB slowed down its tightening cycle too soon. The forint trades back in the defensive after a surprisingly bright run since the start of the month. EUR/HUF rises to 391.50 from 388. The Hungarian swap yield curve bear flattens with yields 5.5 bps (30-yr) to 9 bps (2-yr) higher.
USDJPY Could Climb as High as 150 as BoJ’s Hands are Tied
The USDJPY has added for the sixth trading session out of the last seven, this week renewing 20-year highs. The pair reached 134, getting very close to the extremes of January 2001, near 135.
We see that this new momentum is as strong, if not stronger, than what we found in March-April. The first impulse was a 14% weakening of the yen against the dollar for two months. The central bank and finance ministers started to talk down the yen, indicating that a sharp deterioration was undesirable.
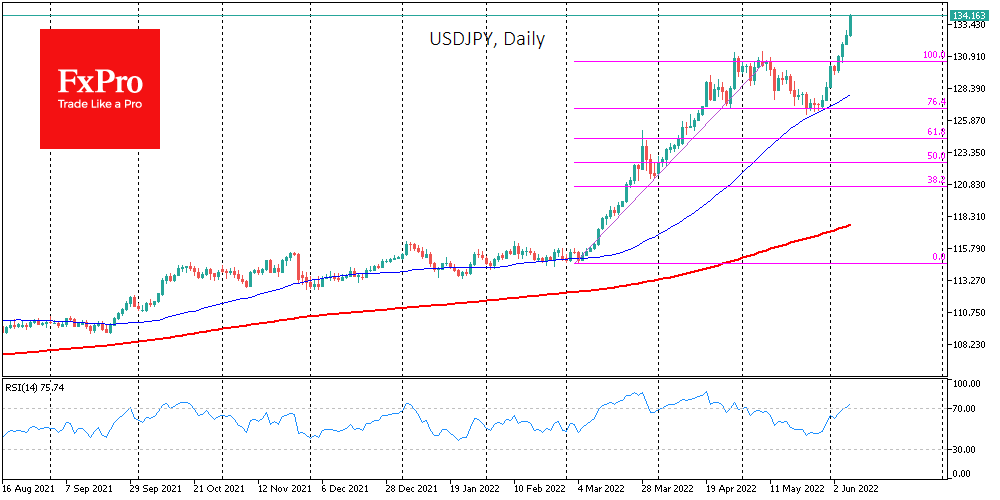
The pullback, triggered by verbal interventions and speculation that the BoJ might reduce QE to tighten policy and protect the yen, only bought time but turned the market around.
In the last days of May, it was clear that the monetary watchdogs favoured continued stimulus and did not change their policy. This mood contrasts sharply with the active policy tightening moves in the USA in many other developed countries and is a fundamental reason for using the yen as a funding currency.
If the Bank of Japan manages to conduct a controlled landing of the yen at another, fundamentally lower level, it would restore competitiveness to Japanese exports and provide a driver to turn on the industrial engine, which has often stalled in recent years.
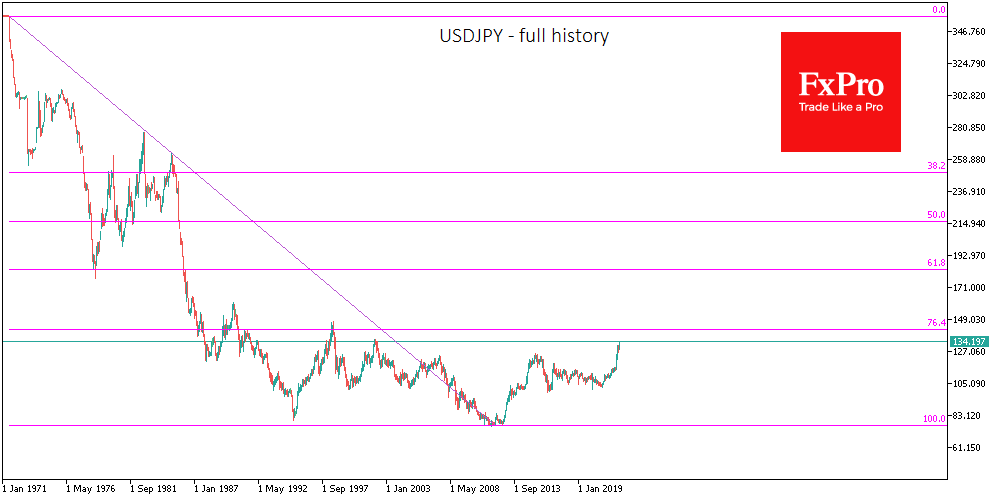
In the meantime, investors and traders should be prepared for a permanent yen decline over this year or the first half of the next one if we now see Europe and the US abandoning their zero-interest-rate policy, as policymakers there hinted recently. For its part, Japan will likely remain tied up in an anaemic economy riddled with sovereign debt, which will not allow for an adequate increase in government stimulus to spur growth.
All that sets the stage for USDJPY to move up towards 140 in the coming weeks and 150 before the end of the year. However, the tight correlation between the yield on 10-year US Treasuries and the USDJPY dynamics suggests that without an economic disaster in Japan or the global economy, a fixation above 150 is unlikely.
EURJPY Accelerates to the Highest in Seven Years
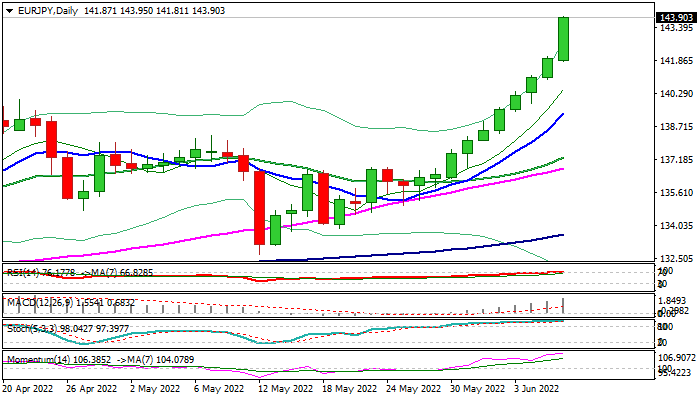
The EURJPY cross accelerated steep rally on Wednesday, hitting the highest levels since January 2015 and on track for the biggest daily gains since Feb 3.
Yen remains strongly pressured by BoJ’s ultra-easy monetary policy, compared to hawkish Fed, with the ECB expected to lay the groundwork for rate hikes on Thursday’s policy meeting.
Solid Eurozone GDP data (annualized GDP grew by 5.4% in Q1 from 4.7% in the previous three-months and beat forecast at 5.1%) added to positive signals for the single currency.
Bullish daily techs support the action which eyes initial targets at 145.30 / 67 (2015 / 2013 highs respectively) and could extend towards 149.76/150.00 (2014 peak / psychological) on break.
Bulls so far ignore overbought conditions, but some price adjustment should be expected in coming sessions.
Former top at 140.00 (Apr 21( and rising 10DMA (139.33) offer solid supports.
Res: 144.54; 145.30; 145.67; 147.34
Sup: 141.81; 140.93; 140.00; 139.33