Sample Category Title
Fed George: We have got to get to neutral really fast
In a WSJ interview, Kansas City Fed Esther George said that with inflation at at 7.5% in January, and the benchmark interest a rate near zero, Fed's policy is "out of sync". But she said it's too soon to say if Fed should hike by 50bps in March. She also hasn't form a view on how much interest rate has to go up this year.
"What we have to do is be systematic," George said. "It is always preferable to go gradual…Given where we are, the uncertainties around the pandemic effects and other things, I'd be hard-pressed to say we have got to get to neutral really fast."
"If we get to March and the data says we should be talking about that [a half-point rate increase], I'm sure that will be in play, but I'm not sure that is the answer, per se, to how we get there," George added.
She also dismissed the idea of holding an emergency FOMC meeting to raise interest rate. "I don't know that I'd call the markets reacting to data an emergency here, because frankly, in my own forecast of looking where inflation was moving, the print was not a surprise," she said.
Ukraine Tensions Sink Stocks, Propel Oil and Gold Higher
- Warnings of imminent Ukraine invasion send markets into a tailspin
- Stocks tank, dollar and yen advance, oil breaks higher, gold shines
- Meanwhile, speculation about emergency Fed action is running wild
Ukraine conflict
Geopolitical tensions have returned to haunt financial markets. The US president called on all American citizens to leave Ukraine immediately on Friday, citing the threat of a Russian invasion that could begin at any moment. It is still unclear how much of this is political grandstanding as the White House may be trying to put Russia under the global spotlight to deter military action.
Nonetheless, market participants took the warning seriously, which sparked a classic flight to safety. Stock markets tanked as investors slashed their exposure to riskier assets and sought shelter in safe havens, driving gold prices to three-month highs.
Bullion has displayed remarkable resilience to fading central bank liquidity and soaring bond yields this year, essentially defying gravity thanks to demand for geopolitical hedges. The heated rhetoric has also been a blessing for oil prices, which rose to fresh seven-year highs amid fears of an energy crisis in case Western sanctions cripple exports from Russia.
Euro suffers, dollar and yen shine
In the FX arena, the euro came under heavy fire as traders priced in the collateral damage from a potential conflict at the Eurozone’s doorstep and the spillover effects from spiraling energy prices. This is already a huge problem in Europe as consumers are being squeezed by rising electricity bills.
The Russian ruble got eviscerated too despite the spike in oil prices. On the opposite side of the risk spectrum, the US dollar and the Japanese yen shined bright as traders looked for protection from the storm.
Beyond defensive flows, speculation around what the Fed will do next has also put the wind back in the dollar’s sails, after another scorching hot US inflation print sent bond markets scrambling to price in aggressive rate increases.
Six and a half rate hikes are now priced in for the year, the probability of a 50 basis points move in March has gone through the roof, and there is all kinds of speculation about an emergency Fed meeting being called this week.
What’s next
Global markets are at the mercy of politics for now and whether the Ukraine crisis evolves into a kinetic war is what matters most. The German Chancellor will head to Kiev today in an attempt to defuse the situation, so the diplomatic effort continues.
On the bright side, there’s so much geopolitical risk premium priced into most assets right now that if the situation de-escalates peacefully, the ensuing relief rally could be rather powerful. The next few sessions could be gloomy as the fog of war descends on financial markets, but the trading playbook generally says to fade war concerns.
Indeed, equity markets have had everything thrown at them lately - from rising Fed bets to war threats - and have escaped with only minor injuries. The volatility will likely continue as investors learn to live without endless liquidity, but with the economy still in good shape and buybacks going strong, the market is unlikely to crash either. The turbulence might even be a gift to investors with long time horizons.
As for today, we will hear from ECB President Lagarde at 16:15 GMT.
Nikkei lost -2.2% on risk aversion, heading back to 26k first
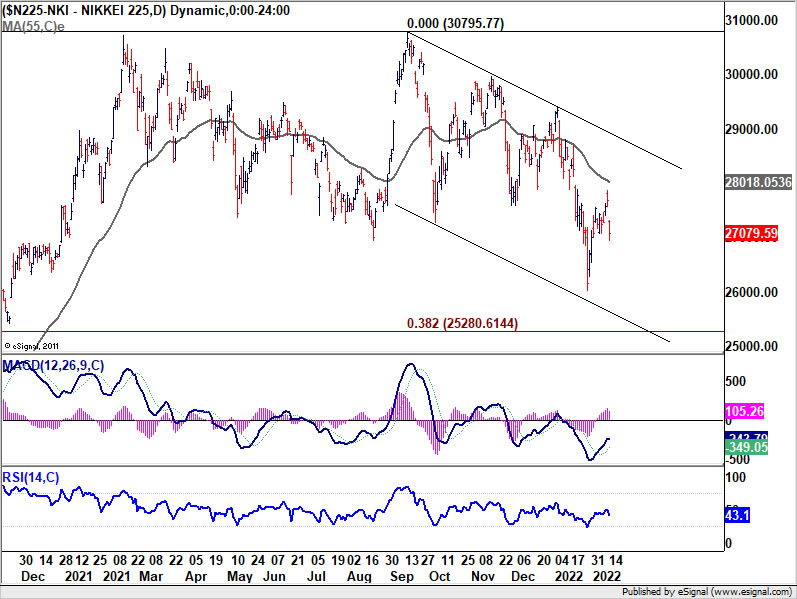
Markets are generally staying in risk-off mode today as there is no sign of de-escalation in Russia-Ukraine situation. Nikkei tumbled sharply by -616.49 pts, or -2.23%, to close at 27079.59.
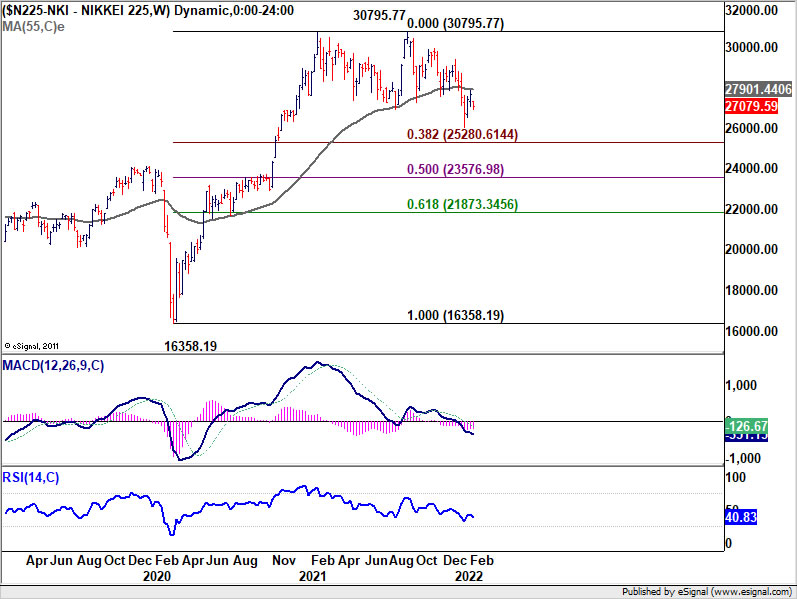
Near term bearishness in Nikkei remains after rejection by 55 day EMA. The choppy decline from 30795.77 is in progress for retesting 26044.52 low. But, the major line of defense is at 38.2% retracement of 16358.9 to 30795.77 at 25280.61. We'd expect strong support from there to bring rebound.
However, the rejection by 55 week EMA is also a medium term bearish sign, which argues that the fall from 30795.77, as a correction to the up trend from 16358.19, might last longer than originally expected. Indeed, sustained break of 25280.61 could send Nikkei further to the zone between 50% retracement at 23576.98 and 61.8% retracement at 21873.34 before bottoming.
EURUSD Resumes Negative Bearing Below 1.15 Handle
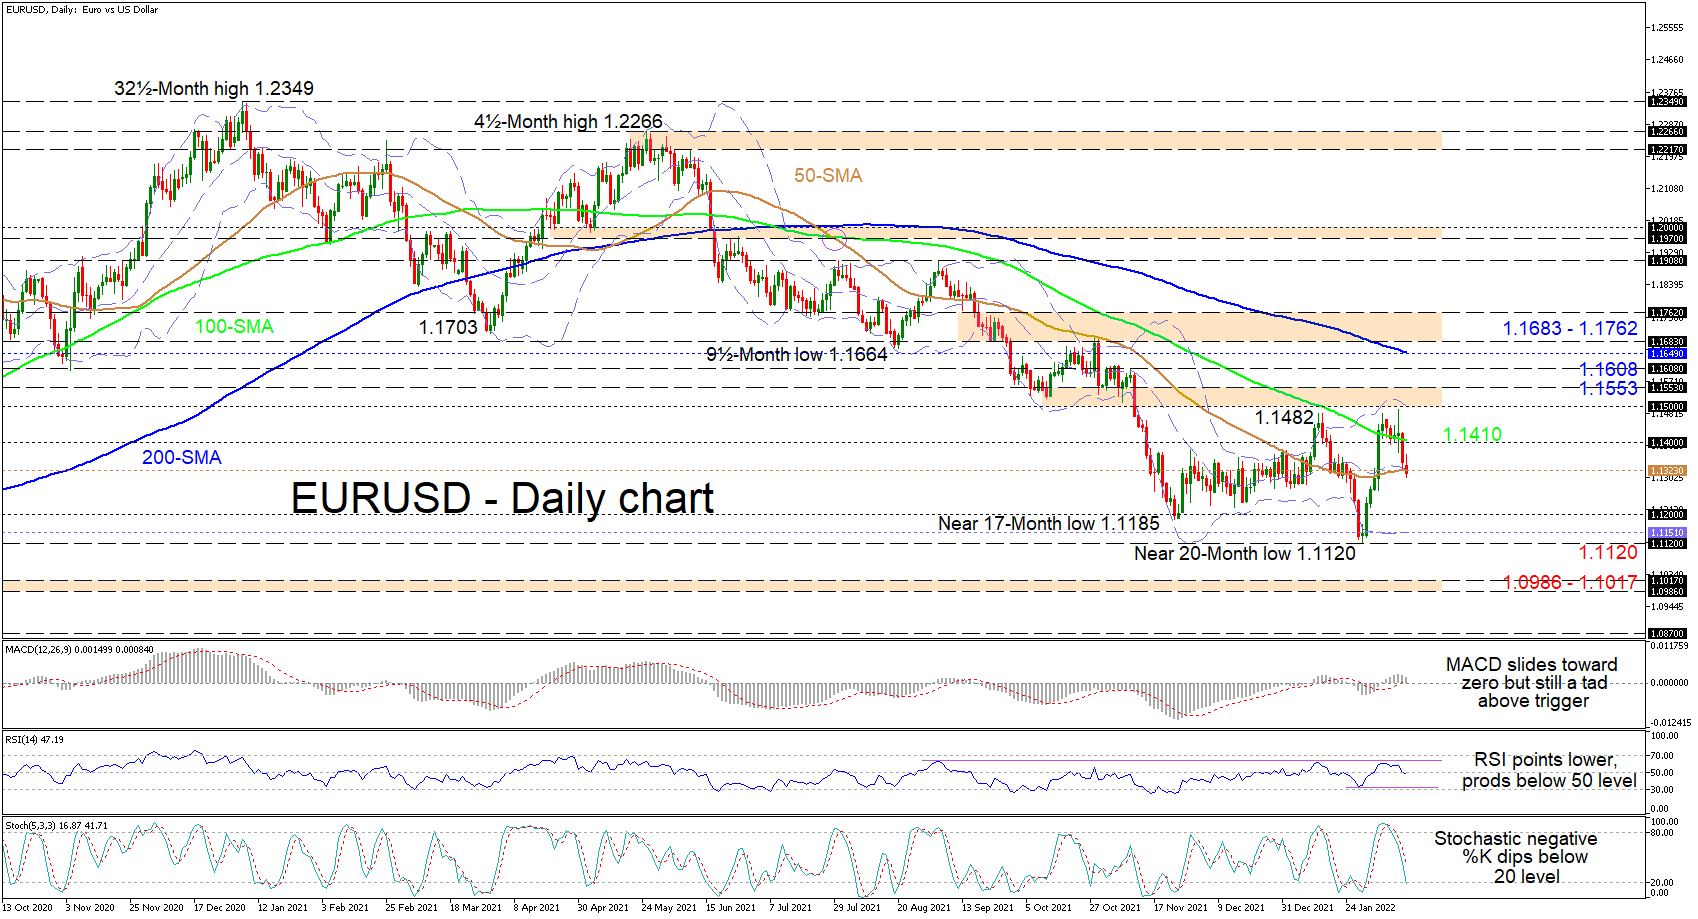
EURUSD has successfully weighed on the 50-day simple moving average (SMA) - coupled with the mid-Bollinger band - and growing bearish pressures have now clearly pushed below 1.1323, crushing buyers’ efforts to breach the 1.1500 barrier. The longer-term falling 100- and 200-day SMAs are endorsing the eight-month descent from the 1.2266 peak, while the 50-day SMAs’ bounce has softened, indicating that the rally from the near 20-month low of 1.1120 has been curbed.
The short-term oscillators are reflecting that negative momentum is gaining pace. The MACD, in the positive zone, is falling towards its red trigger and zero lines, while the dipping RSI has pierced into the bearish region. The stochastic oscillator is exhibiting a strong negative charge and the %K line has nudged into oversold territory, implying negative price action may intensify further.
If sellers retain the reins, the pair may encounter initial downside friction some distance lower around the 1.1200 border, before the lower Bollinger band at 1.1151 and the near 20-month trough of 1.1120 are challenged. If the lower Bollinger and key trough fail to halt declines from accelerating, the price could then target the 1.0986-1.1017 support band, moulded by the inside swing highs over the mid-April until mid-May 2020 period.
In the event buyers regain control and lift the price back above the immediate 50-day SMA and mid-Bollinger band, they may meet fortified resistance at the 1.1400 hurdle, where the descending 100-day SMA, at 1.1410, has neared. Should buying interest increase further, the price may overstep these obstacles and aim for the critical resistance barricade that exists from 1.1500 until 1.1553. Conquering this boundary too could reinforce upside momentum, encouraging buyers to reel in the 1.1608 high before tackling the 200-day SMA overhead at 1.1649.
Summarizing, EURUSD’s neutral-to-bearish bias is looking set to intensify. A dive in the pair deepening significantly below the 50-day SMA could confirm this, while a break below the 1.1120 trough would restart the broader decline. That said, for convincing bullish developments to return, the price would need to steer north of the 1.1683-1.1762 barrier.
Yen Extends Gains on Ukraine Tensions
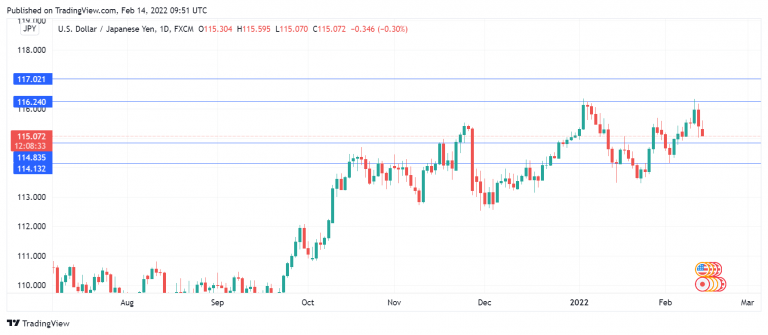
The yen has started the trading week with gains, with USD/JPY trading just above the 115 line in the European session.
Yen rises on Ukraine worries
The crisis on the Ukraine/Russia border continues to dictate movement in the global financial markets. Hopes that the situation might be solved diplomatically deteriorated after the US said it expected an invasion on Wednesday and ordered military and diplomatic personnel to evacuate Ukraine. Stock markets are down, oil is up, and the safe-haven Japanese yen has received a boost as nervous investors dump risk and flock to safety.
On the economic calendar, Japan will release fourth-quarter GDP later today. The economy is expected to have rebounded in Q4 as the government lifted health restrictions due to the Omicron wave at the end of September. The consensus for GDP Q4 stands at 1.4% q/q, after a reading of -0.9% in Q3. However, the outlook for 2121 Q1 looks grim, with expectations of negative growth. Omicron has surged in January, forcing the government to reinstate health restrictions across most of the country.
On Monday, a report indicated that consumer confidence plunged to its lowest level since the onset of Covid in early 2020. Consumers are faced with rising prices, and a fall in consumer spending would be bad news for the economy.
In the US, the hot inflation report last week has the markets focused on the number of rate hikes the Fed will deliver this week. The range is from 3-7 hikes, which means there is plenty of uncertainty, and it’s likely that even the Fed hasn’t finalized a course of action. The Fed will have to provide some guidance as to what to expect after March, with liftoff a virtual certainty next month. The size of the hike is still up in the air, although the likelihood of a 0.50% rise has jumped since the inflation release, which showed that inflation accelerated to 7.5% in January, up from 7.0% beforehand.
USD/JPY Technical
- There is resistance at 115.54, followed by 116.88
- There is support at 113.18 and 112.16
Gold Price Moved into a Bullish Zone below $1,850
Gold price started a major increase above the $1,835 resistance against the US Dollar. The price broke the $1,850 resistance level to move into a bullish zone.
Besides, there was a break above $1,860 and the 50 hourly simple moving average. The price traded as high as $1,865 and is currently correcting lower. An initial support on the downside is near the $1,848 level.
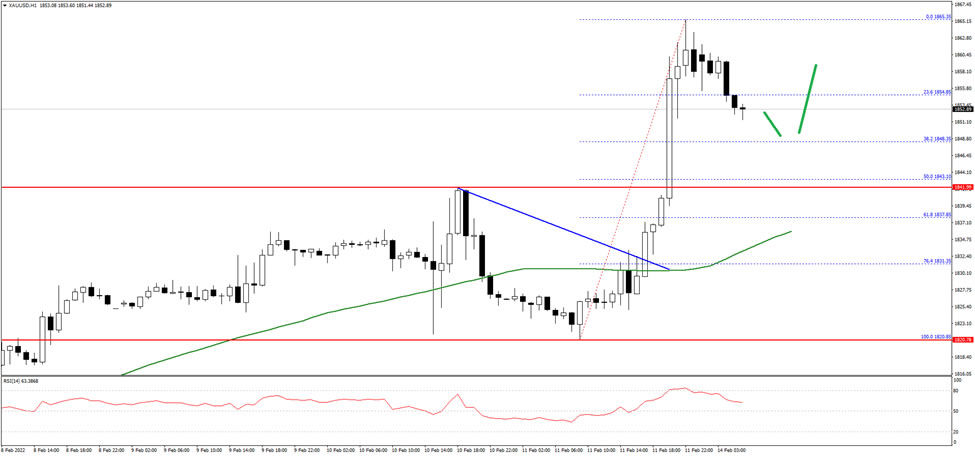
The next major support is near $1,840, below which the bears might gain strength. In the stated case, the price could start a steady decline towards $1,825 on FXOpen.
On the upside, the price is facing resistance near the $1,860 level. The next main resistance could be near the $1,865 level, above which the price could rise towards the $1,880 level. Any more gains might open the doors for a move to $1,900.
Gold raises its bullish stakes after victorious rally
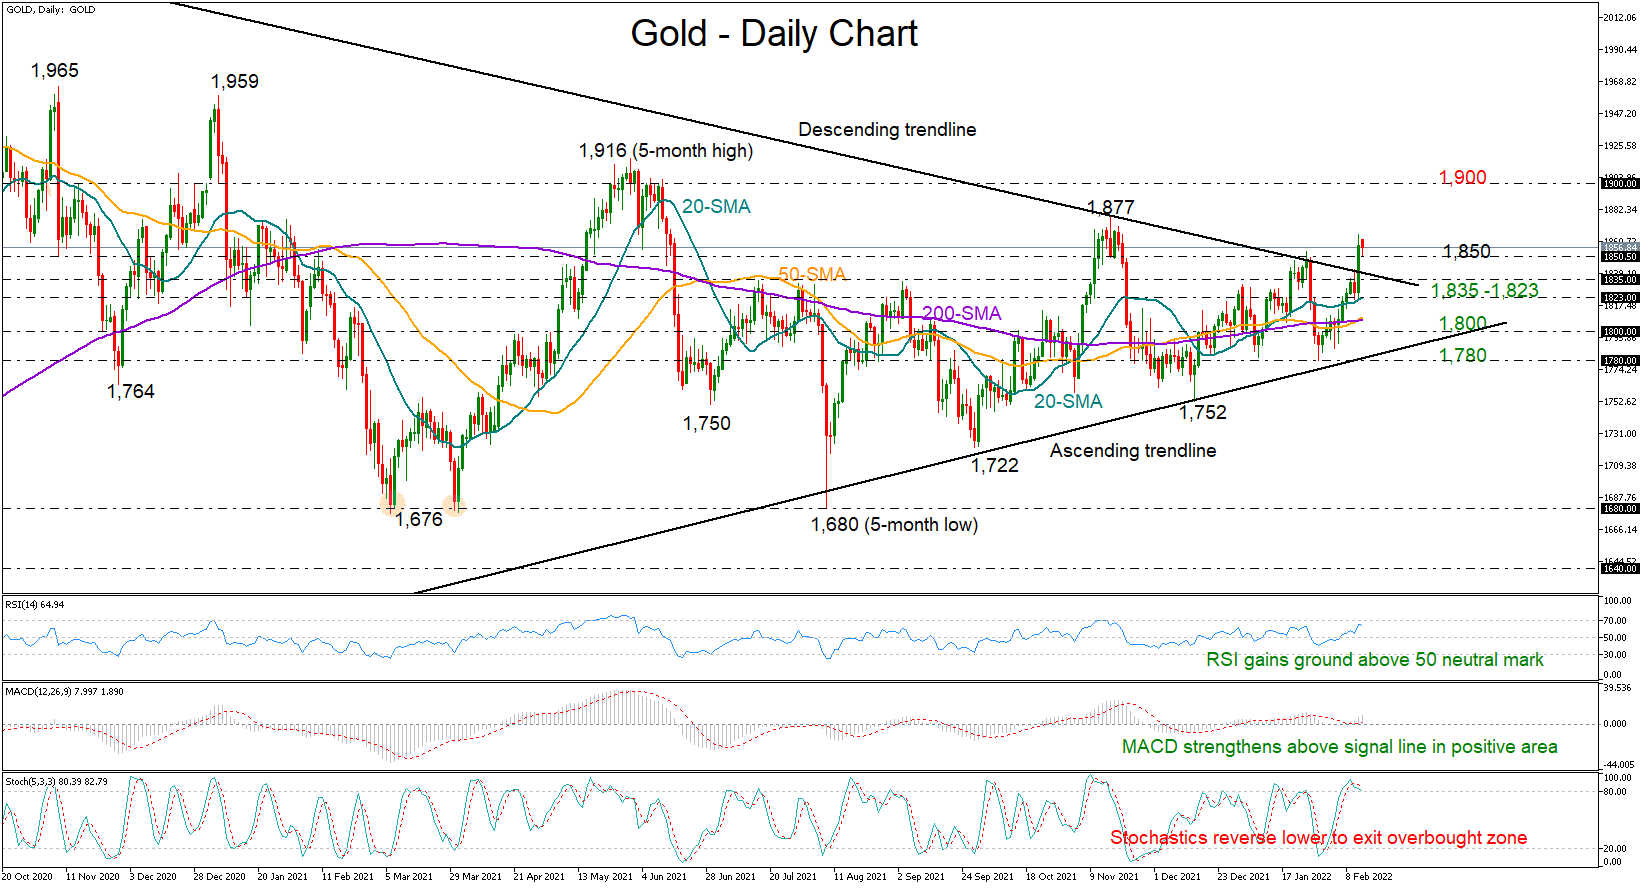
Gold ran with full speed on Friday to breach the descending trendline and claim a new higher high at 1,865, marking its largest daily increase since October.
The precious metal opened the new week on a negative note, though the 1,850 resistance switched immediately to support, providing some relief that Friday’s bullish breakout could be more durable. Downside pressures could persist as the Stochastics have drifted lower and are set to exit the overbought zone. Yet the steep ascent in the RSI, which has yet to touch overbought levels, and the continuous strength in the MACD suggests traders may not immediately adopt selling tendencies. Besides, the series of higher lows since the plunge to 1,680 in August may keep feeding medium-term bulls despite the market’s neutral structure.
On the upside, the next target is November’s high of 1,877. The bulls will need to clear that obstacle to continue towards the crucial resistance territory of 1,900 – 1,916. A decisive close above the latter is needed to violate the broad downward pattern from the 2,079 record high. If efforts prove successful, the way will clear towards the 2021 top of 1,959 and the nearby hurdle of 1,965.
In the event sellers drive the price below 1,850, the bulls will have another opportunity for a rebound somewhere between the broken descending trendline at 1,835 and the 20-day simple moving average at 1,823. If the market fails to gain enough buying traction within the region, the decline could extend towards 1,800, while deeper, sellers may push for another break below 1,780 and the upward-sloping trendline drawn from the 2020 March low of 1,450.
All in all, gold bulls are showing some signs of exhaustion at the moment following Friday's impressive comeback. That said, unless the price closes below 1,823, they will probably keep trying to push higher.
WTI Oil Outlook: Oil Price Would Easily Rise Above $100 If Situations Over Ukraine Deteriorates
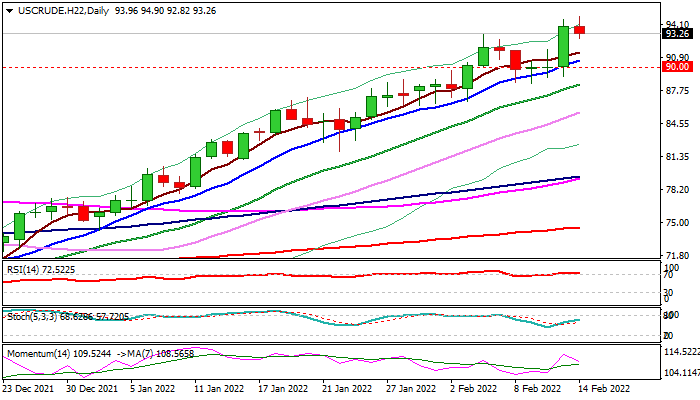
WTI oil price is holding near new highest since September 2014 in early European trading on Monday, following Friday’s 4.3% advance the biggest one-day rally since Aug 23).
Rising geopolitical tensions on possible military conflict over Ukraine, continue to lift oil prices as war would disrupt already tight oil market, after OPEC and its allies announced the struggle to increase output despite strong demands for a monthly production increase by 400,000 barrels per day.
In such scenario, oil prices would easily rise through psychological $100 barrier and focus targets at $107.45 and $110.00.
Technical studies support the action, mainly driven by fundamentals, with loss of bullish momentum on daily chart and overbought conditions on weekly chart, suggesting bulls may take a breather.
Dips are expected to be shallow on overheated situation, with price action to remain highly volatile and sensitive to updates regarding the situation over Ukraine.
Rising 10DMA ($90.68) should ideally contain and guard pivotal supports at $88.30 (last week’s higher base, reinforced by rising 20DMA), loss of which would signal deeper pullback.
Res: 94.90; 96.08; 97.89; 99.59.
Sup: 92.41; 91.68; 90.68; 90.00.
GBP/USD: Indecision Abound
Despite GBP/USD managing a gain of 0.19% on the week, the weekly candlestick formation wasn’t the thick body that would give confidence of any sort of big range breakout this week.
GBP/USD had an inconclusive end to last week. Daily price action looked indecisive as the pair came under strong selling pressure in the 1.3560 to 1.3640 zone. GBP/USD opened the week at 1.35340, then early on edged to a low of 1.34906, then floundered, with the pair eventually hitting a high of 1.3647, before strong selling led it to close at 1.35992.
GBP/USD weekly candle (w/e 11 February)

Despite GBP/USD managing a gain of 0.19% on the week, the weekly candlestick formation wasn’t the thick body that would give confidence of any sort of big range breakout this week. Bigger picture, the 1.3745 and 1.33529 levels, the latest swing high and lows on the weekly chart, still look like big hurdles to break.
In terms of the daily setup, market structure still points to a continuation of the downtrend that has gripped the market since September last year. Price is confined between the 8 December swing low of 1.31610 and high of 1.37489. Furthermore, the pair after breaking above the 1.35740 - 61.8% Fib level of that last impulse and corrective move – failed to sustain on the retest and continues to bump up against the 200-EMA.
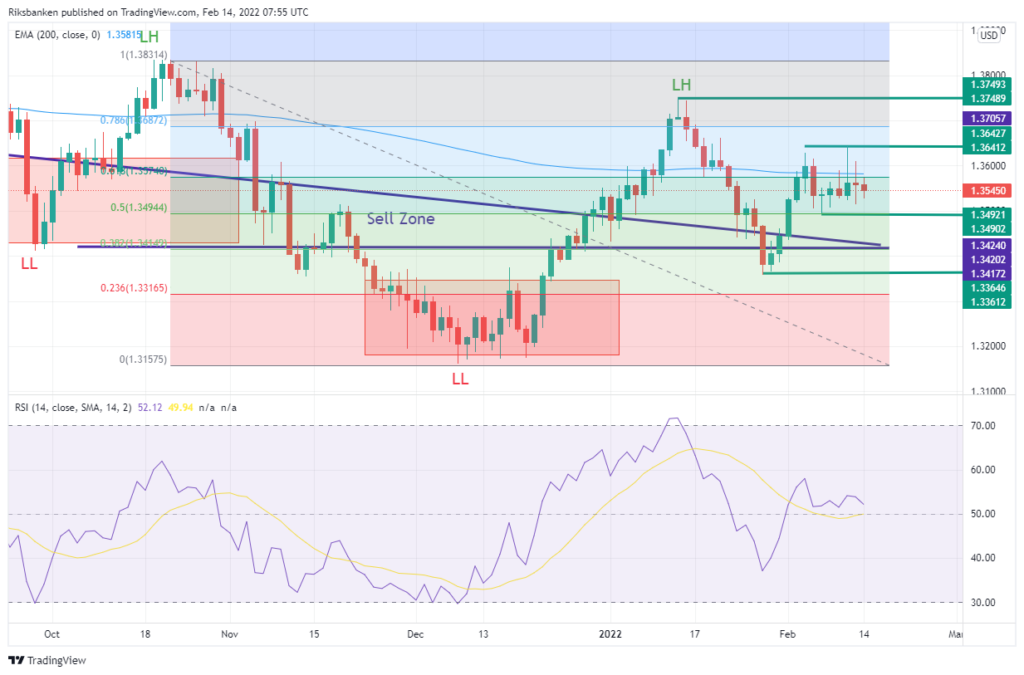
More recently, the pair has been trading in a range between 1.3612 and 1.34902. But a break higher above 1.37489 is needed to confirm any chance of a real shift in trend. While a fall back closer to 1.3433-1.34161, would put price back into a sell zone and would give greater confidence of a resumption of the downward trend.
Nasdaq 100 Retreats Amid Geopolitical Tensions
US equities crashed sharply on Friday as investors reacted to the latest warning by the US intelligence on Russia’s activity near Ukraine. In a statement, the agencies said that Russia had amassed enough troops near the Ukrainian border and the Baltic Sea. They warned that an invasion could happen any time in the coming days. These were the latest revelations by the intelligence community. Two weeks ago, they warned that Russia was planning some fake attacks in a bid to provoke an invasion. Still, analysts believe that any geopolitical crisis in the region will have minimal impact on stocks. This partially explains why US futures pointed higher.
US stocks are also reacting to the ongoing earning releases. Most companies in the S&P 500 index have already published their quarterly results. According to FactSet 72% of companies in the index have already published their results. Of these companies, 77% of them have published results that have beaten analysts’ forecasts. Earnings growth has been about 30%, marking the fourth straight quarter of over 20% earnings growth. The 12-month PE ratio of companies in the S&P 500 is at about 12 months. The next key companies that will publish their results are Airbnb, Roblox, Continental Resources, Vornado Realty Trust, and Arista Networks among others.
The price of crude oil jumped sharply as investors predicted a growing supply and demand imbalance in the coming months. On supply, there are signs that some countries like Nigeria and Angola are struggling to meet their quotas. Therefore, unless other producers boost their production, there is a possibility that prices will remain steady. There is also a risk that Russia’s oil industry will be sanctioned, leading to more challenges since it is the third-biggest oil producer in the world. At the same time, demand is expected to keep rising as the world reopens.
EURUSD
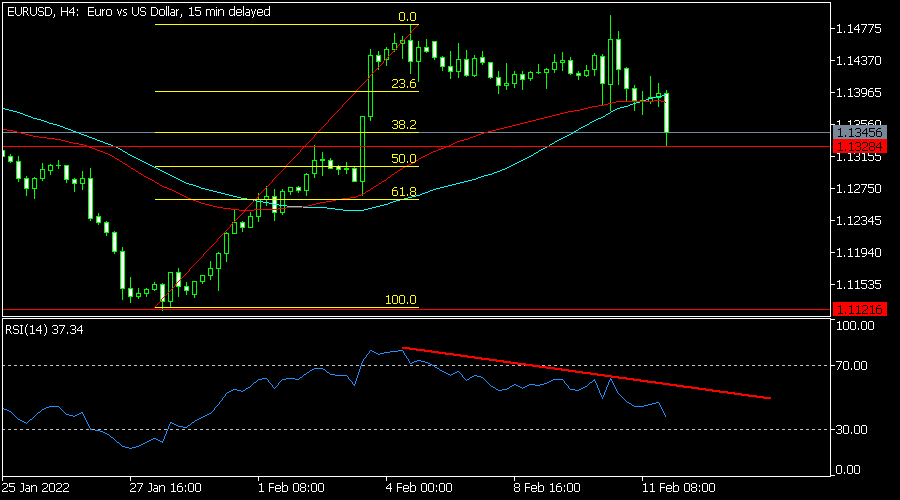
The EURUSD pair declined to a low of 1.1328, which was the lowest level since February 3. The pair has managed to drop substantially from last week’s high of 1.1496. It has moved below the 38.2% Fibonacci retracement level. The Relative Strength Index (RSI) has also formed a bearish divergence pattern and moved below the 25-day moving average. Therefore, the pair will likely keep falling as bears target the key support at 1.1280.
XBRUSD
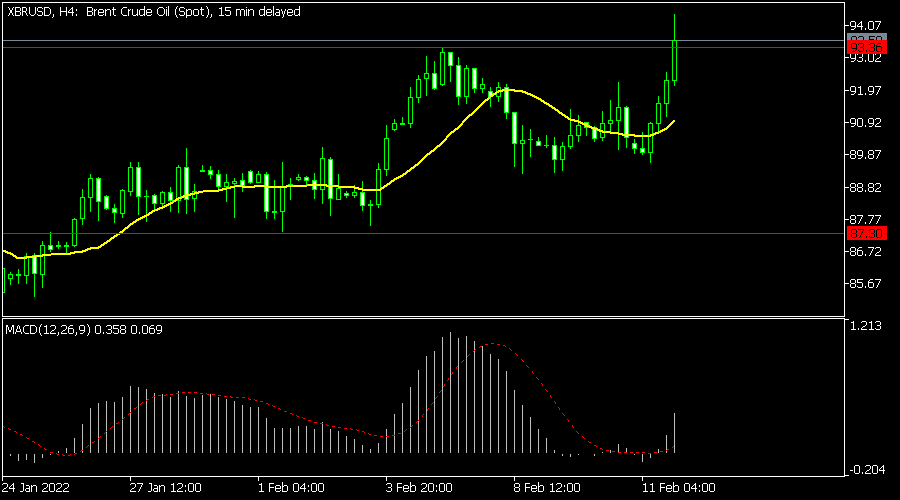
The XBRUSD pair has been in a strong bullish trend in the past few months. The pair soared to a high of 95 last week. It is trading at 93.40, which is slightly above the key resistance level at 92. Additionally, the pair moved above the 25-day and 50-day moving averages while the MACD has moved slightly above the neutral level. Therefore, there is a likelihood that the bullish momentum will continue as bulls target the next resistance at 100.
NAS100
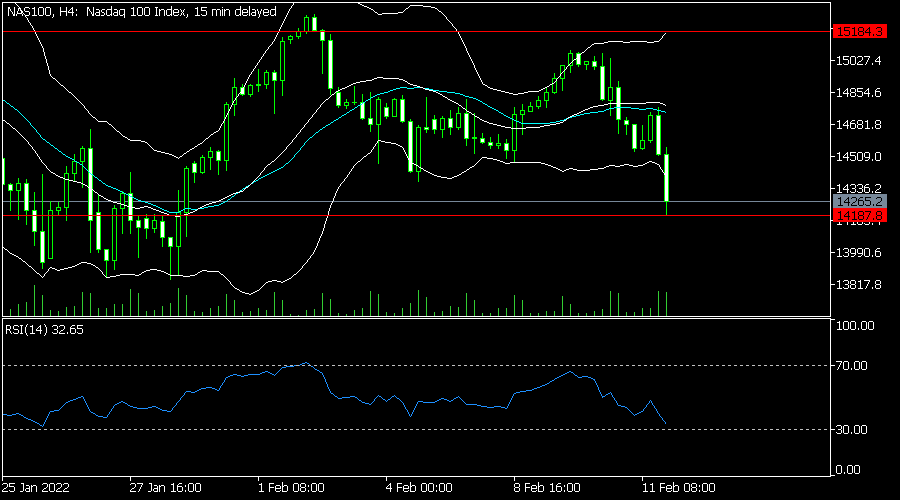
The Nasdaq 100 index declined to a low of 14,187 as geopolitical and Fed risks rose. That price was significantly lower than last week’s high of $15,184. On the four-hour chart, the pair moved below the 25-day and 50-day moving averages. It also moved to the lower side of the Bollinger Bands while the Relative Strength Index (RSI) has continued dropping. Therefore, the pair will likely keep falling in the coming days.