Sample Category Title
The Analytical Overview Of The Main Currency Pairs
The EUR/USD currency pair
Technical indicators of the currency pair:
Prev Open: 1.12221
Open: 1.12141
% chg. over the last day: -0.10
Day's range: 1.12097 – 1.12188
52 wk range: 1.1111 – 1.2009
The EUR/USD has stabilized after a sharp decline since the beginning of this month. The trading instrument is consolidating. Investors expect additional drivers. Local levels of support and resistance are 1.12100 and 1.12400. Demand for USD remains at a fairly high level after the release of optimistic statistics on the US labor market in June. Quoteshave the can decline further. Today we recommend to pay attention to the Fed and open positions must be opened from key levels.
The Economic News Feed for 09.07.2019:
Job Openings and Labor Turnover Survey – 17:00 (GMT+3:00).
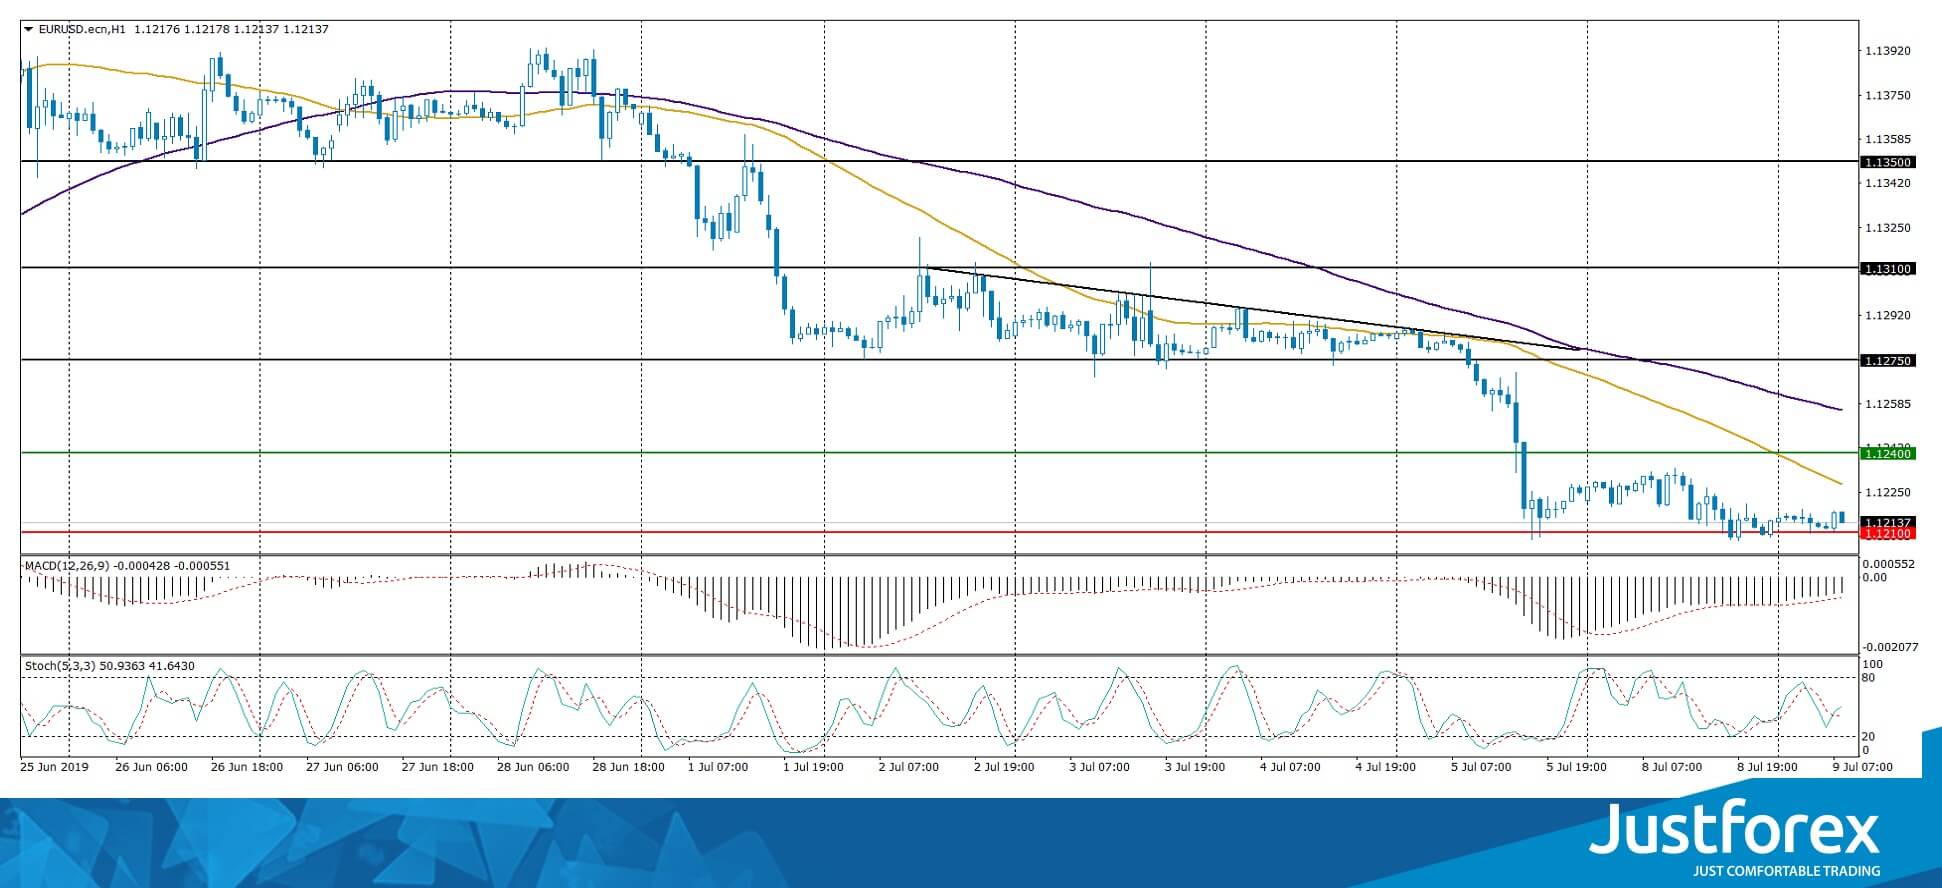
The price has fixed below 50 MA and 100 MA, which indicates the strength of the sellers.
Еhe MACD histogram is in the negative zone, but above the signal line, which gives a weak signal to sell EUR/USD.
The Stochastic Oscillator is in the neutral zone, the %K line crossed the %D line. There are no signals at the moment.
Trading recommendations
Support levels: 1.12100, 1.11600
Resistance levels: 1.12400, 1.12750, 1.13100
If the price consolidates below the local support of 1.12100, it will drop further to 1.11700-1.11500.
Alternatively, the quotes can recover to 1.12700-1.13000.
The GBP/USD currency pair
Technical indicators of the currency pair:
Prev Open: 1.25248
Open: 1.25164
% chg. over the last day: -0.07
Day's range: 1.25023 - 1.25219
52 wk range: 1.2438 - 1.3631
The GBP/USD is in lateral movement. The technical picture is ambiguous. Currently, local support and resistance levels are 1.24900 and 1.25350. GBP still remains under pressure amid uncertainty around Brexit. Earlier, Boris Johnson, who is likely to take the post of Prime Minister of Great Britain, said that the country will probably withdraw from the EU without a deal by October 31. Open positions from key levels.
The Economic News Feed for 09.07.2019 is calm.
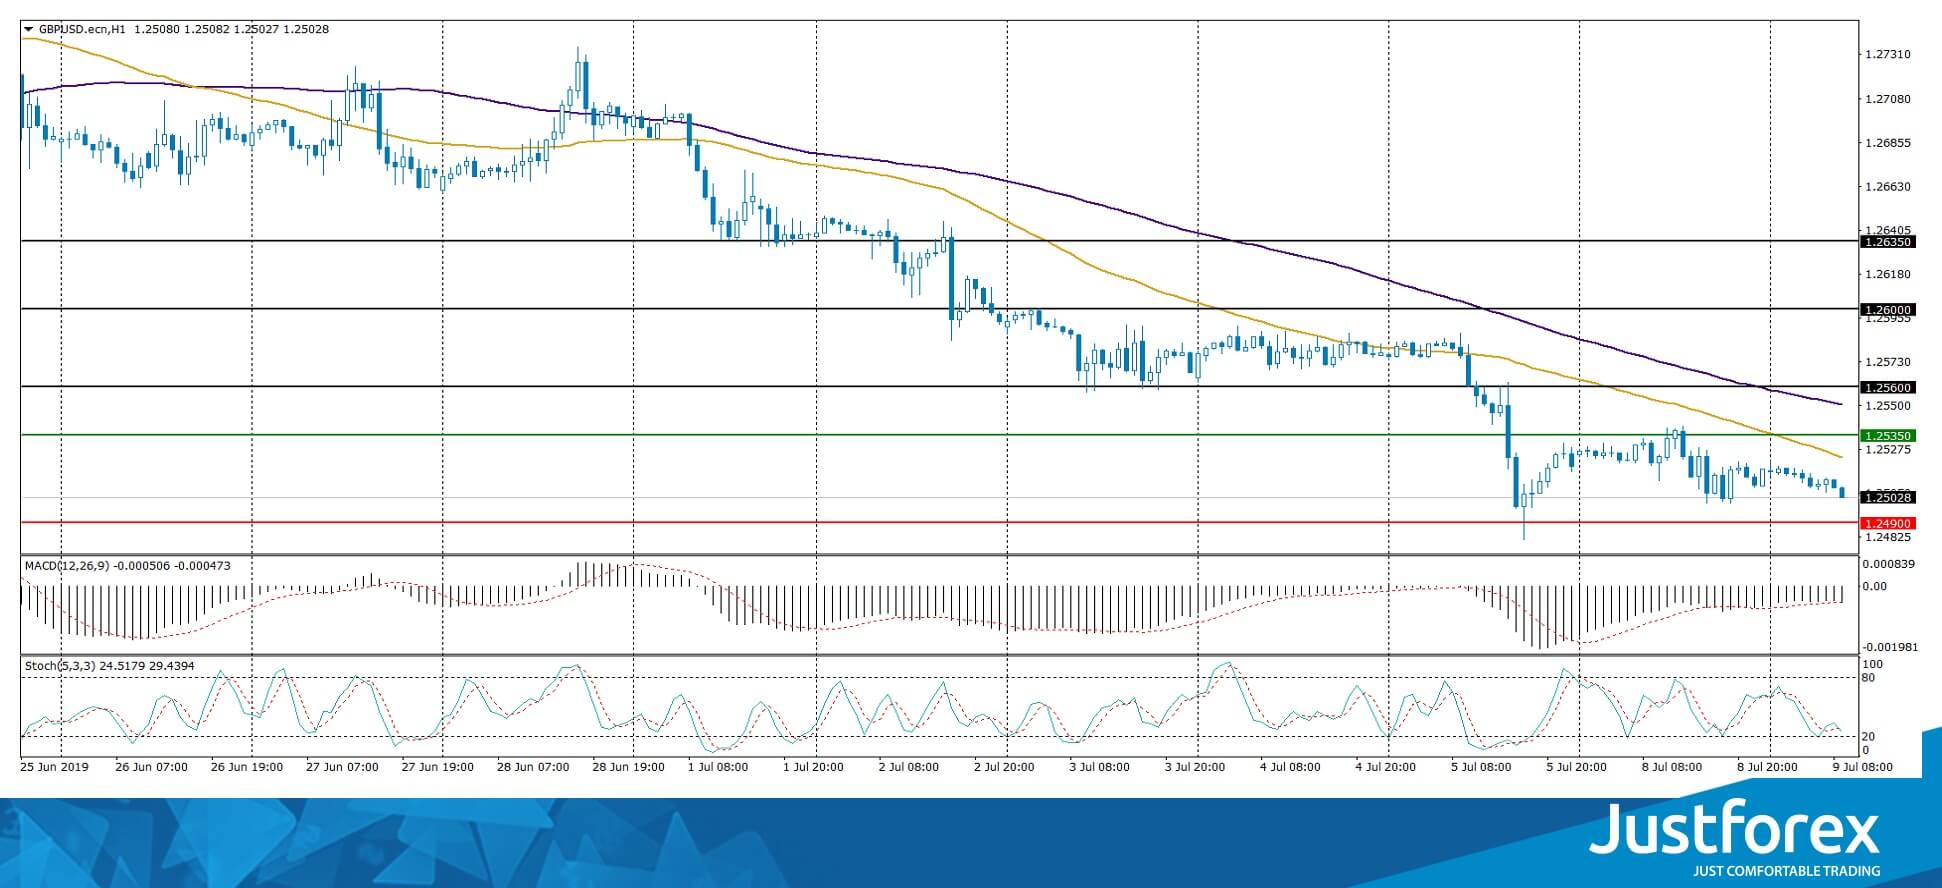
The price has fixed below 50 MA and 100 MA, which indicates the strength of the sellers.
The MACD histogram is in the negative zone and continues to decline, which gives a strong signal to sell GBP/USD.
The Stochastic Oscillator is in the neutral zone, the %K line crossed the %D line. There are no signals at the moment.
Trading recommendations
Support levels: 1.24900, 1.24500
Resistance levels: 1.25350, 1.25600, 1.26000
If the price consolidates below 1.24900, the price will fall toward 1.24600-1.24400.
Alternatively, the quotes can correct toward 1.25600-1.25800.
The USD/CAD currency pair
Technical indicators of the currency pair:
Prev Open: 1.30660
Open: 1.30888
% chg. over the last day: +0.20
Day's range: 1.30887 - 1.31103
52 wk range: 1.2727 - 1.3664
The USD/CAD currency pair has once again shifted to growth. During yesterday's and today's trading, the growth exceeded 45 points. The local support and resistance levels are 1.30850 and 1.31150. The trading instrument can correct further. We recommend to pay attention to the dynamics of oil prices. Positions must be opened from key levels.
The Economic News Feed for 09.07.2019:
statistics on the real estate market - 15:15 (GMT+3:00) and 15:30 (GMT+3:00).
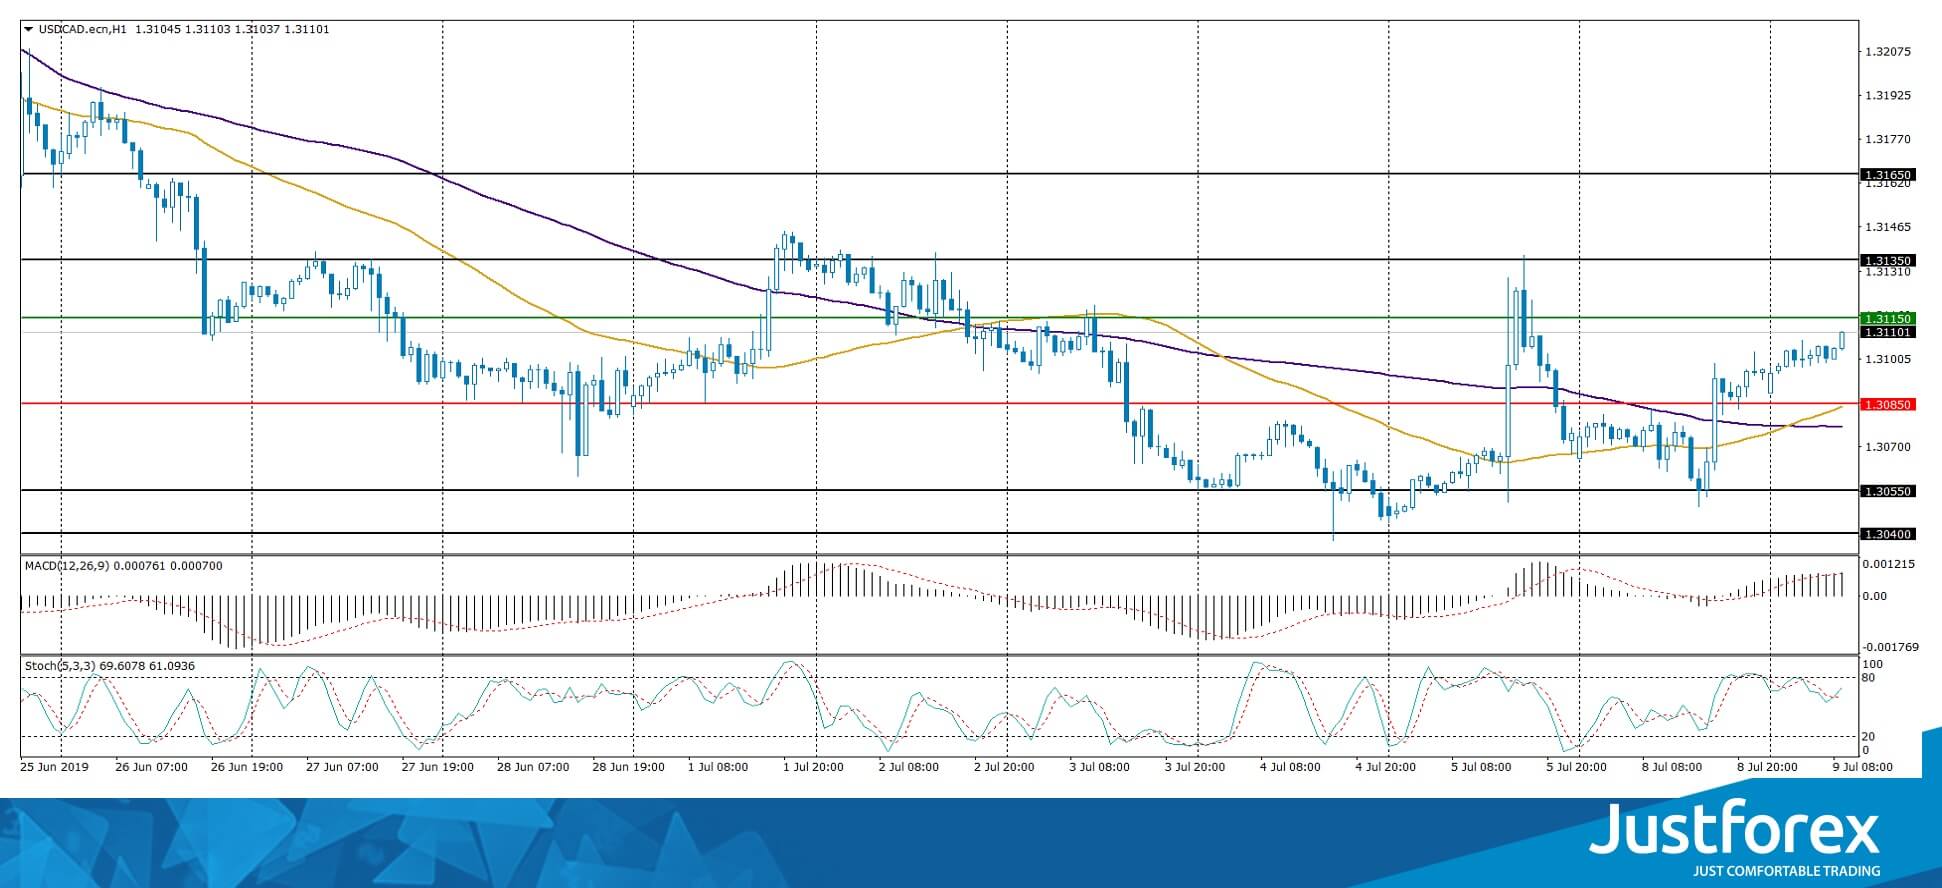
The price has fixed above 50 MA and 100 MA, which indicates the power of buyers.
The MACD histogram is in the positive zone and continues to rise, indicating bullish sentiment.
The Stochastic Oscillator is in the neutral zone, the %K line crossed the %D line. There are no signals at the moment.
Trading recommendations
Support levels: 1.30850, 1.30550, 1.30400
Resistance levels: 1.31150, 1.31350, 1.31650
If the price consolidates above the level of 1.31150, expect growth towards to 1.31350-1.31500.
Alternatively, the quotes could fall toward 1.30600-1.30400.
The USD/JPY currency pair
Technical indicators of the currency pair:
Prev Open: 108.435
Open: 108.720
% chg. over the last day: +0.21
Day's range: 108.677 - 108.895
52 wk range: 104.97 - 114.56
The USD/JPY currency pair continues to show a positive trend. Trading instrument again updated local maxima. At the moment, the USD/JPY quotes are consolidating. The key support and resistance levels are 108.500 and 108.900, respectively. We do not exclude the further growth of the USD/JPY currency pair. We recommend to pay attention to the dynamics of the yield of US government bonds. Positions must be opened from key levels.
The Economic News Feed for 09.07.2019 is calm.
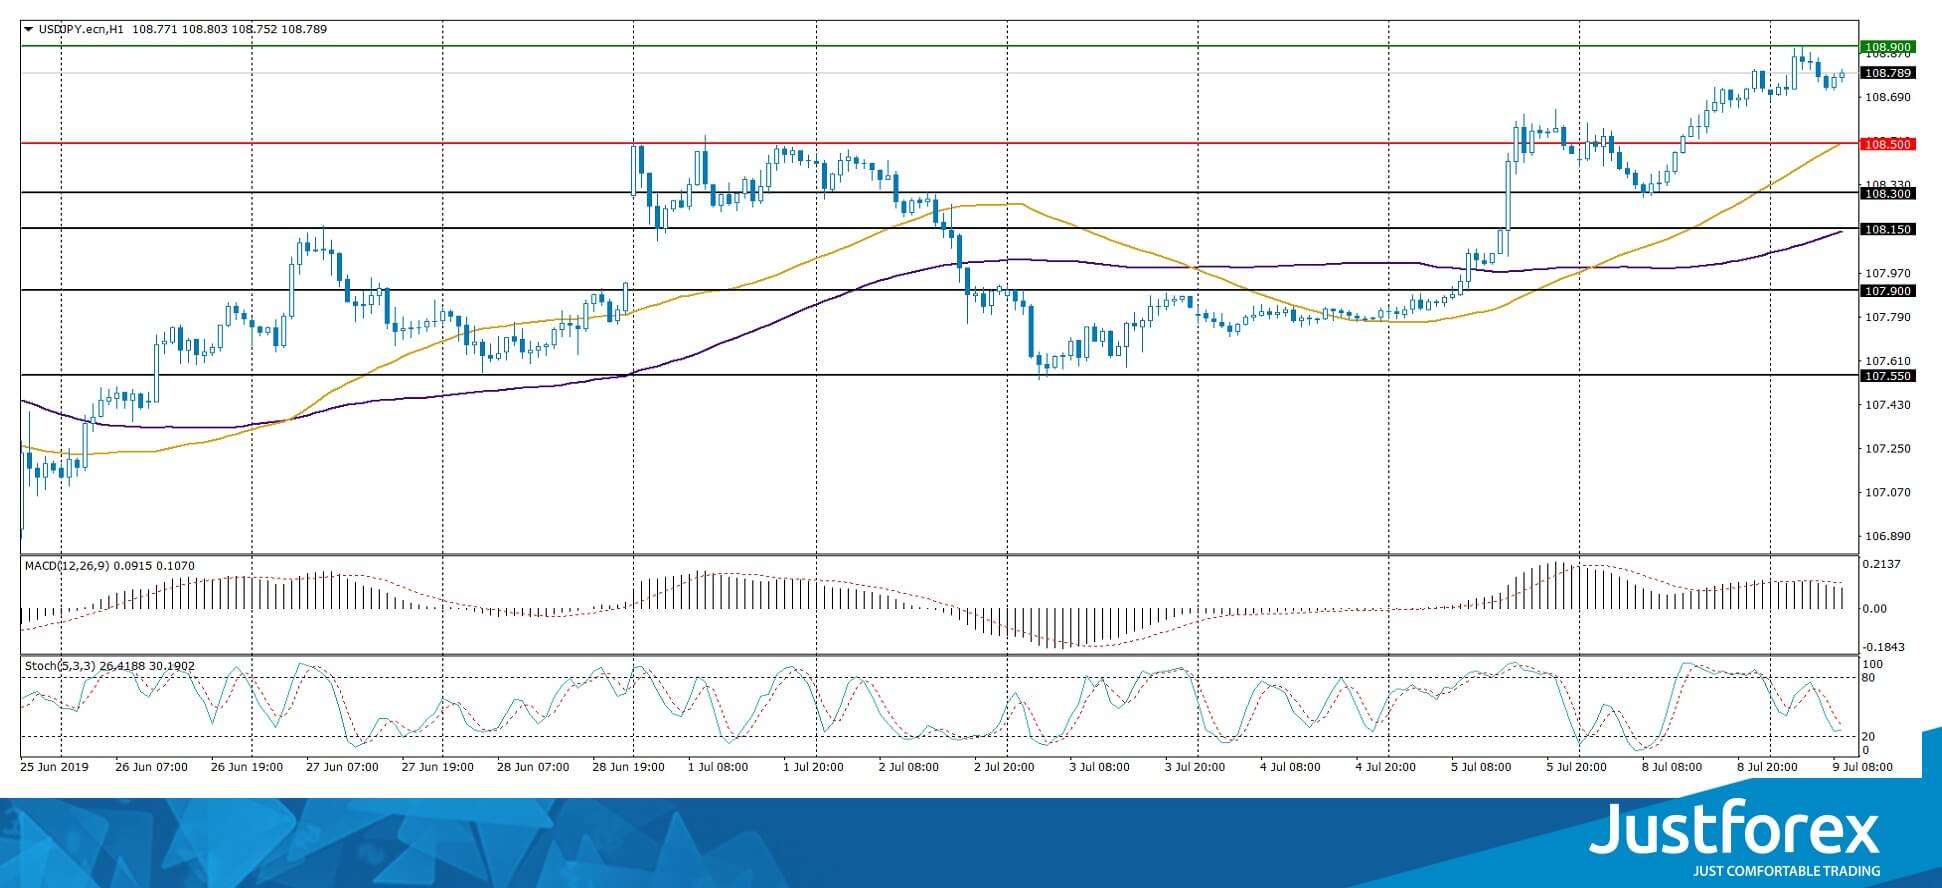
The price has fixed above 50 MA and 100 MA, which indicates the strength of buyers.
The MACD histogram is in the positive zone, but below the signal line, which gives a weak signal to buy USD/JPY.
The Stochastic Oscillator is in the neutral zone, the %K line is below the %D line, which indicates bearish moods.
Trading recommendations
Support levels: 108.500, 108.300, 108.150
Resistance levels: 108.900, 109.400, 109.600
If the price consolidates above the level of 108.900, the quotes can grow to 109.300-109.500.
Alternatively, the quotes can descend to 108.300-108.100
GBPUSD Flirts With 6-Month Low, Holds In Descending Channel
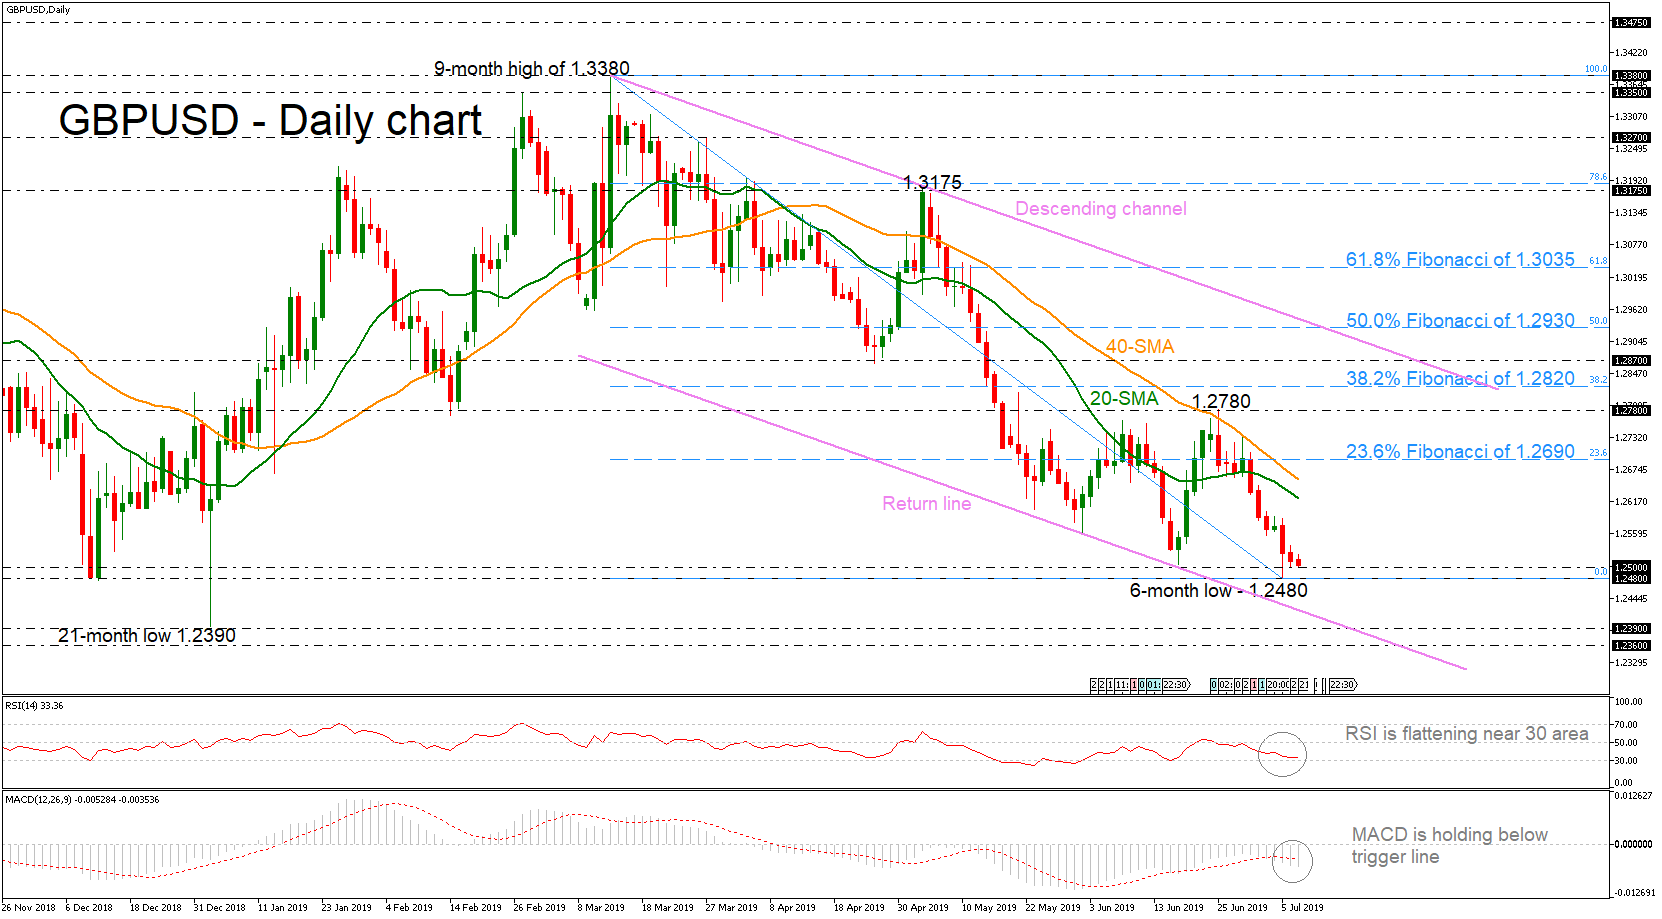
GBPUSD plunged to a six-month low of 1.2480 on Friday, continuing the strong sell-off from March 13.
The pair is currently hovering near the return line of the descending channel and the short-term moving averages are following the downfall of the price action. The RSI is standing near the 30 level but is flattening, suggesting that there is a possibility of a weaker bearish move in the daily chart. However, the MACD oscillator is strengthening its negative movement below the zero and trigger lines.
A successful drop below the latest leg around 1.2500, could lead to cable flirting with a new lower low near the 1.2400 handle and the lower boundary of the channel. Slightly below this level, the 21-month low of 1.2390 and the 1.2360 support levels would come into focus.
In the positive scenario, if there is an upside correction the pair could meet the 20- and 40-simple moving averages (SMAs) currently at 1.2620 and 1.2655 respectively. More bullish pressure could push the market until the 23.6% Fibonacci retracement region of the downleg from 1.3380 to 1.2480 near 1.2690.
Summarizing, GBPUSD has been developing in a bearish movement over the last three months and investors are still looking for selling opportunities as the price failed to post a significant upside rally.
Gold Declines For 4 Consecutive Sessions
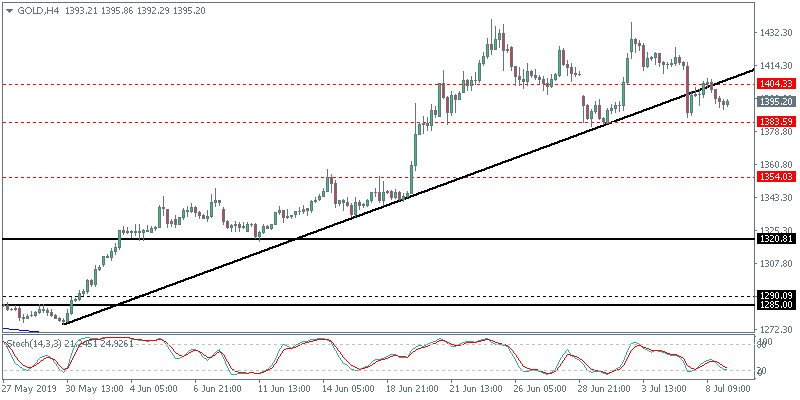
The precious metal was seen maintaining its bearish momentum on Monday, although price action was relatively subdued. Gold prices fell 0.24% on the day. Economic data on the day was sparse with most of the technical trading coming out from Friday’s payrolls report.
Will Gold Extend Further Losses?
Price action in the precious metal currently indicates that there could be further downside. Following the breach of the rising trend line, gold briefly retested the breakout level before easing back lower. The immediate support at 1383.60 remains the key level of interest. If this support gives way, gold prices could extend further declines.
Sterling Hovers Near 6-Month Low
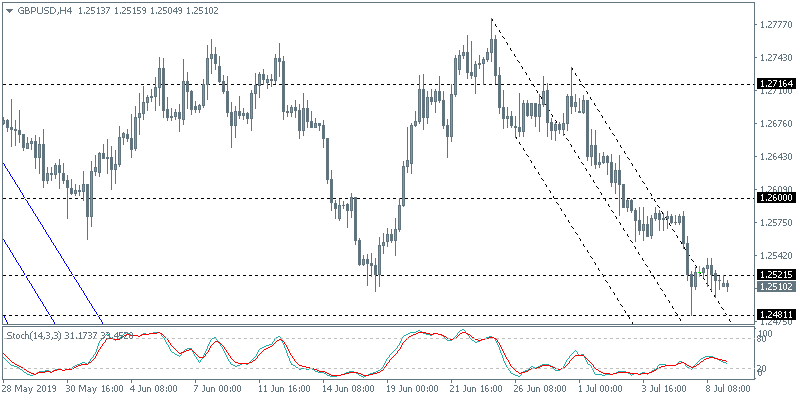
The pound sterling was seen staying flat, hovering near a 6-month low on Tuesday. The pair was flat amid lack of any economic data to go by. The UK is set to elect a new Prime Minister and Boris Johnson remains the frontrunner. The currency pair could remain near the current lows, awaiting further catalysts.
Will GBPUSD Bounce Back?
The currency pair remains steady near the 6-month low. The declines have invalidated the evolving inverse head and shoulders pattern. However, we could expect to see a modest bounce off this level in the near term. At the time of writing GBPUSD is trading near 1.2125. Following a break down below this level, the next lower support is seen at 1.2481.
Euro Muted To German Industrial Production
Germany's industrial production data released on Monday saw a 0.3% increase on the month. However, construction output offset the gains in the manufacturing sector. On a year over year basis, Germany's industrial output is down 3.2%. Meanwhile, the eurozone's Sentix investor confidence report showed a decline to -5.8 from -3.3 earlier.
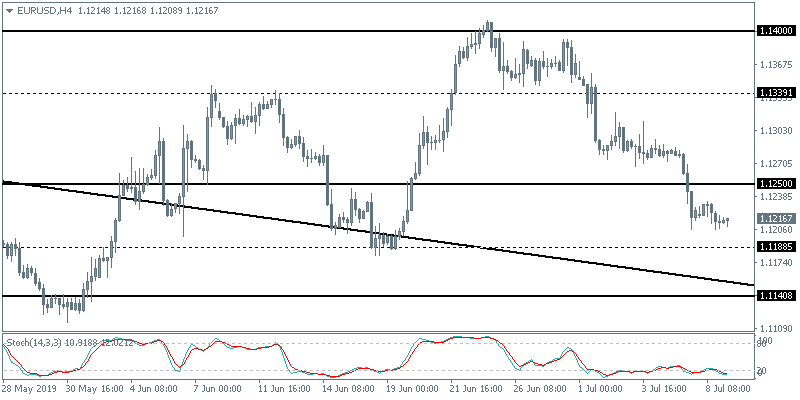
EURUSD Likely to Extend Declines
The currency pair is likely to continue its downside. The minor support level at 1.1188 will be tested in the near term. If the support level holds, then we could expect to see a modest rebound in the currency pair. However, the EURUSD will still maintain a sideways range above 1.1188. To the downside, a break down below 1.1188 support will see the EURUSD extending losses to 1.1140.
Markets Await Potential Powell Perk-Up
Asian stocks are slipping, after the S&P 500 continued easing off its record high, as investors await fresh reasons to significantly move markets in either direction. The Dollar Index is holding steady around the 97.37 mark, with Asian currencies mostly lower against the Greenback. With scarce developments out of the US-China trade talks, Fed chair Jerome Powell's speeches are set to be the pick of the week in terms of potential market catalysts.
The better-than-expected June non-farm payrolls (NFP) data shows that the US jobs market remains resilient, which could prompt the central bank to use a smaller knife when cutting interest rates. Markets appear to have out-doved Powell, leaving the Fed chair with the task of managing market expectations ahead of the FOMC at the end of July. This week's Fedspeak could have an outsized impact on market sentiment over the coming days, as investors try to satisfy their hunger for any further clues on the US monetary policy outlook.
Given the latest NFP print, doubts are creeping into the minds of investors as to how the Fed will move, if at all, later this month. As things stand, Fed Funds Futures still point to a 25-basis point cut to US interest rates this month, as investors dial back expectations for a more drastic 50-basis point reduction to benchmark interest rates.
Gold prices on a wild ride to nowhere
Gold traders are undecided about keeping prices sustainably above $1400, even as Bullion endures its steepest moves since 2016. Safe haven assets are expected to hold less appeal should the Federal Reserve step back from its easing stance.
With scant signs of an immediate deterioration on the US-China trade front, investors are seizing the opportunity to ease off on the risk-aversion pedal. At the time of writing, Gold is trading below $1394, US 10-year Treasury yields are below 2.04 percent, and the Japanese Yen is closing in on the 108.9 level. Yet, markets cannot discount the possibility of an unexpected surge in trade tensions, which means that markets have to remain fleet-footed or risk falling behind in the ensuing selloff from risk assets.
Pound to remain politically-sensitive as hunt for new UK PM enters final weeks
The Pound could see further bouts of politics-induced volatility in the near-term, as the hunt for a new UK Prime Minister enters its final weeks. At the time of writing, GBPUSD remains rooted near its lowest levels since December, barring the flash crash in January, as the currency pair hovers just above the 1.25 level.
Sterling's politically-sensitive nature won't end once the next UK PM is installed, as markets will still have to contend with Brexit uncertainties until the October 31 deadline. While a significant measure of Brexit risks have already been priced, the Pound may still have more of its downside exposed, should the prospect of a no-deal Brexit ramp up meaningfully over the coming months.
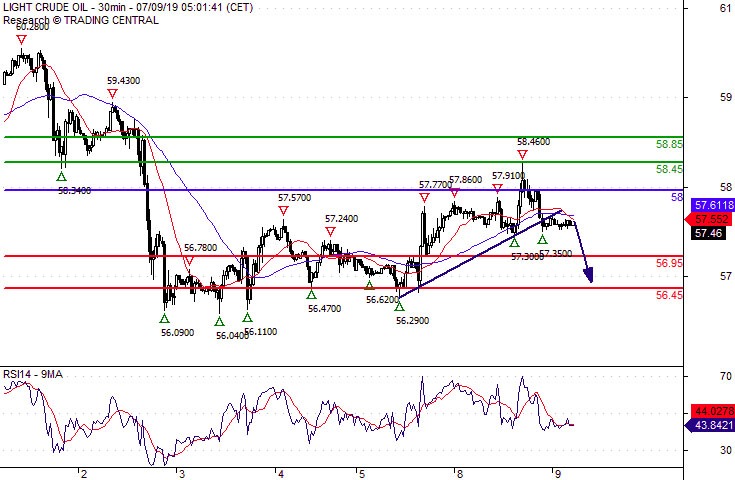
Crude Oil Expect 56.45
Pivot (invalidation): 58.00
Our preference Short positions below 58.00 with targets at 56.95 & 56.45 in extension.
Alternative scenario Above 58.00 look for further upside with 58.45 & 58.85 as targets.
Comment The RSI is bearish and calls for further downside.
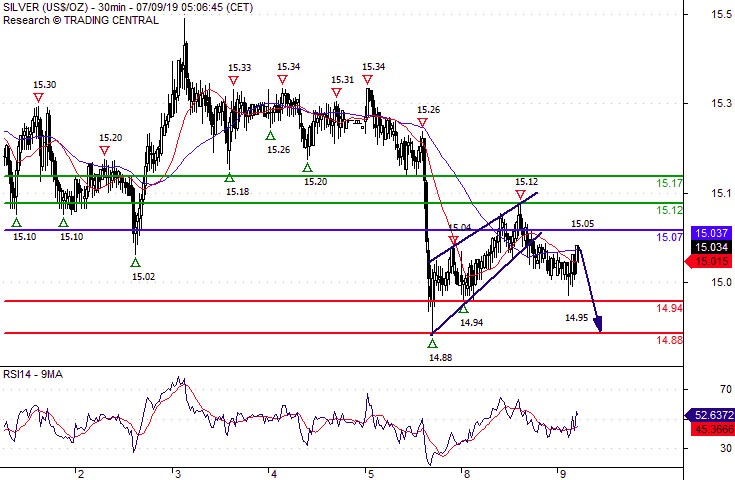
Silver Spot Key Resistance At 15.0700
Pivot (invalidation): 15.0700
Our preference Short positions below 15.0700 with targets at 14.9400 & 14.8800 in extension.
Alternative scenario Above 15.0700 look for further upside with 15.1200 & 15.1700 as targets.
Comment As Long as 15.0700 is resistance, look for choppy price action with a bearish bias.
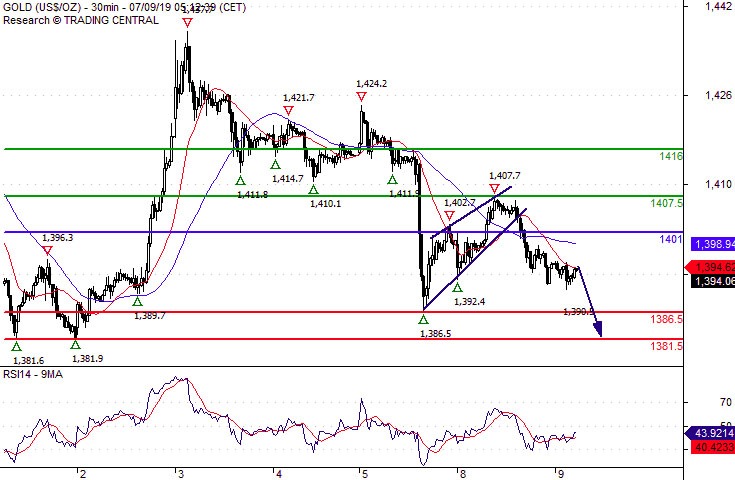
Gold Spot 1381.50 In Sight
Pivot (invalidation): 1401.00
Our preference Short positions below 1401.00 with targets at 1386.50 & 1381.50 in extension.
Alternative scenario Above 1401.00 look for further upside with 1407.50 & 1416.00 as targets.
Comment As Long as 1401.00 is resistance, expect a return to 1386.50.
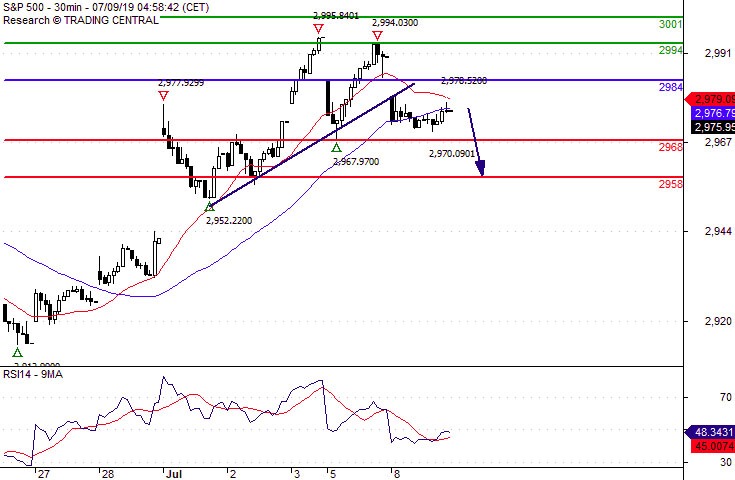
S&P 500 Key Resistance At 2984.00
Pivot (invalidation): 2984.00
Our preference Short positions below 2984.00 with targets at 2968.00 & 2958.00 in extension.
Alternative scenario Above 2984.00 look for further upside with 2994.00 & 3001.00 as targets.
Comment The RSI is bearish and calls for further downside.