Sample Category Title
EUR/USD Unlikely To Surpass 1.1280
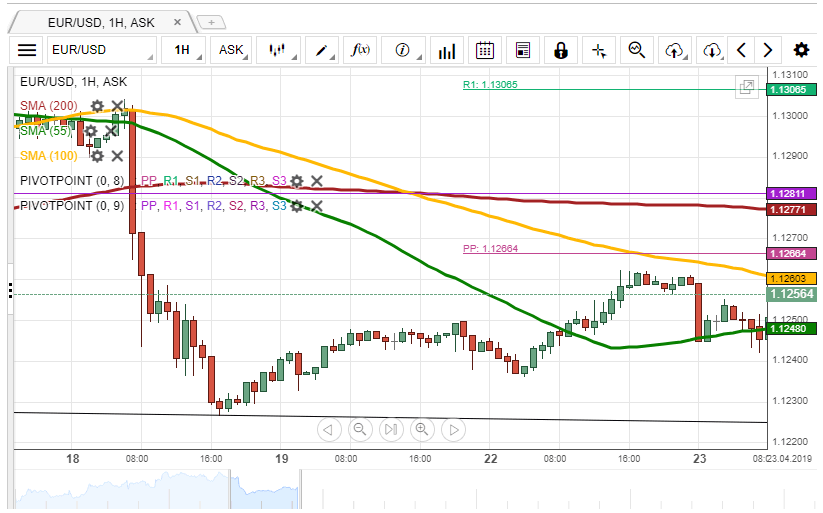
On Monday, the EUR/USD currency pair tried to surpass the resistance formed by a combination of the weekly PP and the 100-hour SMA at 1.1266.
Given that the pair is supported by the 55-hour SMA, currently located at 1.1248, it is likely, that it re-tests the given resistance. If it does not hold, the exchange rate could reach the monthly PP and 200-hour SMA located circa 1.1280.
However, if the given support level does not hold, it is expected that bears prevail in the market in the short run. A possible downside target is the lower boundary of the short-term descending channel located circa 1.1225.
GBP/USD Could Reach 1.2960
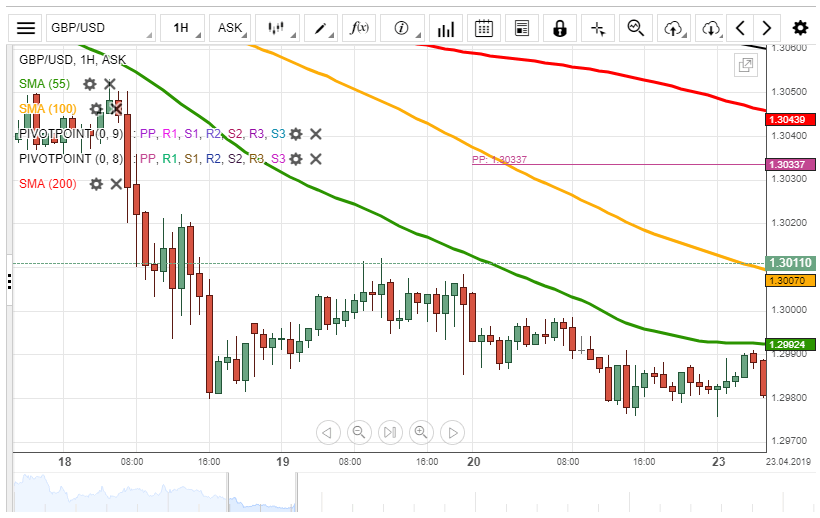
During previous day, the GBP/USD exchange rate tested the resistance level—the 55-hour SMA, currently located at 1.2992.
From a technical perspective, it is unlikely, that the British Pound could appreciate against the Greenback due to the given resistance. The rate could reverse south and target the psychological level at 1.2960.
Otherwise, it is expected, that the currency pair could continue to trade sideways, trying to surpass the given resistance. Also, it is unlikely, that the pair could jump higher than 1.3008 due to the 100-hour SMA.
USD/JPY Likely To Trade Down
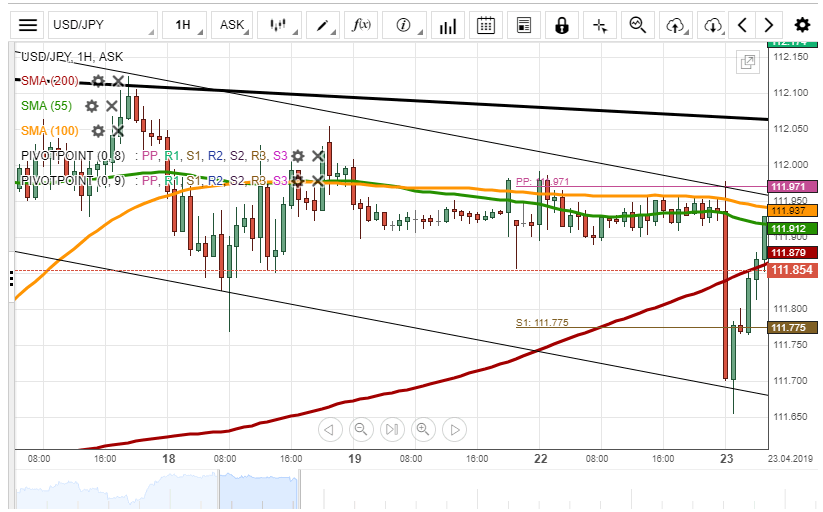
Yesterday, the USD/JPY currency pair plunged to the psychological level at 111.70. However, during Tuesday's morning, the pair reversed north to the 55– and 100-hour SMAs located circa 111.90.
From a theoretical point of view, it is likely, that the exchange rate trades down within the short-term descending channel. A possible downside target is the weekly S1 located at the 111.78 mark.
It is unlikely, that the pair could breach the given channel north due to the resistance level formed by a combination of the given moving averages and the weekly PP.
XAU/USD: Falling Wedge Pattern In Sight
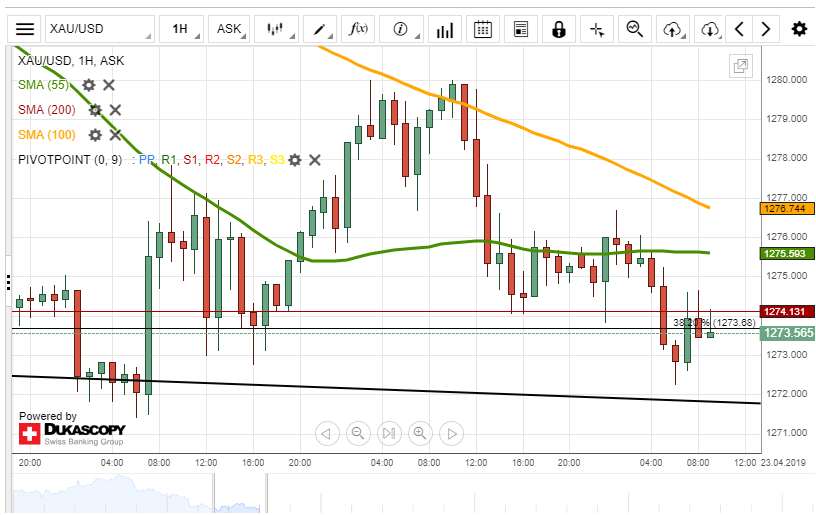
At the beginning of current week, the XAU/USD exchange rate traded between the 55– and 100-hour SMAs.
From a theoretical perspective, the rate should reverse north from the lower boundary of the falling wedge pattern. However, the price for gold has to surpass the given moving averages.
If the given resistance and pattern hold, it is likely, that the rate could trade sideways around the Fibonacci 38.20% retracement at 1,273.68. If the given pattern does not hold, it is expected, that a breakout south occurs in the short run.
Trump Shakes The Oil Market Again
Trump shakes the oil market again
Investors remained on the sidelines after a long weekend. Markets were still closed in numerous countries yesterday (Easter Monday). On Tuesday, risk aversion remained elvated in the FX market with the Japanese yen and the greenback gaining ground against most of their peers following Donald Trump’s decision to end waiver for major importers of Iranian crude. USD/JPY tumbled 0.30% to 111.65 before bouncing back to 111.85. The US dollar rose the most against high quality commodity currencies such as the Aussie and the Kiwie (+0.34% and 0.33%). The single currency edged lower by 0.13% to 1.1243. Overall, the entire FX market has been trading within a tight range over the last few days as investors await further information regarding the potential slowdown of the global economy. The earning season, which just started, may provide some hint regarding the short to medium term outlook and could possibly reassure investors.
Crude oil prices, for both the WTI and Brent, continued to test higher grounds as market participants anticipated that the eight countries that benefits from the waiver would have to switch to other producers, which would inevitably drive prices higher. The WTI traded above $65 for the first time since late October last year, up 0.60% on the day, while its counterpart from the North Sea inched up 0.25% to $74.23 a barrel.
Unsurprisingly, Trump wrote in a tweet that “Saudi Arabia and others in OPEC will more than make up the Oil Flow difference in our now Full Sanctions on Iranian Oil.” Reading between the lines, we note that it will also benefit the US by driving demand for US oil higher. Iran produced slightly less than 2.7 million barrel per day in March and export around 1.3 mb/d. China import almost half of Iran’s oil exports, this is therefore highly likely that this country will get a waiver extension. The purpose of the US government is to force Iran to sat down to the negotiation table and accept the list of 12 demands before the US lifts sanctions. Given the fact that those demands go against 20 years of Iranian foreign policy, there no chance they will accepted. If Iran cannot exports a single barrel, it could block the Strait of Hormuz and hence disturb significantly the oil markets.
Concerns over inflation outlook weighs on INR
Losing close to 0.75% against the buck since last week, the indian rupee is facing further difficulties. The latest policy minutes of the Reserve Bank of India (RBI) provide a good insight of where monetary policy is heading while risks over oil and food prices make committee members worried.
The dovish-biased RBI second rate cut in April does not appear as a major breakthrough, although uncertainties on political stage as well as rising oil prices and potential oil supply shortages should rather favor a wait-and-see approach. Furthermore, the RBI is expected to inject further long-term liquidity worth $ 5 billion in the form of USD/INR buy-sell currency swap, the second similar operation in a month, a move that should accelerate rupee’s depreciation. It is therefore to question whether the INR will remain within the 69 range or whether it should go back towards February 2018 levels of 64. Indeed, although oil prices below $80 are not expected to disrupt consumer prices directly, the removal by the US of Iran oil waivers could weigh on the Indian economy. Iran is the third supplier of the country (11% of total supply) and Iran’s second largest buyer.
Hence, considering current circumstances it seems reasonable to say that INR vulnerability is there to stay. The dovish-bias adopted by the majority of RBI members, the outlook of another rate cut of 25 bps in June 2019 and risks over oil supply should have a negative impact on the indian rupee.
Currently trading at 69.72, USD/INR is heading along 69.86 short-term.
The Analytical Overview Of The Main Currency Pairs
The EUR/USD currency pair
Technical indicators of the currency pair:
Prev Open: 1.12399
Open: 1.12567
% chg. over the last day: +0.12
Day's range: 1.12429 – 1.12605
52 wk range: 1.1214 – 1.2557
Yesterday the trading on the majors was relatively calm. The financial markets in Australia, Hongkong and other major countries were closed due to the holidays. The USD index #DX closed the trading session with a slight descend. The pressure on USD was caused by the weak real estate market report from the US. Right now the EUR/USD quotes are consolidating at 1.12350-1.12600. The EUR has a tendency to descend further. You should open positions from the key levels.
Today the investors will evaluate the new real estate sales in US for March at 17:00 (GMT+3:00).
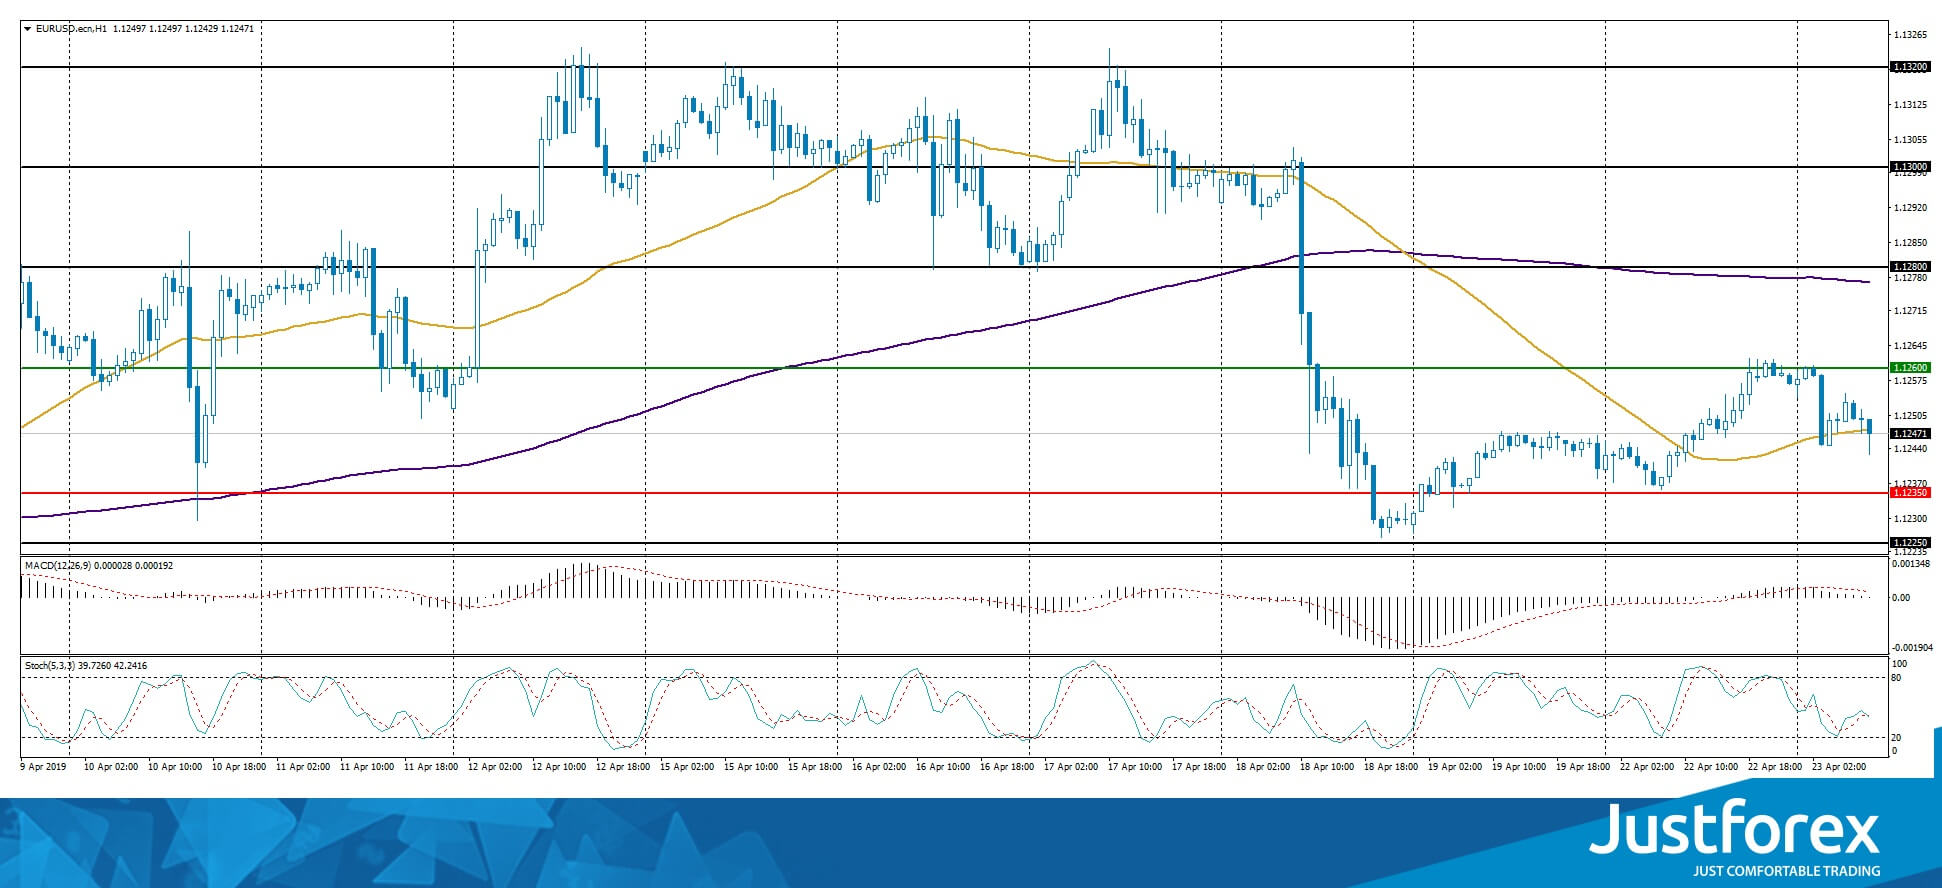
The indicators do not provide precise signals, the price has crossed 50 MA.
The MACD histogram is close to 0.
The Stochastic Oscillator is in the neutral zone, the %K line is crossing the %D line. There are no signals at the moment.
Trading recommendations
Support levels: 1.12350, 1.12000
Resistance levels: 1.12600, 1.12800, 1.13000
If the price fixes below 1.12350, expect further descend toward 1.12000.
Alternatively, the quotes can recover toward 1.12800-1.12900.
The GBP/USD currency pair
Technical indicators of the currency pair:
Prev Open: 1.29848
Open: 1.29812
% chg. over the last day: -0.09
Day's range: 1.29749 – 1.29903
52 wk range: 1.2438 – 1.4378
GBP keeps its positions agains the USD. The technical picture remains ambiguous. The financial market participants are waiting for additional drivers. GBP/USD is testing the local support and resistance leves at 1.29750-1.30000. You should open positions from these levels. Expect the real estate from the US today and track the info regarding Brexit.
The Economic News Feed for 23.04.2019 is calm.
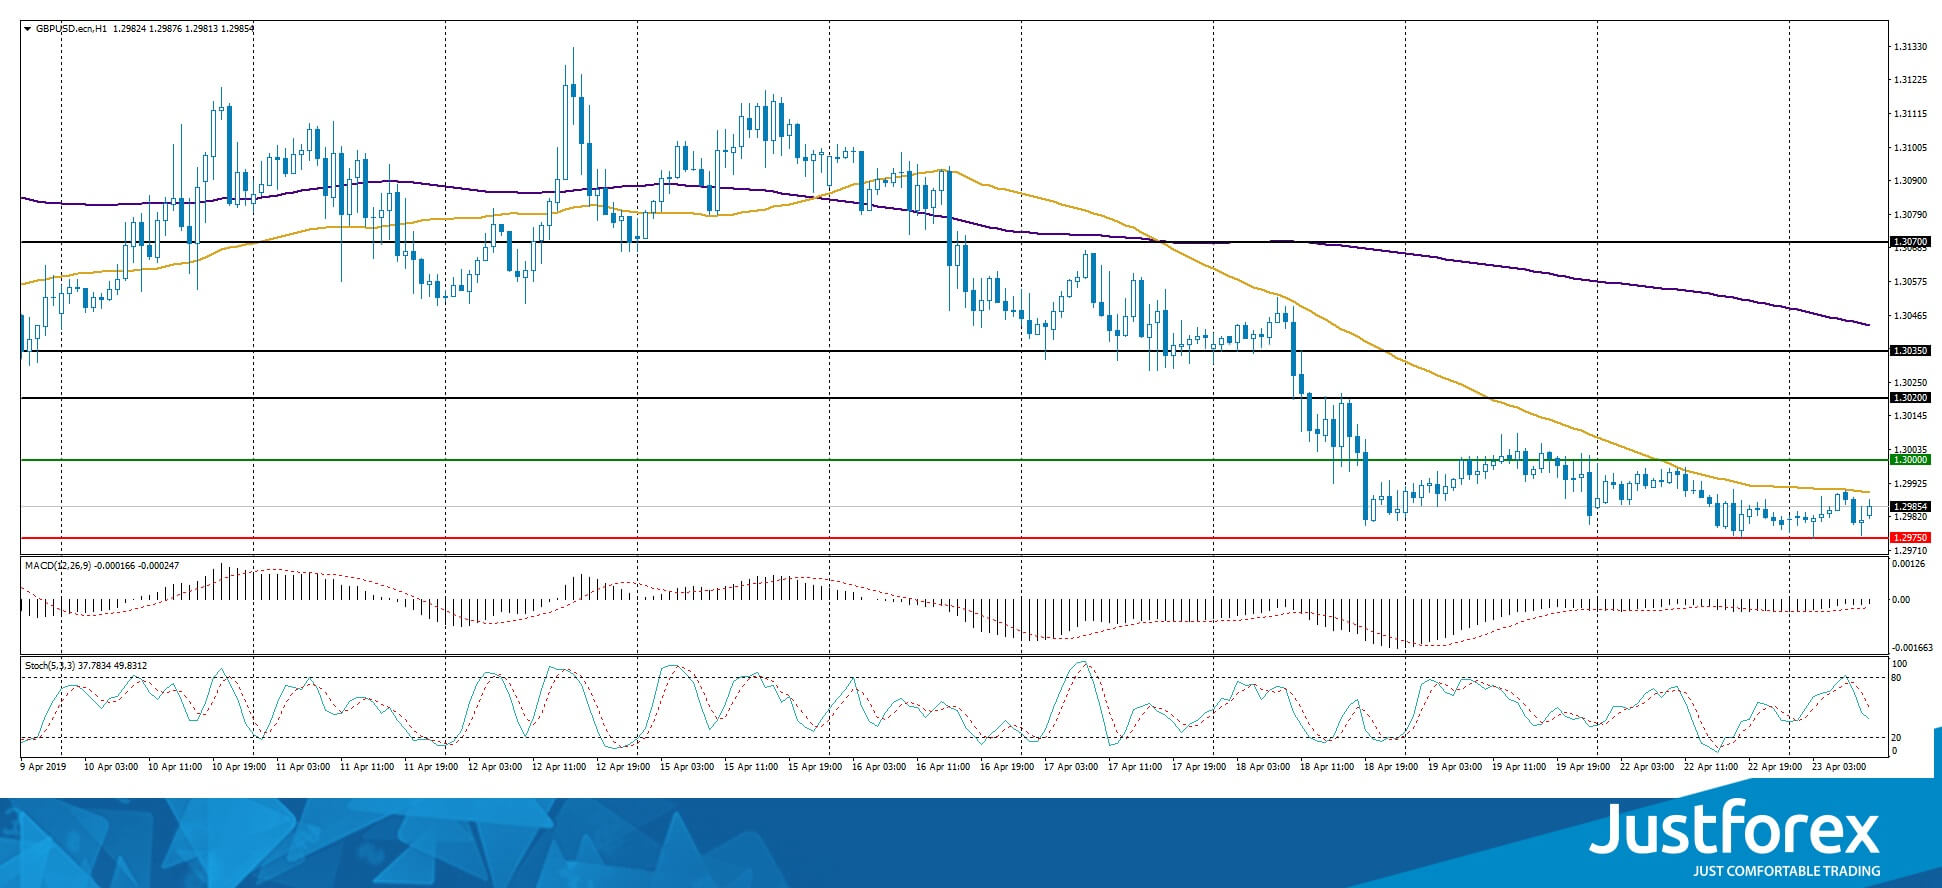
The price fixed below 50 MA and 200 MA which points to the power of the buyers.
The MACD histogram is in the negative zone but above the signal line which gives a weak signal to sell GBP/USD.
The Stochastic Oscillator is in the neutral zone, the %K line is below the %D line which points to the bearish mood.
Trading recommendations
Support levels: 1.29750, 1.29400, 1.29000
Resistance levels: 1.30000, 1.30200, 1.30350
If the price fixes below 1.29750, expect the quotes to fall toward 1.29500-1.29300.
Alternatively, the quotes can recover toward 1.30300-1.30500.
The USD/CAD currency pair
Technical indicators of the currency pair:
Prev Open: 1.33816
Open: 1.33499
% chg. over the last day: -0.27
Day's range: 1.33433 – 1.33714
52 wk range: 1.2248 – 1.3664
The USD/CAD currency pair is moving sideways. There is no defined trend. The demand for CAD remains high due to a bullish oil market. The WTI futures are the highest they've been since October 2018. The key support and resistance levels are 1.33400 and 1.33700. The USD/CAD quotes have a tendency to descend. You should open positions from the key levels.
The Economic News Feed for 23.04.2019 is calm.
Wholesale Sales Report (CAD) – 15:30 (GMT+3:00);
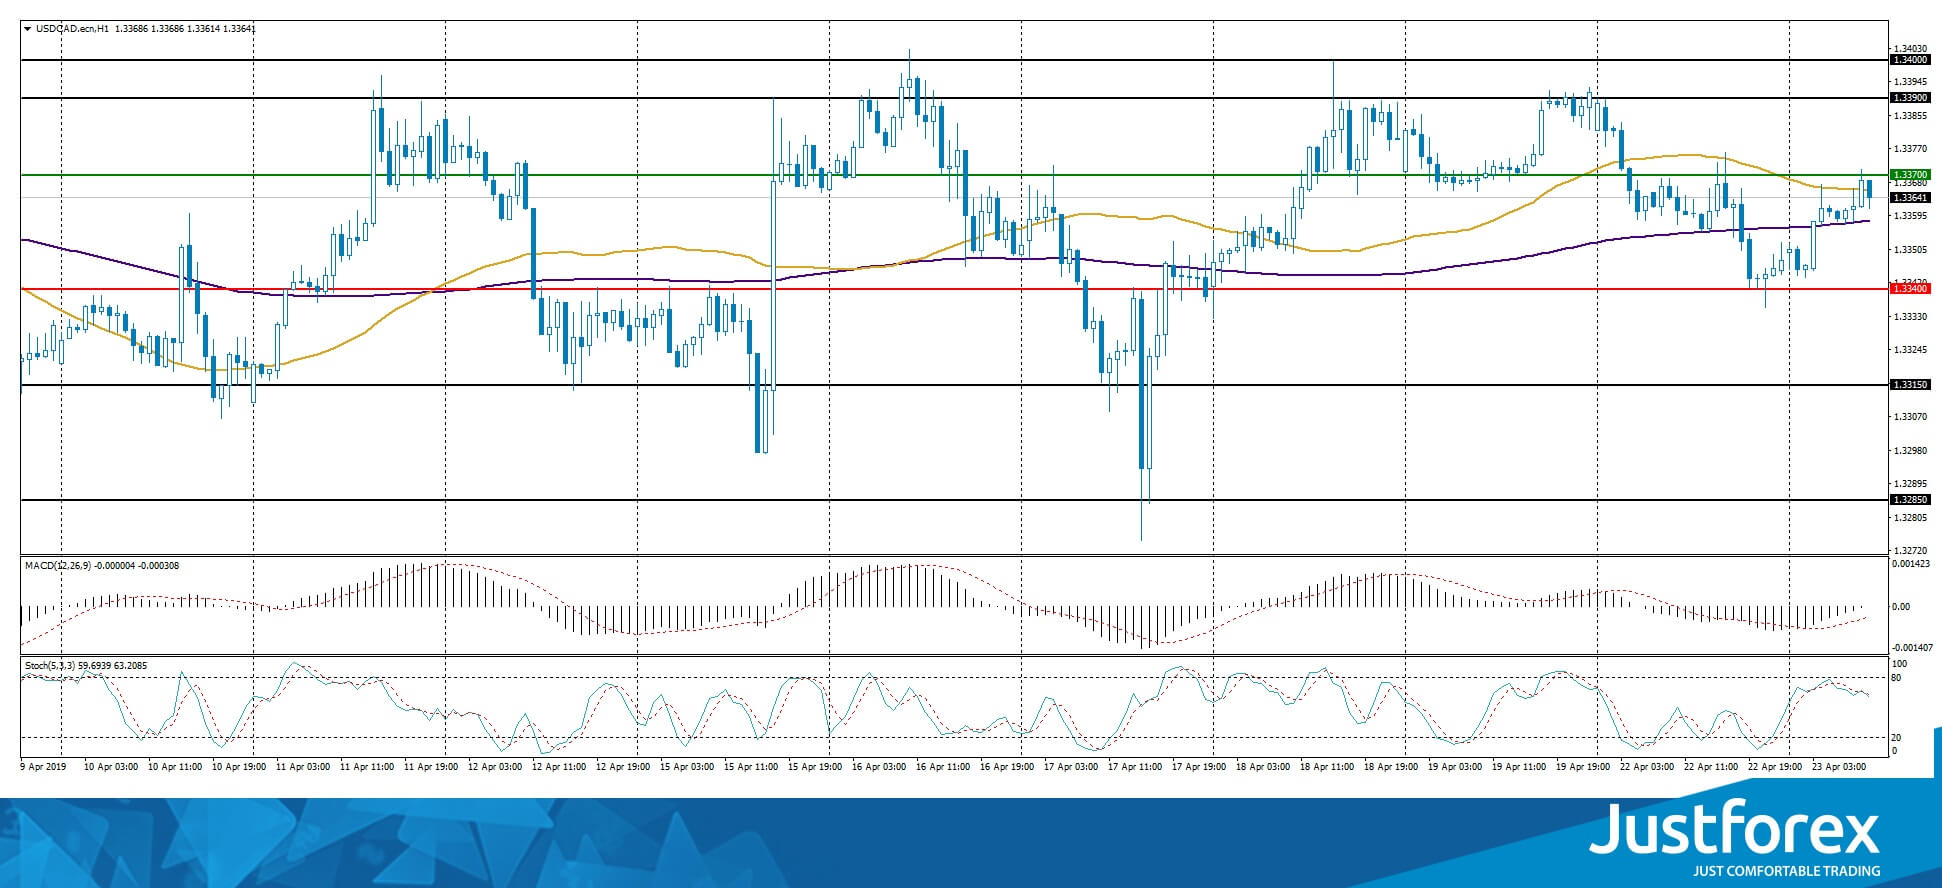
The indicators do not provide precise signals, the price has crossed 50 MA and 200 MA.
The MACD histogram is close to 0.
The Stochastic Oscillator is in the neutral zone, the %K line is crossing the %D line. There are no signals at the moment.
Trading recommendations
Support levels: 1.33400, 1.33150, 1.32850
Resistance levels: 1.33700, 1.34000
If the price fixes above 1.33400, expect the quotes to fall towards 1.33000.
Alternatively, the quotes can grow toward 1.34000-1.34200.
The USD/JPY currency pair
Technical indicators of the currency pair:
Prev Open: 111.863
Open: 111.919
% chg. over the last day: +0.02
Day's range: 111.652 – 111.976
52 wk range: 104.56 – 114.56
USD/JPY remains ambiguous. The technical instrument is moving sideways, the key support and resistance levels are 111.650 and 112.000. The USD/JPY quotes have a tendency to descend. Keep an eye on the real estate market and the US Treasury bonds yield. Open the positions from the key levels.
The Economic News Feed for 23.04.2019 is calm.
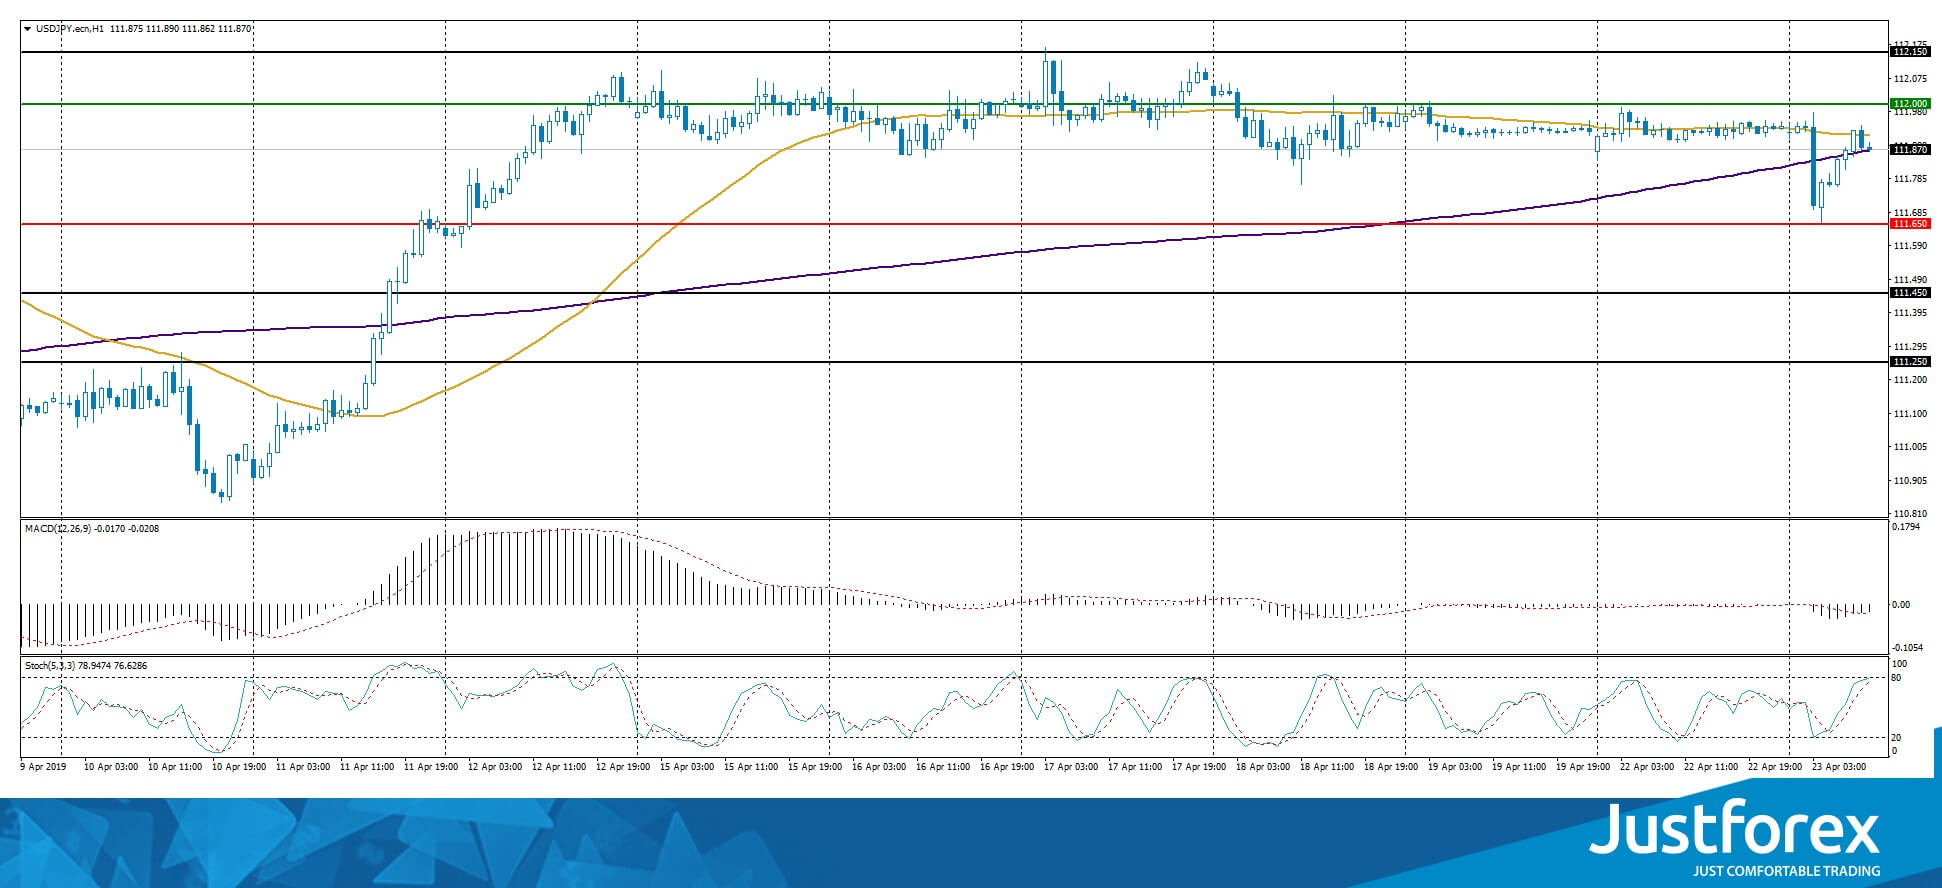
The indicators do not provide precise signals, the price has crossed 50 MA and 200 MA.
The MACD histogram is in the negative zone but above the signal line which gives a weak signal to sell USD/JPY.
The Stochastic Oscillator is in the neutral zone, the %K line is above the %D line which points towards a bullish mood.
Trading recommendations
Support levels: 111.650, 111.450, 111.250
Resistance levels: 112.000, 112.150, 112.500
If the price fixes above 111.650, expect further descend towards 111.400-111.200.
Alternatively, the quotes can grow towards 112.300-112.500.
The US Dollar Is Consolidating
The US dollar did not change a lot against the basket of major currencies amid low trading activity. Investors took a wait-and-see attitude before the publication of important economic releases from the US at the end of this week. The dollar index (#DX) closed in the negative zone (-0.20%). It also became known that the Fed officials began discussing possible conditions, upon the occurrence of which they would start lowering the base interest rate. Chicago Fed President, Charles Evans, believes that if inflation is stable below 2%, this will mean that the current rate of monetary policy is retaining, and then the rate will have to be lowered.
The Brexit delay could seriously affect the financial standing of the European Union. If the UK remains in its composition after the May elections to the EU Parliament, the bloc will be forced to pay salaries to the British deputies. This means additional expenses of 21 million euros.
Demand for safe assets due to tension regarding Iran has increased. It should be recalled that US President Donald Trump decided not to extend all Iran sanction waivers which would end by May 2. In turn, Iran has threatened to close the Strait of Hormuz, if Tehran cannot use it because of US restrictions.
The "black gold" prices continue to show positive dynamics. Oil quotes have updated annual highs again, which supports the demand for commodity currencies. At the moment, futures for the WTI crude oil are testing $66.00 per barrel. At 23:30 (GMT+3:00) API weekly crude oil stock will be published.
Market Indicators
- Yesterday, there was a variety of trends in the US stock market: #SPY (+0.09%), #DIA (-0.18%), #QQQ (+0.28%).
- The 10-year US government bonds yield is at the level of 2.58-2.59%.
The news feed for 2019.04.23:
- New home sales in the US at 17:00 (GMT+3:00).
US 100 Index Surges To All-Time High, Resumes Upside Outlook
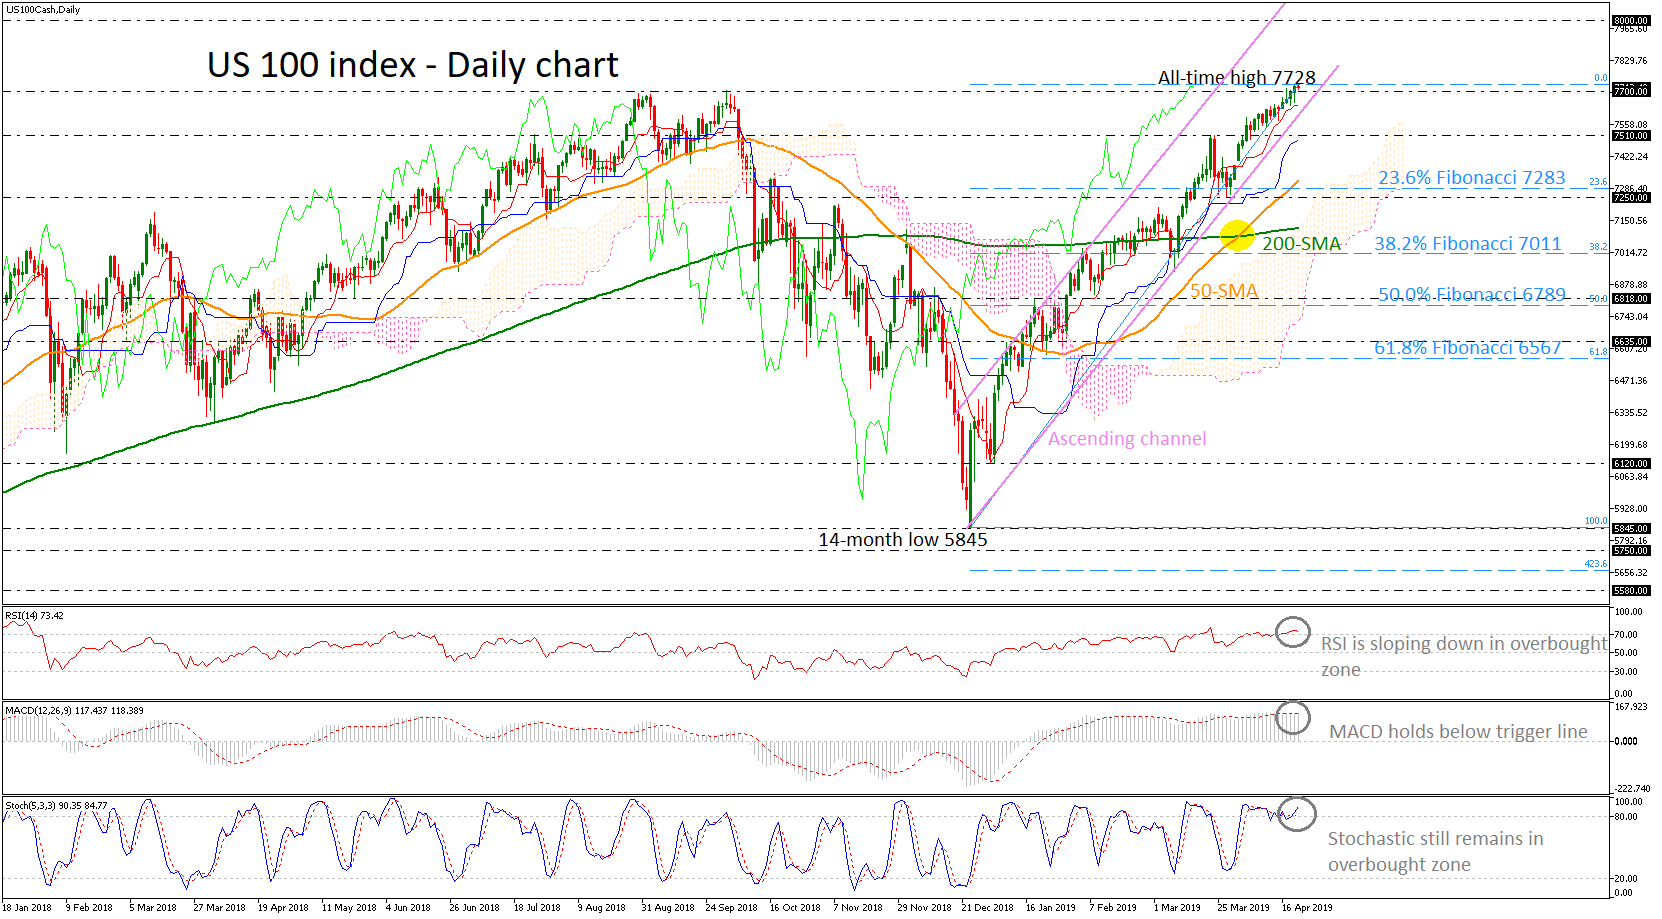
The US 100 index surged to a fresh all-time high of 7728 earlier today, confirming the recent significant bullish tendency in the medium- and long-terms and remaining inside the ascending channel following the rebound on the 14-month low of 5845 on December 2016.
However, the technical indicators seem to be overstretched, suggesting a possible downward correction could be near. Specifically, the RSI is turning lower in the overbought territory, while trigger line is slipping well above the zero line.
On the other hand, the stochastic oscillator is still developing above 80 and is sloping upwards, signaling more gains in the short term. It is worth mentioning that the 50- and 200-simple moving averages (SMAs) completed a ‘golden cross’ in the near term, but the 200-SMA is flattening.
An extension of the upward tendency could be faced only if the index surges above the all-time high and find resistance at the 8000 psychological level.
Alternatively, if momentum indicators prove that a bearish retracement is near, immediate support would come from the lower boundary of the ascending channel near the red Tenkan-sen line at 7637, while a move below that could see sellers challenging the 7510 barrier. Another sell-off could turn the bias to a more neutral one, opening the way for the 23.6% Fibonacci retracement level of the upleg from 5845 to 7728, near 7283, which stands near the 50-day SMA.
Overall, the near-term picture remains strongly positive, though a corrective pullback may be on the cards in the immediate term.
Elliott Wave Analysis Gold And BTC/USD Update
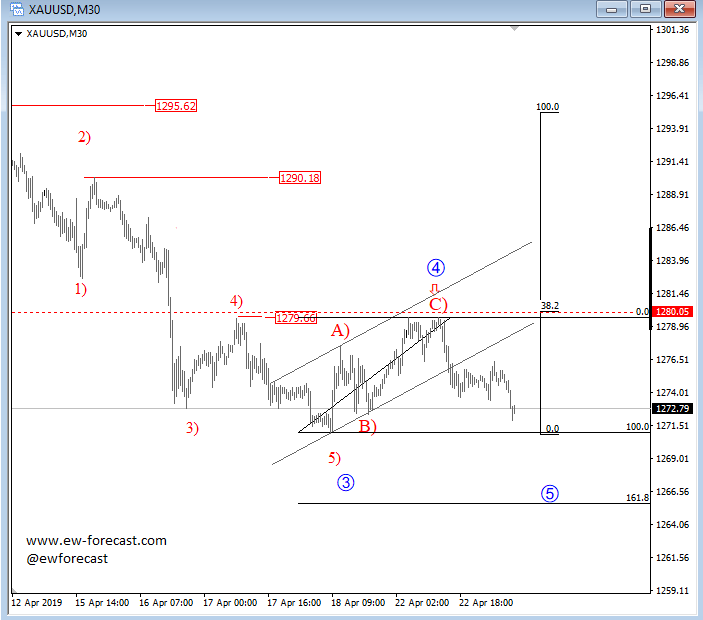
Gold is moving nicely lower after retesting 1280 about we talked last week. So far we can see a very nice move down so I think it's fifth wave in progress which can be underway to 1260/65 area, where downside can be limited this week as a new three wave rally may come in play.
GOLD, 30Min
As expected, Bitcoin is breaking nicely into new highs for wave (v) and there can be room even for 5800-6000 area within a five-wave cycle. However, it's fifth wave, so keep in mind that a deeper pullback may occur anytime.
BTCUSD, 1h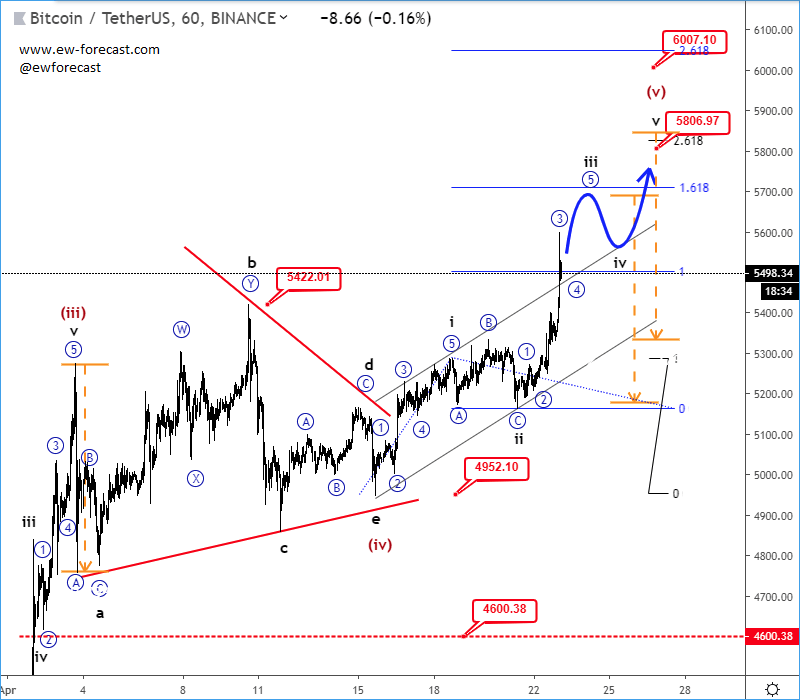
WTI Oil Futures Unlock Fresh Tops In Overbought Area
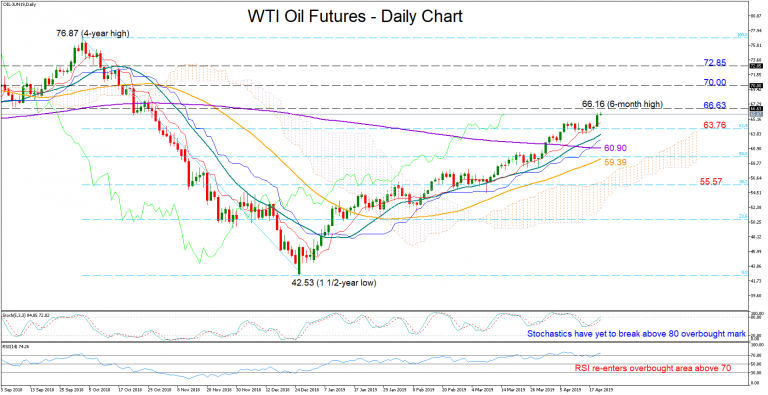
WTI oil futures extended their bullish momentum above the 66 level and towards fresh six-month highs on Tuesday. While the RSI has re-entered the overbought territory, the Stochastics have yet to post a bearish cross above 80, indicating that there is still some room for improvement in the short term. Trend signals are also positive as the market action is currently taking place above moving averages and the Ichimoku cloud.
The bulls are expected to find immediate resistance near 66.63, identified by the peak on January 2017. To take the rally to the next level however, they would have to overcome the 70 level, which is half-way up the aggressive sell-off in August 2013. Higher, another key resistance is located around 72.85.
A reversal to the downside could first retest the 61.8% Fibonacci of 63.76 of the downleg from 76.87 to 42.53. Moving lower, the area between the 200- and the 50-day moving averages (60.98-59.39) that encapsulates the 50% Fibonacci could be the trigger point of a steeper decline that would open the way towards the 38.2% Fibonacci of 55.57. Any close below the latter would shift the medium-term outlook from bullish to neutral.
In brief, the short-term bias is cautiously bullish as the market trades near overbought levels, while in the medium-term picture the market remains in positive mode as long as it holds above 55.57. It is also worth noting that a golden cross between the 50- and the 200-day MAs seems to be in progress as the lines approach each other.