Sample Category Title
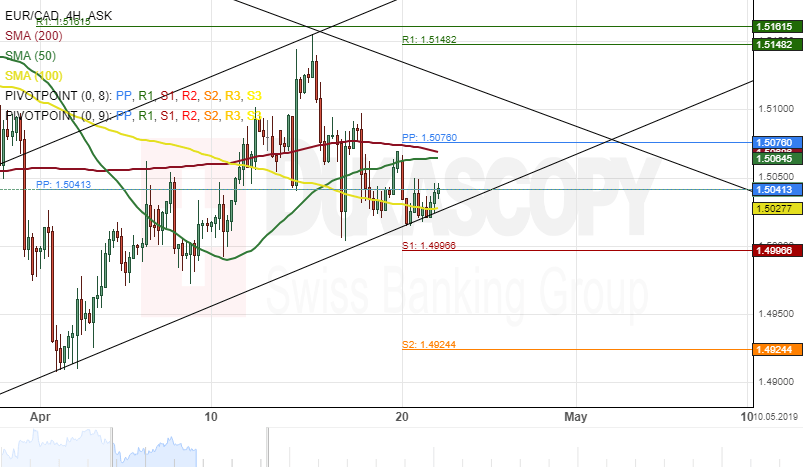
EUR/CAD 4H Chart: Set For Breakout
During the past week, the common European currency has depreciated about 0.90% in value against the Canadian Dollar. The currency pair has tested the lower band of an ascending channel pattern at 1.5016.
Technical indicators demonstrate that a breakout through the bottom border of an ascending channel could occur within this session.
If the breakout occurs, the EUR/CAD exchange rate will aim for a psychological support level at 1.4900 before the end of this week trading sessions.
However, if the uptrend channel holds, a surge towards a resistance cluster at 1.5148 could be expected.
EURUSD Struggling For Direction
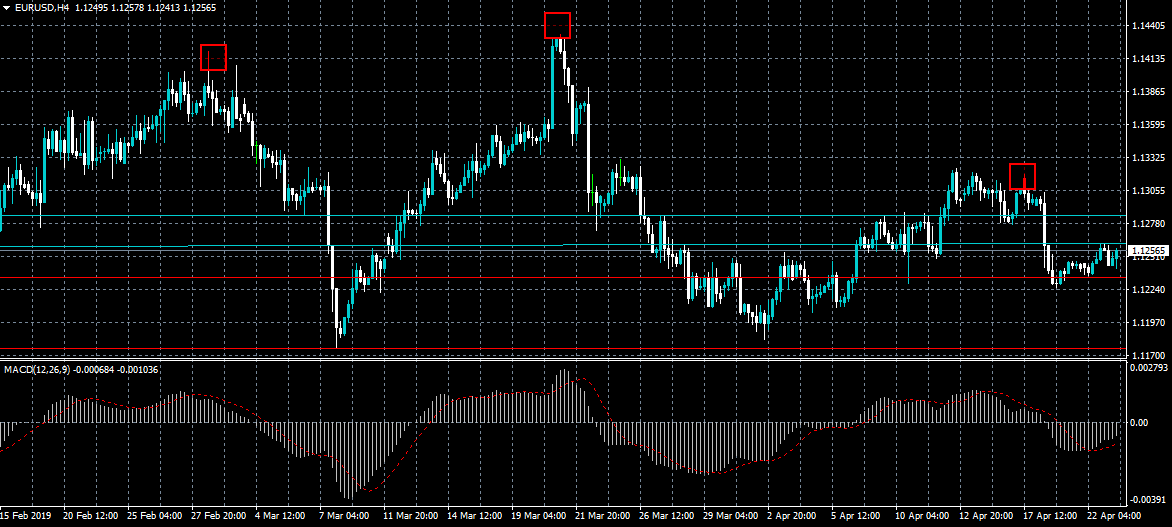
The euro has struggled to find direction against the US dollar during the European trading session as bulls and bears battle for short-term control of the pair. The weekly bias towards the EURUSD pair still remains bearish while price trades below the 1.1280 level. Overall, the head and shoulders pattern on the four-hour time frame is also adding to negative sentiment surrounding the EURUSD.
The EURUSD pair is intraday bearish while trading below the 1.1250 level, key technical support remains at the 1.1230 and 1.1216 levels.
If the EURUSD pair trades above 1.1250 level, key intraday resistance is found at the 1.1280 and 1.1300 levels.
GBPUSD Testing Pattern Break
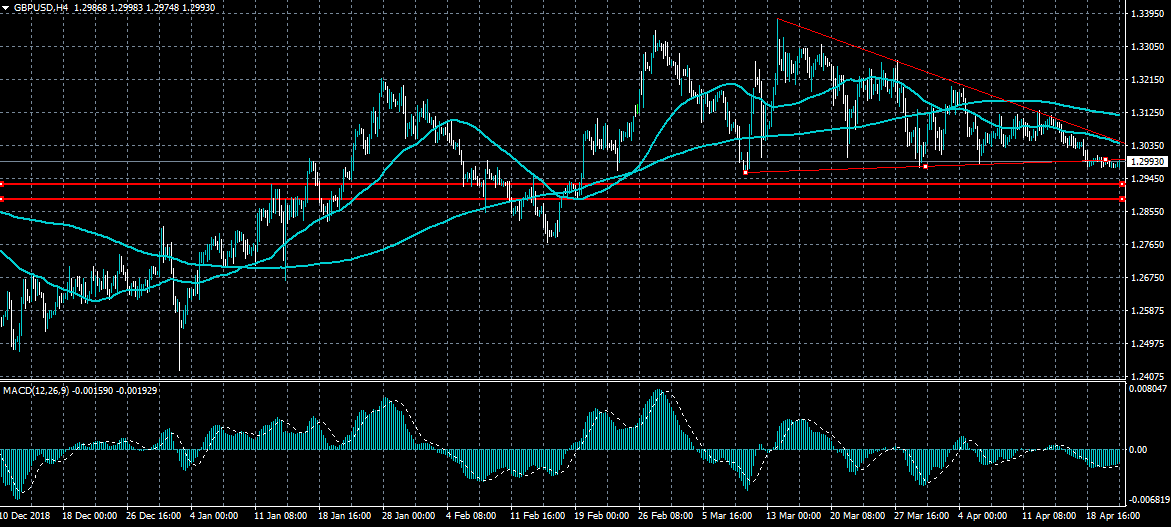
The British pound is attempting to recover higher against the US dollar after finding interim technical support from the 1.2970 level. The four-hour time frame is showing that GBPUSD buyers are now testing back towards bearish breakout area of the wedge pattern. If buyers move price back inside the pattern, the 1.3035 level offers the strongest area of technical resistance.
The GBPUSD pair only heavily bearish while trading below the 1.300 level, key support is found at the 1.2970 and 1.2940 levels.
If the GBPUSD pair trades above 1.3000 level, key intraday resistance is found at the 1.3035 and 1.3060 levels.
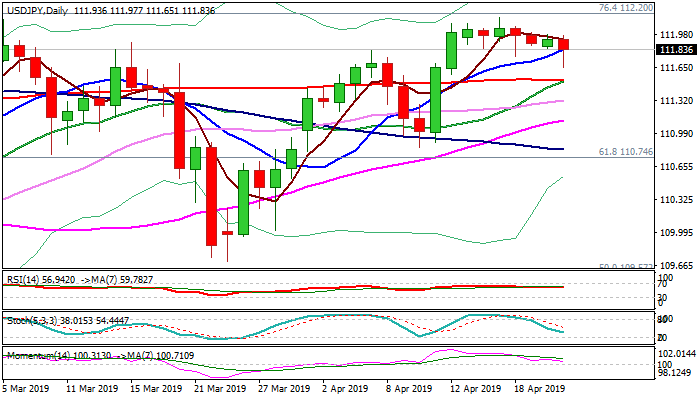
USD/JPY Ourlook: Converged 20/200SMA’s Continue To Strongly Underpin Near-Term Action
The pair recovered quickly from overnight’s drop to 111.65 and holding within tight range between 10SMA (111.83) and psychological 112 barrier in European trading on Tuesday.
Dip-buying after overnight’s selling by Japanese exporters, keeps broader bullish bias, with action being strongly underpinned by converged 20/200SMA’s (111.51), which attempt to for golden-cross.
Weaker daily momentum would reduce the pace of upside aaction, with extended consolidation seen as likely near-term scenario.
Only break below 20/200SMA’s would weaken the structure and risk deeper pullback.
US New Home sales are in focus today, but Friday’s release of US GDP data is seen as key event, which is expected to provide stronger direction signal.
Res: 112.00, 112.20, 112.60, 113.00
Sup: 111.65, 111.51, 111.31, 111.12
Oil Continues Higher As Sanctions Waiver Expiry Nears
Markets mixed after relaxing bank holiday
It's been a slow start to the trading week following the long bank holiday weekend, with European markets once again mixed and US futures offering little of more interest.
The lack of direction at the start of the week isn't surprising given the quiet bank holiday weekend but thankfully, things should pick up. Earnings season has got off to a better than expected start and we have a large number of companies reporting over the next few days. It's still expected to be a challenging quarter for the corporates but the bar has been sufficiently lowered which may allow them to get through the season relatively unscathed. We're certainly off to a good start on that front with US markets very close to record highs.
In the UK we've been granted a short break from Brexit – to everyone's relief – which means news flow is light. The economic calendar is also a little bare, with a couple of central bank meetings – BoJ and BoC – and US GDP this week the only standout events. It's perhaps no surprise then that people have become far more interested in the oil markets, one of the few areas where we are seeing some activity as Iranian oil wavers near expiry.
Oil continues higher as sanctions waiver expiry nears
Oil prices are creeping higher again on Tuesday, although they have lost a little of the spark that saw them steamroll through yet another key resistance area at the start of the week. There isn't much doubt about the trigger for the latest rally, with Trump's decision not to extend waivers on imports of Iranian oil beyond May unsurprisingly providing further upward pressure – although I'm sure he'll just blame OPEC.
The rally took gains in WTI to more than 50%, since it bottomed out back in December. That's not a bad return and makes the OPEC+ meeting in June all the more interesting, with an extension to December now a doubt, especially with Russian support already a doubt. Reports that Saudi Arabia and UAE will make up the shortfall from the sudden decline in Iranian output is doing little to stop the moves, given that both are currently cutting production to comply with the agreement.
Gold enters into tight range after breakout
Gold has held steady in a tight range over the last week, with the break below $1,280 so far failing to trigger a larger decline. This had been a strong area of support since the start of the year so a break below had the potential to drive further losses but instead we've just consolidated. That's not to say further downside won't follow but it was concerning that the greenback rallied strongly on Thursday and gold barely moved, in fact it actually posted slight gains. Not what you'd expect in a very bearish market.
So we now find ourselves in quite a tight range between $1,270 and $1,2800. A break lower will draw attention to $1,260, the next notable area of support, while a break back above $1,280 would make $1,290 very interesting. These are tight ranges but that's where we find the gold market at the moment.
Earnings Season Kicks Into High Gear, Bitcoin Rallies
Asian equities closed mixed this morning as many markets reopened after the Easter break.
Market players seem to be adopting a cautious approach ahead of the next wave of corporate earnings and this continues to be reflected across global stocks. With earnings season kicking into higher gear, this will certainly be another busy week for financial markets as investors try to access the health of the global economy. The earnings calendar for this week is jampacked, with Twitter, Facebook, Microsoft, Exxon andmany others under the spotlight. Should earnings from these big companies disappoint, appetite for riskier assets is poised to take a hit as renewed growth fears send investors to safe-haven assets.
Bitcoin hits fresh 2019 high…what next?
Elsewhere, Bitcoin marched to a fresh 2019 high above $5600 during the Asia trading session on Tuesday morning.
With the sharp and abrupt appreciation happening within a 30-minute window and no reports released explaining the cause, the culprit could be price action. The technical picture for BTCUSD is looking increasingly bullish on the daily charts with the fabled bullish ‘golden cross’ slowlycoming into play. Should the 50-day simple moving average cross above the 200-day moving average, bulls could be injected with enough inspiration to attack $6000.
Gold struggles to push back above $1280
Gold’s performance in recent weeks has been bearish thanks to a stabilizing Dollar, easing concerns over slowing global growth and rising equity markets.
While the yellow metal is likely to edge lower in the near term, the medium to longer term outlook still points in favour of further upside. The combination of geopolitical risk factors, US-China trade developments, lingering concerns over slowing global growth, Brexit and a dovish Federal Reserve remain core themes that have the potential to boost appetite for Gold.
Much attention will be directed towards the US Q1 GDP data on Friday which should provide fresh insight into the health of the largest economy in the world. Should the GDP data disappoint expectations, Gold is seen re-challenging $1280 and potentially $1300.
Focusing on the technical picture, bears still remain in control below the $1280 level. Sustained weakness below this point could open the gates towards $1260.
EUR/JPY Pressure By SMAs
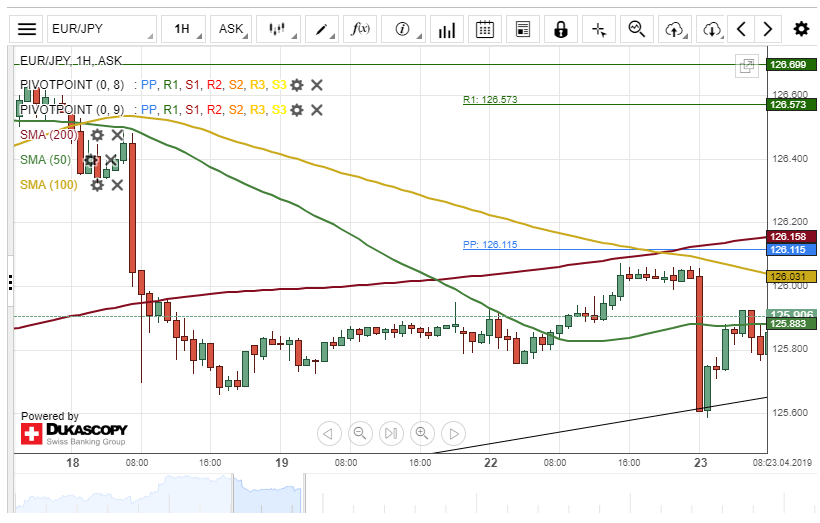
The 200-hour simple moving average has pressured the common European currency lower against the Japanese Yen. The currency pair tested the bottom border of an ascending channel pattern at 125.60 during the Asian session on Tuesday.
Everything being equal, it is likely that the EUR/JPY currency exchange rate will strengthen within this session. The potential upside target will be near a swing high of 126.69.
However, a resistance cluster formed by the combination of the 100– and 200– hour SMAs and the weekly PP at 126.11 could hinder such movement during the following trading session.
AUD/USD Buy Signals Today
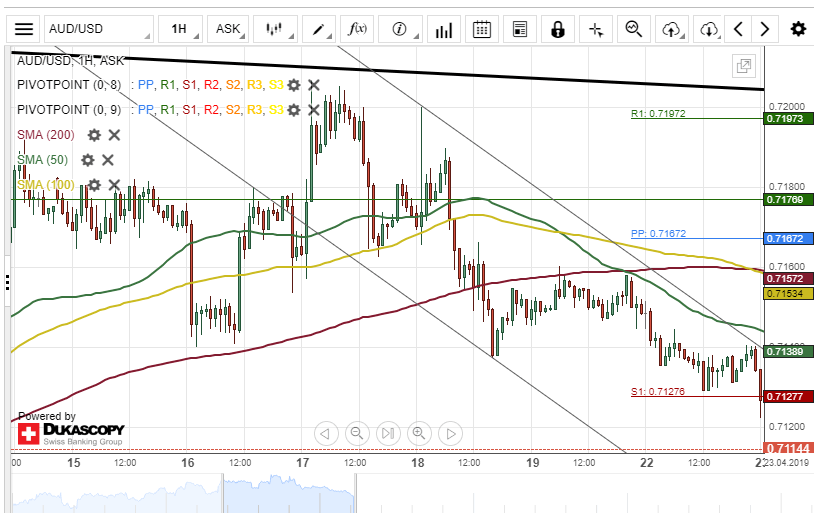
A one-week descending channel pattern has guided the Australian Dollar lower against the US Dollar. The currency pair breached a support level formed by the weekly S1 at 0.7127 during the first part of Tuesday's trading session.
Technical indicators flash strong buy signals on the daily time-frame chart. Therefore, a potential bullish reversal is likely to occur in the shorter term.
However, given that the currency exchange rate has been dominated by bears during the past week, most likely, the decline will continue during the following trading session. The AUD/USD currency pair might aim for the weekly S2 at 0.7097 today.
USD/CAD Gradually Gaining Strength
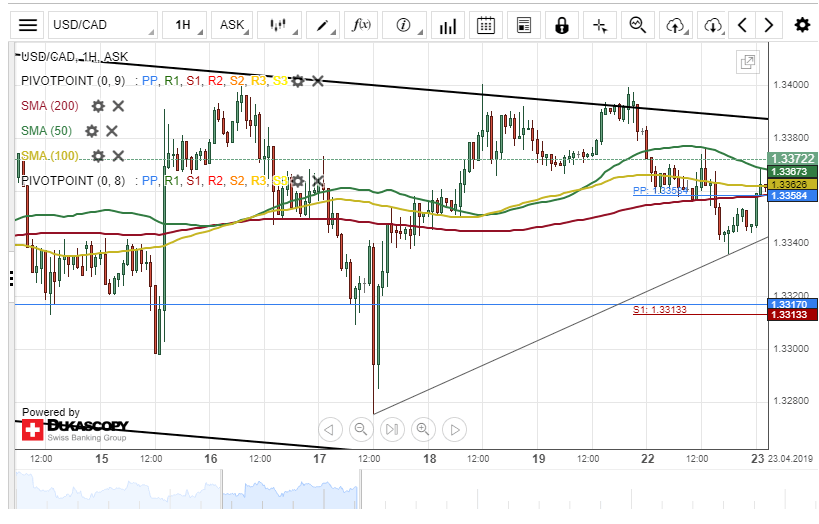
The US Dollar is gradually gaining strength against the Canadian Dollar. The currency pair has breached a resistance level formed by the 50-, 100– and 200-hour simple moving averages.
Everything being equal, it is likely that the USD/CAD currency pair will aim for a re-test of a swing high of 1.3400 during the following trading session.
On the other hand, the currency exchange rate could reverse from the current price level at 1.3367 and move past a support cluster formed by the combination of the 50-, 100– and 200 SMAs at 1.3358, the pair might end this week's trading session with a 150 base points decline.
NZD/USD Bears Market
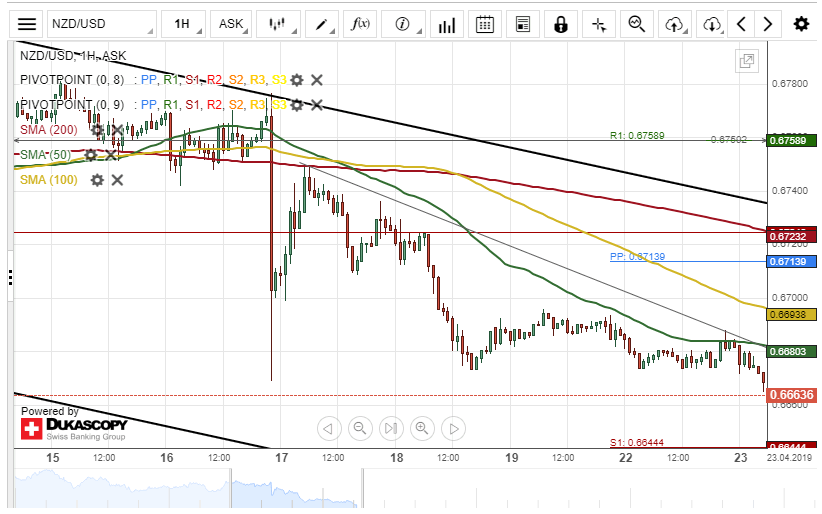
The New Zealand Dollar was pressured south by the 50-hour simple moving average. The currency pair tested the resistance level formed by the 50-hour SMA at 0.6682 during the Asian session on Tuesday.
By and large, it is likely that the Kiwi will continue to lose strength against the Greenback during the following trading session. The potential downside target will be at the lower band of a descending channel pattern at 0.6599.
However, a support cluster formed by the combination of the weekly and the monthly PPs at 0.6644 could prevent bears from pushing the currency exchange rate lower in the shorter term.